ATS Corporation and Nano Nuclear Energy Inc are two innovators in the industrial machinery sector, each carving distinct paths in automation and microreactor technologies. ATS focuses on comprehensive automation solutions across diverse markets, while Nano Nuclear Energy pioneers advanced nuclear microreactors. Their shared industry and commitment to cutting-edge technology make them compelling candidates for comparison. Join me as we explore which company presents the most attractive investment opportunity in 2026.

Table of contents
Companies Overview
I will begin the comparison between ATS Corporation and Nano Nuclear Energy Inc by providing an overview of these two companies and their main differences.
ATS Overview
ATS Corporation, founded in 1978 and headquartered in Cambridge, Canada, provides automation solutions globally. It focuses on designing, building, and servicing automated manufacturing and assembly systems across various industries including life sciences, transportation, electronics, and energy. The company also offers engineering, software, and digital solutions to enhance operational efficiency and sustainable production.
NNE Overview
Nano Nuclear Energy Inc, established in 2021 and based in New York City, develops microreactor technology including solid-core and low-pressure coolant reactors. It is also building a uranium fuel fabrication facility and offers nuclear fuel transportation and consultation services. Despite its recent founding, NNE aims to impact the nuclear reactor industry with innovative energy solutions.
Key similarities and differences
Both companies operate in the industrial machinery sector but differ significantly in scale and focus. ATS is a large, diversified automation provider with 7,500 employees and a $2.8B market cap, while NNE is a small microreactor developer with 5 employees and a $1.3B market cap. ATS emphasizes manufacturing automation across multiple markets, whereas NNE concentrates on nuclear microreactors and fuel services.
Income Statement Comparison
This table compares the most recent fiscal year income statement metrics for ATS Corporation and Nano Nuclear Energy Inc, providing a snapshot of their financial performance.
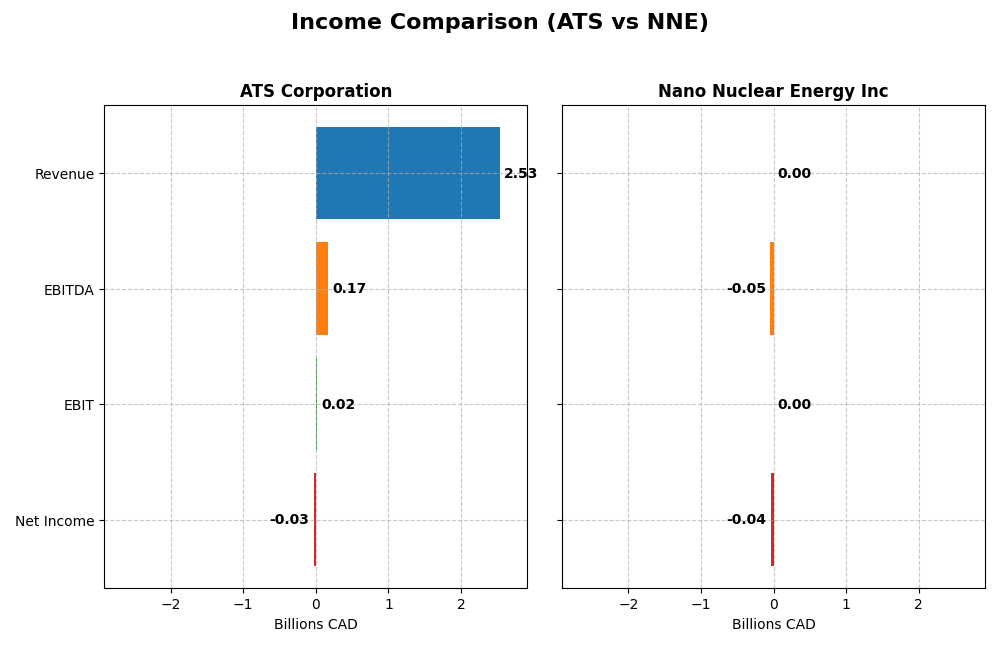
| Metric | ATS Corporation (2025, CAD) | Nano Nuclear Energy Inc (2025, USD) |
|---|---|---|
| Market Cap | 2.82B | 1.33B |
| Revenue | 2.53B | 0 |
| EBITDA | 168M | -46.2M |
| EBIT | 15.3M | 0 |
| Net Income | -28.0M | -40.1M |
| EPS | -0.29 | -1.06 |
| Fiscal Year | 2025 | 2025 |
Income Statement Interpretations
ATS Corporation
Over 2021-2025, ATS Corporation showed a revenue increase of 77.15%, but its net income declined by 143.76%. Gross margins remained relatively strong at 25.53%, while EBIT margin was stable but low at 0.6%. The latest fiscal year marked a significant revenue drop of 16.47% and a steep net income decline, resulting in a negative net margin of -1.11%, indicating recent operational challenges.
Nano Nuclear Energy Inc
Nano Nuclear Energy reported zero revenue from 2022 to 2025, with consistent net losses and no gross or EBIT margins. While the company saw favorable growth in gross profit and EBIT in the latest year, these reflect improvements from zero or negative bases. Overall, net income drastically worsened by 3783.13%, and net margin stayed at zero, highlighting ongoing development-stage losses without commercial revenue.
Which one has the stronger fundamentals?
Both ATS Corporation and Nano Nuclear Energy display unfavorable overall income statement evaluations, with ATS having positive revenue growth but declining profitability, and Nano Nuclear Energy showing no revenue and persistent losses. ATS’s established revenue base contrasts with NNE’s developmental phase, yet both face significant profitability issues, suggesting cautious scrutiny of their financial health and risk profiles.
Financial Ratios Comparison
The table below presents the most recent key financial ratios for ATS Corporation and Nano Nuclear Energy Inc, providing a side-by-side view for comparison based on their latest fiscal data.
| Ratios | ATS Corporation (2025 FY) | Nano Nuclear Energy Inc (2025 FY) |
|---|---|---|
| ROE | -1.64% | -18.00% |
| ROIC | 0.09% | -20.51% |
| P/E | -125.28 | -0.04 |
| P/B | 2.06 | 0.01 |
| Current Ratio | 1.69 | 53.48 |
| Quick Ratio | 1.41 | 53.48 |
| D/E | 1.00 | 0.01 |
| Debt-to-Assets | 36.79% | 1.22% |
| Interest Coverage | 0.09 | 0 |
| Asset Turnover | 0.55 | 0 |
| Fixed Asset Turnover | 5.66 | 0 |
| Payout ratio | 0 | 0 |
| Dividend yield | 0 | 0 |
Interpretation of the Ratios
ATS Corporation
ATS Corporation shows a mixed ratio profile with favorable liquidity metrics such as a current ratio of 1.69 and a quick ratio of 1.41, indicating good short-term financial health. However, profitability ratios like net margin (-1.11%) and return on equity (-1.64%) are unfavorable, signaling operational challenges. ATS does not pay dividends, reflecting a possible reinvestment focus or cash flow constraints.
Nano Nuclear Energy Inc
Nano Nuclear Energy’s ratios depict significant weaknesses, with negative returns on equity (-18.0%) and invested capital (-20.51%), alongside a high weighted average cost of capital (14.46%). Its extremely high current ratio (53.48) suggests an unusual liquidity structure. The company also does not distribute dividends, likely due to its early-stage development and negative earnings.
Which one has the best ratios?
Comparing both, ATS Corporation has a slightly unfavorable but more balanced ratio set, with some favorable liquidity and valuation metrics. In contrast, Nano Nuclear Energy’s ratios appear predominantly unfavorable, reflecting high risk and operational instability. Therefore, ATS exhibits relatively stronger financial ratios despite some profitability concerns.
Strategic Positioning
This section compares the strategic positioning of ATS Corporation and Nano Nuclear Energy Inc, including market position, key segments, and exposure to technological disruption:
ATS Corporation
- Established market presence in industrial machinery with moderate competitive pressure.
- Diversified across automation solutions serving life sciences, transportation, consumer products, and energy sectors.
- Moderate exposure through automation products and factory digital solutions in evolving industries.
Nano Nuclear Energy Inc
- Smaller, emerging player in microreactor technology facing high competitive pressure.
- Focused on microreactor development, fuel fabrication, and nuclear consultation services.
- High exposure due to innovation in solid-core and low-pressure coolant nuclear reactors.
ATS Corporation vs Nano Nuclear Energy Inc Positioning
ATS has a diversified industrial automation portfolio across multiple sectors, providing stability but with declining profitability. NNE is highly concentrated in microreactor technology with growing profitability but faces greater market volatility and competitive risk.
Which has the best competitive advantage?
Both companies are currently shedding value versus their capital costs. ATS shows a very unfavorable moat with declining returns, while NNE has a slightly unfavorable moat but improving profitability, indicating a modestly stronger competitive position.
Stock Comparison
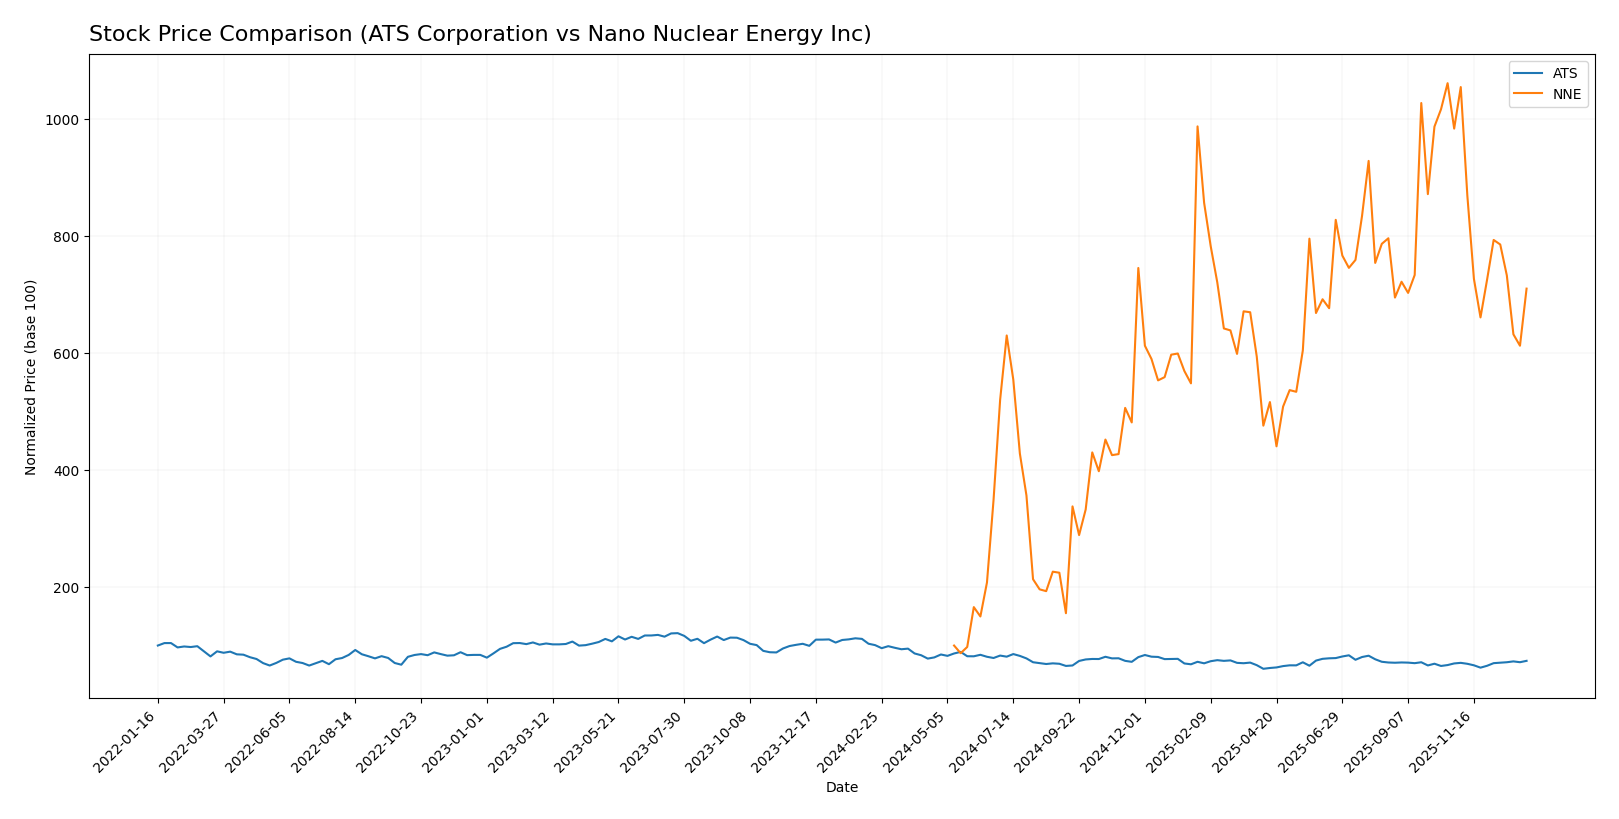
The stock price movements over the past year reveal contrasting dynamics between ATS Corporation and Nano Nuclear Energy Inc, with ATS experiencing a prolonged bearish phase and recent recovery, while NNE shows a strong bullish surge followed by a marked pullback.
Trend Analysis
ATS Corporation’s stock shows a bearish trend over the past 12 months with a price decline of 26.66% and accelerating downward momentum. The stock fluctuated between a high of 39.27 and a low of 23.5, with moderate volatility (std deviation 3.24).
Nano Nuclear Energy Inc exhibited a highly bullish trend over the same period, gaining 609.76%, though with decelerating growth. The stock ranged from 3.92 to 47.84 and showed significant volatility (std deviation 10.81). Recently, it reversed with a 27.81% decline.
Comparing both, Nano Nuclear Energy Inc delivered the highest market performance despite recent weakness, while ATS showed an overall negative trend with signs of short-term recovery.
Target Prices
The current analyst consensus indicates clear target prices for ATS Corporation and Nano Nuclear Energy Inc.
| Company | Target High | Target Low | Consensus |
|---|---|---|---|
| ATS Corporation | 34 | 34 | 34 |
| Nano Nuclear Energy Inc | 50 | 50 | 50 |
Analysts expect ATS Corporation’s stock to rise moderately from $28.8 to $34, while Nano Nuclear Energy’s stock shows potential upside from $32.01 to $50, reflecting higher growth expectations.
Analyst Opinions Comparison
This section compares analysts’ ratings and grades for ATS Corporation and Nano Nuclear Energy Inc:
Rating Comparison
ATS Rating
- Rating: C, considered Very Favorable overall by analysts.
- Discounted Cash Flow Score: Moderate, with a value of 3 indicating fair valuation.
- ROE Score: Very Unfavorable at 1, reflecting low profit generation efficiency.
- ROA Score: Very Unfavorable at 1, showing weak asset utilization.
- Debt To Equity Score: Very Unfavorable at 1, indicating high financial risk.
- Overall Score: Moderate at 2, summarizing the financial standing as average.
NNE Rating
- Rating: C, also considered Very Favorable overall by analysts.
- Discounted Cash Flow Score: Moderate, scoring 2, showing a slightly lower valuation.
- ROE Score: Very Unfavorable at 1, similarly indicating poor equity profit generation.
- ROA Score: Very Unfavorable at 1, equally reflecting ineffective asset use.
- Debt To Equity Score: Very Favorable at 5, implying strong balance sheet stability.
- Overall Score: Moderate at 2, also summarizing average financial standing.
Which one is the best rated?
Both ATS and NNE share an identical overall rating of C and moderate overall scores of 2. NNE shows a notably stronger debt-to-equity score, indicating better financial stability, while ATS has a higher discounted cash flow score, suggesting a slightly better valuation outlook.
Scores Comparison
Here is a comparison of the Altman Z-Score and Piotroski Score for ATS Corporation and Nano Nuclear Energy Inc:
ATS Scores
- Altman Z-Score: 1.68, in distress zone, indicating high bankruptcy risk.
- Piotroski Score: 3, classified as very weak financial strength.
NNE Scores
- Altman Z-Score: 143.56, in safe zone, indicating very low bankruptcy risk.
- Piotroski Score: 2, also classified as very weak financial strength.
Which company has the best scores?
Based strictly on the provided scores, NNE has a far stronger Altman Z-Score indicating better bankruptcy safety, while both companies show very weak Piotroski Scores. Overall, NNE’s scores suggest stronger financial stability.
Grades Comparison
Here is a comparison of the recent grades assigned to ATS Corporation and Nano Nuclear Energy Inc:
ATS Corporation Grades
The table below shows the latest grades from reputable financial institutions for ATS Corporation.
| Grading Company | Action | New Grade | Date |
|---|---|---|---|
| JP Morgan | Maintain | Neutral | 2024-08-13 |
| Goldman Sachs | Maintain | Sell | 2024-08-13 |
| JP Morgan | Maintain | Neutral | 2024-05-24 |
ATS Corporation’s grades predominantly indicate a neutral to sell stance, reflecting cautious sentiment among analysts.
Nano Nuclear Energy Inc Grades
The table below presents recent grades from established grading companies for Nano Nuclear Energy Inc.
| Grading Company | Action | New Grade | Date |
|---|---|---|---|
| HC Wainwright & Co. | Maintain | Buy | 2025-08-19 |
| Ladenburg Thalmann | Downgrade | Sell | 2025-08-18 |
| HC Wainwright & Co. | Maintain | Buy | 2025-08-15 |
| HC Wainwright & Co. | Maintain | Buy | 2025-03-31 |
| HC Wainwright & Co. | Maintain | Buy | 2025-01-29 |
| HC Wainwright & Co. | Maintain | Buy | 2024-11-27 |
| Benchmark | Maintain | Buy | 2024-11-07 |
| Benchmark | Maintain | Buy | 2024-07-15 |
| Benchmark | Maintain | Buy | 2024-06-25 |
Nano Nuclear Energy Inc’s grades mostly reflect a strong buy consensus, though there is a notable recent downgrade to sell by Ladenburg Thalmann.
Which company has the best grades?
Nano Nuclear Energy Inc has received generally more favorable grades than ATS Corporation, with multiple buy ratings versus ATS’s hold and sell ratings. This difference may influence investors by signaling stronger analyst confidence in Nano Nuclear Energy’s prospects compared to ATS’s more cautious outlook.
Strengths and Weaknesses
Below is a comparative overview of the key strengths and weaknesses for ATS Corporation and Nano Nuclear Energy Inc based on their most recent financial and strategic data.
| Criterion | ATS Corporation | Nano Nuclear Energy Inc |
|---|---|---|
| Diversification | Moderate, with stable asset turnover (0.55) | Limited, with zero asset turnover reported |
| Profitability | Negative net margin (-1.11%), declining ROIC, value destroying | Negative profitability metrics, but improving ROIC trend |
| Innovation | Moderate fixed asset turnover (5.66), but declining economic moat | Low innovation indicators with zero fixed asset turnover |
| Global presence | Neutral debt levels and liquidity ratios suggest moderate operational scale | Very low debt, high liquidity but limited global footprint |
| Market Share | Slightly unfavorable PE ratio but stable market presence | Favorable PE and PB ratios but very small market share and unfavorable margins |
Key takeaways: ATS Corporation shows moderate operational efficiency but suffers from declining profitability and value destruction. Nano Nuclear Energy Inc is still in a nascent stage with improving profitability trends but faces significant challenges in market presence and overall financial health. Caution is advised for both, with a focus on risk management.
Risk Analysis
Below is a comparative table outlining key risk metrics for ATS Corporation and Nano Nuclear Energy Inc based on the latest 2025 data.
| Metric | ATS Corporation | Nano Nuclear Energy Inc |
|---|---|---|
| Market Risk | Beta 1.27 (moderate) | Beta 7.49 (very high) |
| Debt level | Debt-to-Equity 1.0 (neutral) | Debt-to-Equity 0.01 (very favorable) |
| Regulatory Risk | Moderate (industrial sector, nuclear exposure) | High (nuclear technology, new microreactors) |
| Operational Risk | Moderate (7.5K employees, global operations) | High (only 5 employees, early-stage tech) |
| Environmental Risk | Moderate (manufacturing and energy exposure) | High (nuclear fuel and reactor development) |
| Geopolitical Risk | Moderate (Canada-based, global markets) | High (US-based nuclear tech, sensitive industry) |
The most impactful and probable risks are Nano Nuclear Energy’s exceptionally high market volatility (beta 7.49) and regulatory hurdles due to its nuclear technology focus. ATS shows moderate market risk but faces operational challenges and financial distress signals, including a low Altman Z-score indicating bankruptcy risk. Caution and close monitoring of regulatory developments and financial health are essential when considering these stocks.
Which Stock to Choose?
ATS Corporation has shown a mixed income evolution with a 16.47% revenue decline in the last year, unfavorable net margin at -1.11%, and a very unfavorable profitability profile. Its debt level is moderate with a neutral debt-to-equity ratio, but the overall rating is very favorable despite some weak return scores.
Nano Nuclear Energy Inc displays stagnant revenue growth and persistent unfavorable profitability with negative ROE and ROIC. It maintains a very favorable rating due to low debt, but its financial ratios are largely unfavorable, reflecting value destruction despite a recent improvement in ROIC trend.
Investors prioritizing stability and moderate debt levels might find ATS’s fundamentals slightly more favorable, though it shows declining profitability. Conversely, those willing to accept higher risk for potential turnaround opportunities may view NNE’s improving ROIC trend as a positive sign despite ongoing value destruction.
Disclaimer: Investment carries a risk of loss of initial capital. The past performance is not a reliable indicator of future results. Be sure to understand risks before making an investment decision.
Go Further
I encourage you to read the complete analyses of ATS Corporation and Nano Nuclear Energy Inc to enhance your investment decisions: