In the competitive world of industrial machinery, Kadant Inc. and ATS Corporation stand out as leaders driving innovation and efficiency. Both companies specialize in advanced industrial solutions, yet Kadant focuses on engineered systems for material handling and processing, while ATS excels in automation and digital manufacturing technologies. This comparison will help investors identify which company offers the best growth potential and aligns with their portfolio strategy. Let’s explore which stock deserves a place in your wallet.
Table of contents
Companies Overview
I will begin the comparison between Kadant Inc. and ATS Corporation by providing an overview of these two companies and their main differences.
Kadant Inc. Overview
Kadant Inc. operates globally in the industrial machinery sector, focusing on supplying technologies and engineered systems. Its business spans three segments: Flow Control, Industrial Processing, and Material Handling, offering products such as fluid-handling systems, pulp processing equipment, and conveying machinery. Headquartered in Westford, Massachusetts, Kadant serves packaging, tissue, wood products, and alternative fuel industries with a workforce of 3,500 employees.
ATS Corporation Overview
ATS Corporation provides automation solutions worldwide, specializing in designing, building, and servicing automated manufacturing and assembly systems. Its offerings include pre- and post-automation services, contract manufacturing, and software solutions for real-time factory management. Based in Cambridge, Canada, ATS serves diverse markets including life sciences, transportation, consumer products, and energy, employing approximately 7,500 people.
Key similarities and differences
Both Kadant and ATS operate in the industrial machinery sector and serve global markets, but Kadant focuses on engineered systems for material handling and processing, while ATS centers on automation and factory system integration. ATS has a larger workforce and broader market reach across various industries, including life sciences and energy. Kadant’s expertise lies more in fluid handling and pulp-related equipment, highlighting a difference in product specialization despite overlapping industrial applications.
Income Statement Comparison
The table below compares key income statement metrics for Kadant Inc. and ATS Corporation for their most recent fiscal years, providing a snapshot of their financial performance.
| Metric | Kadant Inc. (KAI) | ATS Corporation (ATS) |
|---|---|---|
| Market Cap | 3.76B USD | 2.82B CAD |
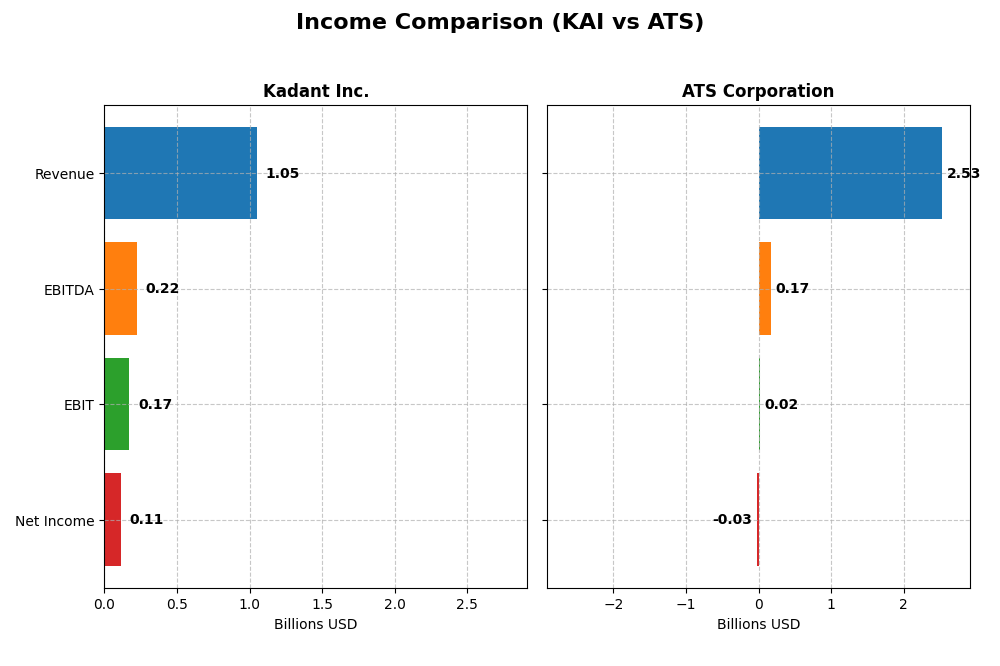
| Revenue | 1.05B USD | 2.53B CAD |
| EBITDA | 223M USD | 168M CAD |
| EBIT | 173M USD | 15.3M CAD |
| Net Income | 112M USD | -28.0M CAD |
| EPS | 9.51 USD | -0.29 CAD |
| Fiscal Year | 2024 | 2025 |
Income Statement Interpretations
Kadant Inc.
Kadant Inc. displayed a steady increase in revenue from $635M in 2020 to $1.05B in 2024, with net income nearly doubling from $55M to $112M over the same period. Gross and EBIT margins remained favorable, around 44% and 16% respectively. In 2024, revenue growth slowed to 10%, EBIT margin was stable, but net margin and EPS declined slightly, signaling cautious optimism.
ATS Corporation
ATS Corporation’s revenue rose from CAD 1.43B in 2021 to a peak of CAD 3.03B in 2024 before falling 16.5% to CAD 2.53B in 2025. Net income showed volatility, culminating in a loss of CAD 28M in 2025. Margins weakened significantly, with net margin turning negative and EBIT margin dropping to 0.6%. The recent year marked steep declines in profitability and margins, reflecting operational challenges.
Which one has the stronger fundamentals?
Kadant Inc. demonstrates stronger fundamentals with consistent revenue and net income growth, favorable margins, and relatively stable profitability ratios. ATS Corporation, despite revenue growth over the long term, faces deteriorating profitability, negative net margins, and a recent net loss, indicating weaker earnings quality and financial health. The income statement evaluations clearly favor Kadant’s financial stability and performance.
Financial Ratios Comparison
The table below presents a side-by-side comparison of the most recent financial ratios for Kadant Inc. and ATS Corporation, based on their respective latest fiscal year data.
| Ratios | Kadant Inc. (KAI) FY 2024 (USD) | ATS Corporation (ATS) FY 2025 (CAD) |
|---|---|---|
| ROE | 13.17% | -1.64% |
| ROIC | 10.08% | 0.09% |
| P/E | 36.9 | -125.28 |
| P/B | 4.86 | 2.06 |
| Current Ratio | 2.31 | 1.69 |
| Quick Ratio | 1.55 | 1.41 |
| D/E (Debt-to-Equity) | 0.38 | 1.00 |
| Debt-to-Assets | 22.57% | 36.79% |
| Interest Coverage | 8.55 | 0.09 |
| Asset Turnover | 0.74 | 0.55 |
| Fixed Asset Turnover | 6.18 | 5.66 |
| Payout ratio | 13.15% | 0% |
| Dividend yield | 0.36% | 0% |
Interpretation of the Ratios
Kadant Inc.
Kadant’s financial ratios are mostly favorable, including a strong current ratio of 2.31, low debt-to-equity of 0.38, and robust interest coverage at 8.64. However, valuation ratios like PE at 36.9 and PB at 4.86 appear elevated, posing potential concerns. The company pays a modest dividend with a 0.36% yield, indicating cautious shareholder returns.
ATS Corporation
ATS shows weak profitability metrics, with negative net margin (-1.11%) and return on equity (-1.64%), alongside unfavorable interest coverage at 0.16. The balance sheet is less strong, though liquidity ratios remain adequate. ATS pays no dividends, likely reflecting reinvestment priorities or recent profitability challenges, as suggested by negative earnings yield and free cash flow.
Which one has the best ratios?
Kadant exhibits a stronger overall financial profile with a majority of favorable ratios, solid liquidity, and manageable leverage, despite some valuation concerns. ATS displays several unfavorable profitability and coverage ratios, reflecting operational stress and no dividend payout. Therefore, Kadant presents a more favorable ratio set compared to ATS.
Strategic Positioning
This section compares the strategic positioning of Kadant Inc. and ATS Corporation, covering Market position, Key segments, and Exposure to technological disruption:
Kadant Inc.
- Mid-sized industrial machinery firm facing competitive pressure in fluid-handling and processing systems.
- Operates in Flow Control, Industrial Processing, and Material Handling segments with diverse product range.
- Exposure to technological disruption through automation and engineered system innovations in fluid and material handling.
ATS Corporation
- Mid-sized industrial machinery company under competitive pressure in automation and manufacturing systems.
- Focuses on automation solutions including design, commissioning, and servicing across multiple industries.
- Subject to disruption from digital and software-enabled automation solutions impacting manufacturing efficiency.
Kadant Inc. vs ATS Corporation Positioning
Kadant maintains a diversified product portfolio across several industrial segments, while ATS concentrates on automation solutions and services. Kadant’s varied segments provide multiple revenue streams; ATS’s focus may yield deeper expertise but higher dependency on automation trends.
Which has the best competitive advantage?
Kadant shows a slightly favorable moat with growing profitability, indicating improving competitive positioning. ATS faces a very unfavorable moat with declining returns, suggesting challenges in sustaining value creation and competitive advantage.
Stock Comparison
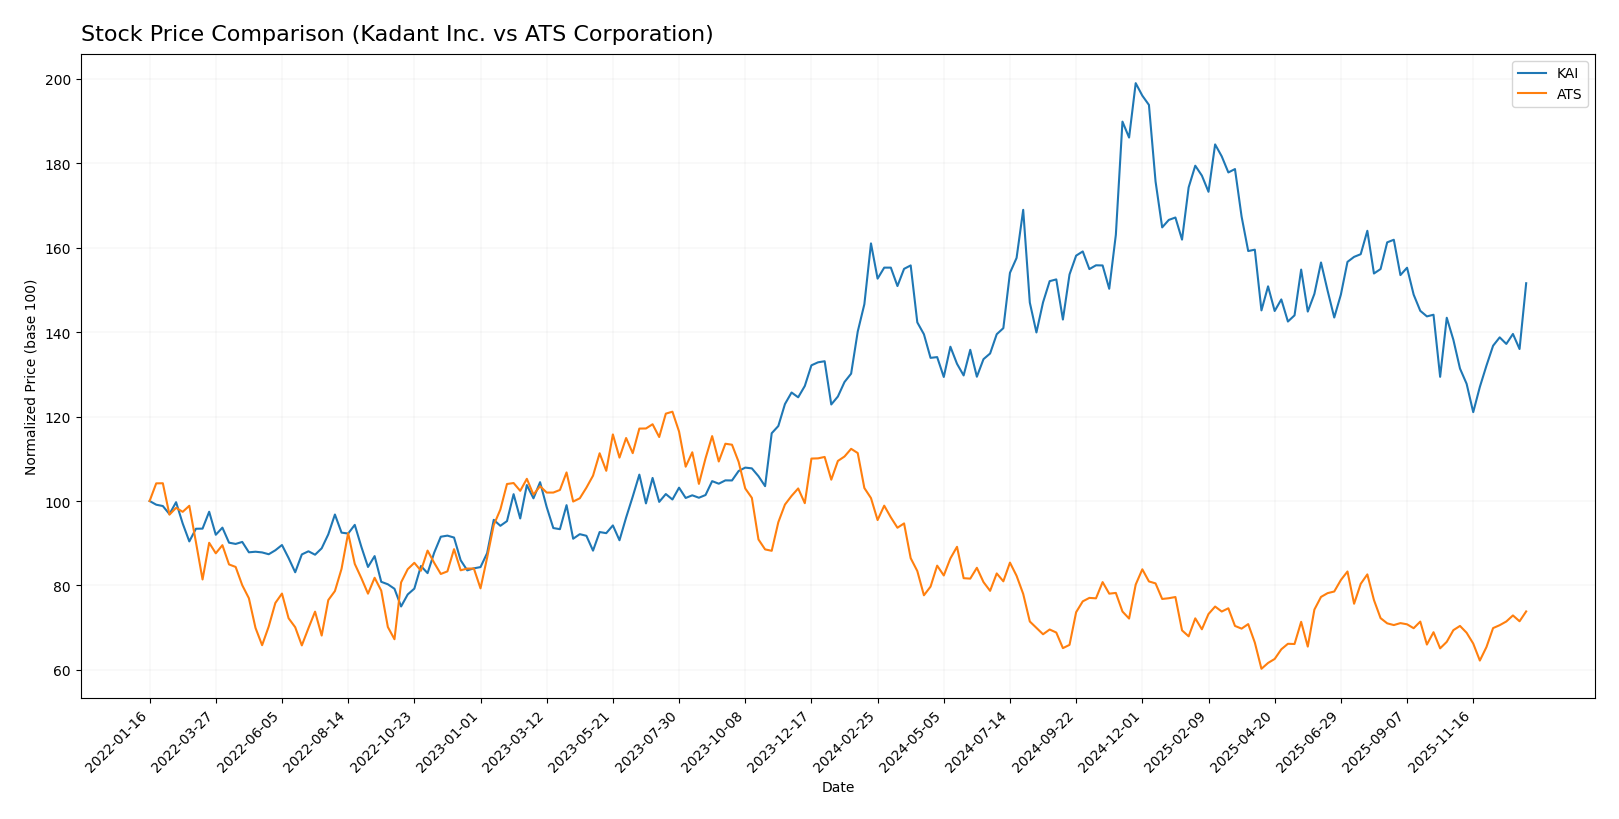
The stock price movements of Kadant Inc. (KAI) and ATS Corporation (ATS) over the past year reveal distinct bearish trends with recent signs of recovery, highlighting differing volatility and trading dynamics.
Trend Analysis
Kadant Inc. (KAI) exhibited a bearish trend over the past 12 months with a -5.86% price change and accelerating decline. The stock showed high volatility with a standard deviation of 34.44, hitting a low of 254.91 and a high of 419.01. Recent weeks indicate a bullish reversal with a +9.69% gain.
ATS Corporation (ATS) recorded a stronger bearish trend, declining -26.66% over 12 months with accelerating losses. Volatility was low at 3.24 standard deviation, with price extremes between 23.5 and 39.27. Recent months showed moderate recovery with a +6.39% increase.
Comparing both, KAI’s stock has delivered the highest market performance recently, with a larger rebound than ATS despite both showing overall bearish trends during the year.
Target Prices
The current analyst consensus presents a balanced outlook with clear target price ranges for both Kadant Inc. and ATS Corporation.
| Company | Target High | Target Low | Consensus |
|---|---|---|---|
| Kadant Inc. | 410 | 275 | 342.5 |
| ATS Corporation | 34 | 34 | 34 |
Analysts expect Kadant Inc.’s stock to appreciate moderately, with a consensus target about 7% above its current price of $319.22. ATS Corporation’s target price aligns closely with its current $28.80 market price, indicating a stable outlook.
Analyst Opinions Comparison
This section compares analysts’ ratings and grades for Kadant Inc. and ATS Corporation:
Rating Comparison
Kadant Inc. Rating
- Rating: B, evaluated as Very Favorable
- Discounted Cash Flow Score: 3 (Moderate)
- ROE Score: 3 (Moderate)
- ROA Score: 4 (Favorable)
- Debt To Equity Score: 3 (Moderate)
- Overall Score: 3 (Moderate)
ATS Corporation Rating
- Rating: C, evaluated as Very Favorable
- Discounted Cash Flow Score: 3 (Moderate)
- ROE Score: 1 (Very Unfavorable)
- ROA Score: 1 (Very Unfavorable)
- Debt To Equity Score: 1 (Very Unfavorable)
- Overall Score: 2 (Moderate)
Which one is the best rated?
Kadant Inc. holds a stronger overall profile with a higher rating (B vs. C) and better scores in ROE, ROA, and debt-to-equity, indicating a more favorable financial standing compared to ATS Corporation.
Scores Comparison
Here is a comparison of the financial health scores for Kadant Inc. and ATS Corporation:
Kadant Inc. Scores
- Altman Z-Score: 5.59, indicating a safe zone status
- Piotroski Score: 7, considered strong financial health
ATS Corporation Scores
- Altman Z-Score: 1.68, indicating a distress zone status
- Piotroski Score: 3, considered very weak financial health
Which company has the best scores?
Kadant Inc. shows significantly stronger financial health with a safe zone Altman Z-Score and a strong Piotroski Score. ATS Corporation’s scores indicate financial distress and very weak strength, based solely on the provided data.
Grades Comparison
Here is the detailed comparison of recent grades from recognized grading companies for Kadant Inc. and ATS Corporation:
Kadant Inc. Grades
This table summarizes Kadant Inc.’s grades from notable grading companies over the past year:
| Grading Company | Action | New Grade | Date |
|---|---|---|---|
| Barrington Research | Maintain | Outperform | 2025-10-30 |
| Barrington Research | Maintain | Outperform | 2025-10-29 |
| Barrington Research | Maintain | Outperform | 2025-10-27 |
| Barrington Research | Maintain | Outperform | 2025-10-10 |
| Barrington Research | Maintain | Outperform | 2025-09-23 |
| DA Davidson | Maintain | Neutral | 2025-08-04 |
| Barrington Research | Maintain | Outperform | 2025-07-30 |
| Barrington Research | Maintain | Outperform | 2025-07-29 |
| Barrington Research | Maintain | Outperform | 2025-05-01 |
| DA Davidson | Maintain | Neutral | 2025-05-01 |
Kadant Inc.’s grades show a consistent Outperform rating from Barrington Research, complemented by Neutral ratings from DA Davidson, indicating a generally positive outlook with some caution.
ATS Corporation Grades
This table presents ATS Corporation’s grades provided by established financial institutions:
| Grading Company | Action | New Grade | Date |
|---|---|---|---|
| JP Morgan | Maintain | Neutral | 2024-08-13 |
| Goldman Sachs | Maintain | Sell | 2024-08-13 |
| JP Morgan | Maintain | Neutral | 2024-05-24 |
ATS Corporation has received a mixed consensus with Neutral ratings from JP Morgan and a Sell rating from Goldman Sachs, suggesting a cautious or negative sentiment from major analysts.
Which company has the best grades?
Kadant Inc. has received predominantly positive grades, mostly Outperform, compared to ATS Corporation’s Neutral and Sell ratings. This difference may influence investors toward favoring Kadant for potentially stronger performance signals.
Strengths and Weaknesses
Below is a comparative overview of key strengths and weaknesses for Kadant Inc. (KAI) and ATS Corporation (ATS) based on their recent financial and strategic data.
| Criterion | Kadant Inc. (KAI) | ATS Corporation (ATS) |
|---|---|---|
| Diversification | Moderate diversification with capital and parts & consumables segments growing steadily. | Less diversified, limited product segmentation data available. |
| Profitability | Favorable net margin (10.59%) and ROIC (10.08%), showing profitable operations. | Unfavorable net margin (-1.11%) and ROIC (0.09%), indicating losses. |
| Innovation | Slightly favorable moat status with growing ROIC trend (+31.3%), suggesting improving competitive positioning. | Very unfavorable moat status with sharply declining ROIC (-98.9%), indicating weakening innovation impact. |
| Global presence | Established global footprint reflected in consistent revenue growth across segments. | No specific data, possibly limited international scale. |
| Market Share | Stable with growing asset turnover and fixed asset turnover ratios. | Weak market share implied by poor profitability and declining margins. |
Kadant Inc. demonstrates stronger financial health and improving profitability, supported by its diversified product base and growing competitive moat. In contrast, ATS Corporation faces significant challenges with declining returns and profitability, suggesting a riskier investment profile.
Risk Analysis
Below is a comparative risk table for Kadant Inc. (KAI) and ATS Corporation (ATS) based on the most recent financial year data:
| Metric | Kadant Inc. (KAI) | ATS Corporation (ATS) |
|---|---|---|
| Market Risk | Moderate (Beta 1.245) | Moderate (Beta 1.268) |
| Debt level | Low (D/E 0.38, favorable) | Moderate to high (D/E 1.0) |
| Regulatory Risk | Moderate (US industrial sector) | Moderate (Canadian industrial sector) |
| Operational Risk | Moderate (diverse segments) | Elevated (automation complexity) |
| Environmental Risk | Moderate (industrial machinery) | Moderate (automation & manufacturing) |
| Geopolitical Risk | Low (US based) | Moderate (Canada HQ, global exposure) |
Kadant shows lower debt and stronger financial stability, reducing bankruptcy risk (Altman Z-score 5.6, safe zone). ATS faces significant financial stress (Altman Z-score 1.68, distress zone), with weak profitability and coverage ratios. ATS’s operational and financial risks are more impactful and likely to affect shareholder value.
Which Stock to Choose?
Kadant Inc. (KAI) shows a favorable income evolution with 10.59% net margin and 9.99% revenue growth in 2024. Its financial ratios are mostly favorable, including a strong current ratio of 2.31 and low debt levels. Profitability is solid with a 13.17% ROE and a slightly favorable economic moat. The company holds a very favorable B rating, supported by a safe zone Altman Z-Score and a strong Piotroski score.
ATS Corporation (ATS) presents an unfavorable income trend, with a -1.11% net margin and negative revenue growth of -16.47% in 2025. Its financial ratios are slightly unfavorable, burdened by high net debt to EBITDA of 8.78 and poor interest coverage. Profitability is weak with negative ROE and declining ROIC, reflecting a very unfavorable moat status. The overall rating is very favorable C, but with weak Altman Z-Score in the distress zone and a very weak Piotroski score.
Investors focused on stability and quality might find Kadant’s favorable income growth, solid ratios, and improving profitability more appealing. Conversely, those with a higher risk tolerance or seeking turnaround opportunities could interpret ATS’s lower valuation and recent price recovery as potential for speculative growth, despite its financial challenges.
Disclaimer: Investment carries a risk of loss of initial capital. The past performance is not a reliable indicator of future results. Be sure to understand risks before making an investment decision.
Go Further
I encourage you to read the complete analyses of Kadant Inc. and ATS Corporation to enhance your investment decisions: