In the dynamic industrial machinery sector, JBT Marel Corporation (JBTM) and ATS Corporation (ATS) stand out as key players driving innovation and automation. Both companies compete globally, offering advanced technology solutions that enhance manufacturing efficiency across diverse industries such as food processing and life sciences. This article will explore their market positions and innovation strategies to help you decide which company presents the most compelling investment opportunity today.
Table of contents
Companies Overview
I will begin the comparison between JBT Marel Corporation and ATS Corporation by providing an overview of these two companies and their main differences.
JBT Marel Corporation Overview
JBT Marel Corporation specializes in providing technology solutions primarily for the food and beverage industry across multiple global regions. The company offers extensive value-added processing and automated material handling solutions, serving diverse sectors such as baby food, poultry, pharmaceuticals, and manufacturing. Headquartered in Chicago, JBT Marel operates with a workforce of 11,700 employees and has a market capitalization of approximately 8.1B USD.
ATS Corporation Overview
ATS Corporation delivers automation solutions worldwide, focusing on designing, building, and servicing automated manufacturing and assembly systems. The company provides comprehensive services including pre- and post-automation support, contract manufacturing, and software solutions for factory floor management. Based in Cambridge, Canada, ATS employs about 7,500 people and has a market cap of roughly 2.8B USD, serving industries like life sciences, transportation, and energy.
Key similarities and differences
Both JBT Marel and ATS operate within the industrial machinery sector, providing automation and technology solutions to diverse industries globally. While JBT Marel emphasizes food and beverage processing technologies and automated material handling, ATS focuses on complete automation systems, including software and digital solutions for manufacturing efficiency. Their business models converge in delivering integrated automation but differ in sector specialization and geographic operational scope.
Income Statement Comparison
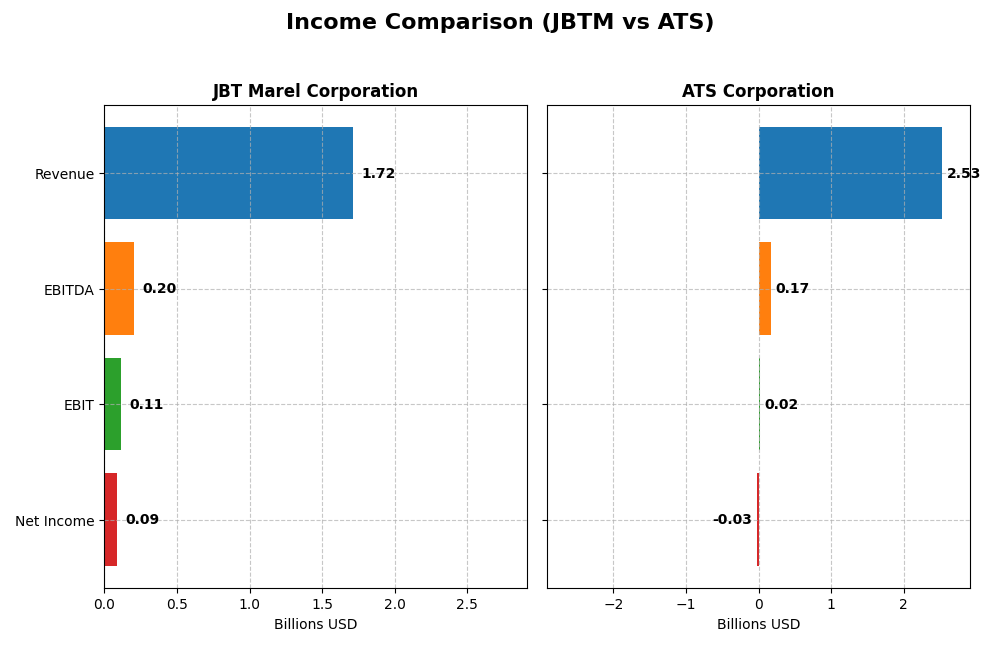
The table below compares key income statement metrics for JBT Marel Corporation and ATS Corporation based on their most recent fiscal year data.
| Metric | JBT Marel Corporation | ATS Corporation |
|---|---|---|
| Market Cap | 8.1B USD | 2.8B CAD |
| Revenue | 1.72B USD | 2.53B CAD |
| EBITDA | 204M USD | 168M CAD |
| EBIT | 115M USD | 15.3M CAD |
| Net Income | 85.4M USD | -28.0M CAD |
| EPS | 2.67 USD | -0.29 CAD |
| Fiscal Year | 2024 | 2025 |
Income Statement Interpretations
JBT Marel Corporation
JBT Marel’s revenue showed a slight decline over 2020-2024, with a 3.1% growth in the last year, while net income decreased by 21.5% overall. Gross margin remained favorable at 36.5%, but EBIT and net margins hovered neutrally. In 2024, despite a modest revenue increase, EBIT fell by 35.3% and net margin declined sharply, highlighting margin pressures and profitability challenges.
ATS Corporation
ATS saw strong revenue growth of 77.2% from 2021 to 2025 but experienced a steep net income decline of 143.8% over the same period. The gross margin was favorable at 25.5%, yet EBIT margin stayed neutral at 0.6%, with a negative net margin. In 2025, revenue dropped 16.5%, accompanied by a drastic EBIT fall of 95.2% and worsening net margin, signaling operational and profitability setbacks.
Which one has the stronger fundamentals?
Both companies face unfavorable overall income statement trends, including declining net income and net margin deterioration. JBT Marel maintains a higher gross margin and slightly better margin stability, whereas ATS shows more volatile profitability with a larger net loss in the latest year despite higher revenue growth. Neither company demonstrates clearly stronger fundamentals based on recent income statement performances.
Financial Ratios Comparison
The table below presents the most recent key financial ratios for JBT Marel Corporation and ATS Corporation, facilitating a straightforward comparison of their financial performance and stability as of their latest fiscal years.
| Ratios | JBT Marel Corporation (2024) | ATS Corporation (2025) |
|---|---|---|
| ROE | 5.53% | -1.64% |
| ROIC | 3.65% | 0.09% |
| P/E | 47.63 | -125.28 |
| P/B | 2.63 | 2.06 |
| Current Ratio | 3.48 | 1.69 |
| Quick Ratio | 3.04 | 1.41 |
| D/E (Debt-to-Equity) | 0.81 | 1.00 |
| Debt-to-Assets | 36.68% | 36.79% |
| Interest Coverage | 6.10 | 0.09 |
| Asset Turnover | 0.50 | 0.55 |
| Fixed Asset Turnover | 7.34 | 5.66 |
| Payout Ratio | 15.34% | 0% |
| Dividend Yield | 0.32% | 0% |
Interpretation of the Ratios
JBT Marel Corporation
JBT Marel’s ratios show mixed strength, with a slightly unfavorable overall assessment. Key weaknesses include a low net margin of 4.98% and a modest return on equity at 5.53%, both flagged as unfavorable. However, the company benefits from a favorable quick ratio of 3.04 and strong interest coverage at 5.92. The dividend yield is low at 0.32%, indicating modest shareholder returns supported by a cautious payout.
ATS Corporation
ATS Corporation exhibits several unfavorable ratios, such as a negative net margin of -1.11% and return on equity at -1.64%, reflecting operational challenges. Despite this, the company maintains a favorable current ratio of 1.69 and quick ratio of 1.41, indicating liquidity strength. ATS does not pay dividends, likely due to negative earnings and a reinvestment strategy, with no dividend yield and limited shareholder cash returns.
Which one has the best ratios?
Both JBT Marel and ATS Corporation face notable financial challenges, reflected in their slightly unfavorable global ratio opinions. JBT Marel has stronger profitability and coverage ratios, while ATS shows liquidity advantages but suffers from negative profitability and interest coverage. Neither company stands out clearly as superior, as strengths and weaknesses balance out in their financial profiles.
Strategic Positioning
This section compares the strategic positioning of JBT Marel Corporation and ATS Corporation, including market position, key segments, and exposure to technological disruption:
JBT Marel Corporation
- Operates globally with competitive pressure in industrial machinery sector.
- Serves diverse food, beverage, health, pharmaceutical, manufacturing, and packaging industries.
- Exposure to technological disruption through automation and advanced processing systems.
ATS Corporation
- Provides automation solutions worldwide facing competitive industrial machinery market.
- Focuses on life sciences, transportation, consumer products, food, electronics, and energy markets.
- Leverages connected factory floor management and digital solutions in automation.
JBT Marel Corporation vs ATS Corporation Positioning
JBT Marel has a highly diversified portfolio across many industries, while ATS concentrates on automation with digital solutions in fewer sectors. JBT’s broader segmentation may offer resilience, whereas ATS’s focus on automation technology drives specialized innovation but may increase sector risk.
Which has the best competitive advantage?
Both companies exhibit very unfavorable MOATs with declining ROIC trends, indicating value destruction and weak competitive advantages. Neither currently demonstrates efficient capital use or sustainable economic moats based on the available data.
Stock Comparison
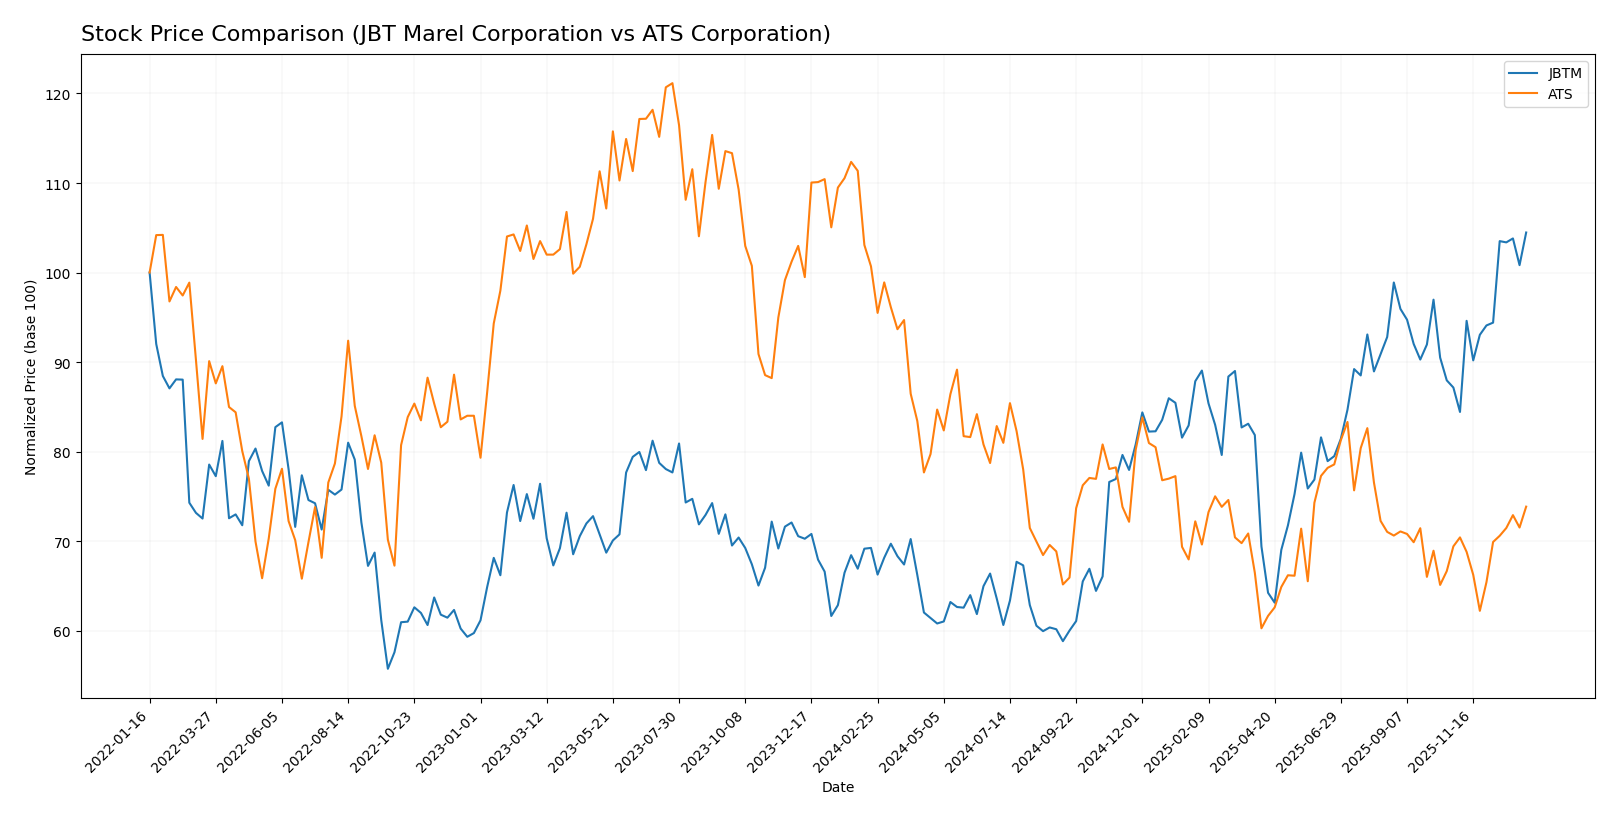
The past year revealed contrasting trajectories: JBT Marel Corporation’s stock surged with strong upward momentum and notable acceleration, while ATS Corporation experienced a marked decline despite recent modest gains.
Trend Analysis
JBT Marel Corporation exhibited a bullish trend over the past 12 months with a 50.89% price increase, showing acceleration and a high volatility level (std deviation 19.24). The stock peaked at 156.04 and bottomed at 87.85 during this period.
ATS Corporation showed a bearish trend over the same 12 months, with a 26.66% price drop despite accelerating decline and lower volatility (std deviation 3.24). Its highest price reached 39.27 and lowest fell to 23.5.
Comparing both, JBT Marel delivered the highest market performance, outperforming ATS by a wide margin in price appreciation over the last year.
Target Prices
The current analyst consensus indicates moderate upside potential for both JBT Marel Corporation and ATS Corporation.
| Company | Target High | Target Low | Consensus |
|---|---|---|---|
| JBT Marel Corporation | 180 | 169 | 174.5 |
| ATS Corporation | 34 | 34 | 34 |
JBT Marel’s consensus target of 174.5 suggests a roughly 12% upside from its current price of 156.04 USD. ATS shows a target of 34 USD, indicating about 18% potential increase from its current 28.8 USD price.
Analyst Opinions Comparison
This section compares analysts’ ratings and grades for JBT Marel Corporation and ATS Corporation:
Rating Comparison
JBTM Rating
- Rating: C, considered very favorable overall.
- Discounted Cash Flow Score: 3, indicating a moderate valuation based on future cash flows.
- ROE Score: 1, which is very unfavorable, showing low efficiency in generating profit from equity.
- ROA Score: 1, very unfavorable, reflecting poor asset utilization to generate earnings.
- Debt To Equity Score: 2, moderate financial risk with balanced debt compared to equity.
- Overall Score: 2, moderate financial standing as a summary assessment.
ATS Rating
- Rating: C, also considered very favorable overall.
- Discounted Cash Flow Score: 3, indicating a similar moderate valuation.
- ROE Score: 1, also very unfavorable, indicating low profit efficiency from equity.
- ROA Score: 1, equally very unfavorable, indicating poor asset utilization.
- Debt To Equity Score: 1, very unfavorable, suggesting higher financial risk due to debt levels.
- Overall Score: 2, moderate financial standing overall, same as JBTM.
Which one is the best rated?
Both JBT Marel Corporation and ATS Corporation share the same overall rating and scores for discounted cash flow, ROE, and ROA, reflecting similar financial health. However, JBTM has a better debt-to-equity score, indicating relatively lower financial risk compared to ATS.
Scores Comparison
The following table compares the Altman Z-Score and Piotroski Score of JBT Marel Corporation and ATS Corporation:
JBTM Scores
- Altman Z-Score of 1.75 indicates financial distress.
- Piotroski Score of 2 reflects very weak financial health.
ATS Scores
- Altman Z-Score of 1.68 indicates financial distress.
- Piotroski Score of 3 reflects very weak financial health.
Which company has the best scores?
Both JBTM and ATS are in the distress zone by Altman Z-Score, with JBTM slightly higher. ATS has a marginally better Piotroski Score, but both remain very weak. Overall, ATS shows a modestly stronger score profile strictly based on the provided data.
Grades Comparison
Here is a comparison of the latest reliable grades for JBT Marel Corporation and ATS Corporation:
JBT Marel Corporation Grades
The table below shows recent upgrades from reputable grading companies for JBT Marel Corporation.
| Grading Company | Action | New Grade | Date |
|---|---|---|---|
| Jefferies | Upgrade | Buy | 2025-12-10 |
| William Blair | Upgrade | Outperform | 2025-08-06 |
JBT Marel Corporation’s grades show a clear upward trend with strong buy and outperform ratings from respected firms.
ATS Corporation Grades
The following table presents the latest grades maintained by well-known analysts for ATS Corporation.
| Grading Company | Action | New Grade | Date |
|---|---|---|---|
| JP Morgan | Maintain | Neutral | 2024-08-13 |
| Goldman Sachs | Maintain | Sell | 2024-08-13 |
| JP Morgan | Maintain | Neutral | 2024-05-24 |
ATS Corporation’s grades have remained neutral to negative, indicating a lack of positive momentum from major grading firms.
Which company has the best grades?
JBT Marel Corporation has received notably better grades than ATS Corporation, with upgrades to buy and outperform. This positive grading trend may attract investors seeking growth potential, whereas ATS’s neutral to sell ratings suggest more caution is warranted.
Strengths and Weaknesses
Below is a comparison table highlighting the key strengths and weaknesses of JBT Marel Corporation (JBTM) and ATS Corporation (ATS) based on recent financial and strategic data.
| Criterion | JBT Marel Corporation (JBTM) | ATS Corporation (ATS) |
|---|---|---|
| Diversification | Moderate, focused on food processing technology | Moderate, with industrial automation focus |
| Profitability | Low net margin (4.98%), ROIC below WACC, value destroying | Negative net margin (-1.11%), near zero ROIC, value destroying |
| Innovation | Moderate fixed asset turnover (7.34) indicates operational efficiency | Lower fixed asset turnover (5.66), innovation pace slower |
| Global presence | Strong global footprint in food tech | Global industrial presence but less diversified |
| Market Share | Stable but challenged by declining returns | Smaller share with profitability pressures |
Both companies face significant challenges with profitability and return on invested capital, indicating value destruction. JBTM shows operational efficiency strengths, while ATS struggles more with profitability and interest coverage. Caution is advised for investors considering these stocks due to declining ROIC trends and unfavorable financial ratios.
Risk Analysis
Below is a comparative risk overview for JBT Marel Corporation (JBTM) and ATS Corporation (ATS) based on the most recent data from 2025-2026.
| Metric | JBT Marel Corporation (JBTM) | ATS Corporation (ATS) |
|---|---|---|
| Market Risk | Beta 1.00, moderate volatility | Beta 1.27, higher volatility |
| Debt level | Debt/Equity 0.81, neutral | Debt/Equity 1.0, neutral but higher leverage |
| Regulatory Risk | Moderate, operates in multiple regions with food & industrial regulations | Moderate, global automation with sector-specific compliance |
| Operational Risk | Complex food processing tech, risk of supply chain disruption | Complex automation projects, risk in project execution delays |
| Environmental Risk | Exposure due to food industry focus, moderate | Moderate, automation sector with growing sustainability demands |
| Geopolitical Risk | US-based with global footprint, moderate exposure | Canada-based, global operations, moderate exposure |
Both companies face significant operational complexities and moderate debt levels. ATS shows higher market volatility and weaker interest coverage (0.16), indicating greater financial stress risks. JBTM’s Altman Z-Score (~1.75) and ATS’s (~1.68) place them both in the distress zone, signaling elevated bankruptcy risk potential. ATS’s negative margins and weak profitability metrics exacerbate concerns. Investors should weigh these financial vulnerabilities against growth prospects and sector dynamics carefully.
Which Stock to Choose?
JBT Marel Corporation shows moderate income growth with a 3.1% revenue increase in 2024 but suffers from declining profitability and unfavorable net margin and ROE ratios. Its debt level is moderate with a net debt to EBITDA of 0.12, and the company holds a very favorable overall rating despite a very unfavorable MOAT evaluation due to value destruction.
ATS Corporation experienced a 16.5% revenue decline in 2025 and demonstrates negative profitability metrics, including negative net margin and ROE. Its financial ratios show mixed signals with moderate debt but very unfavorable interest coverage. ATS also holds a very favorable overall rating but faces a very unfavorable MOAT due to declining returns and value destruction.
For investors prioritizing growth and moderate stability, JBTM might appear more favorable given its recent revenue growth and stronger financial structure. Conversely, ATS may attract those with tolerance for volatility, considering its overall rating and recent price recovery despite weaker profitability and financial health. Both companies exhibit significant risks tied to declining profitability and value destruction.
Disclaimer: Investment carries a risk of loss of initial capital. The past performance is not a reliable indicator of future results. Be sure to understand risks before making an investment decision.
Go Further
I encourage you to read the complete analyses of JBT Marel Corporation and ATS Corporation to enhance your investment decisions: