Ingersoll Rand Inc. and ATS Corporation are two key players in the industrial machinery sector, each driving innovation in automation and mission-critical technologies. While Ingersoll Rand focuses broadly on air, fluid, and energy solutions, ATS specializes in advanced automation systems and digital manufacturing services. Their overlapping markets and complementary innovation strategies make this comparison essential. Join me as we analyze which company holds the most promise for your investment portfolio.
Table of contents
Companies Overview
I will begin the comparison between Ingersoll Rand Inc. and ATS Corporation by providing an overview of these two companies and their main differences.
Ingersoll Rand Inc. Overview
Ingersoll Rand Inc. operates in the industrial machinery sector, focusing on mission-critical air, fluid, energy, specialty vehicle, and medical technologies. The company serves diverse markets including medical, industrial manufacturing, and energy across multiple regions such as the US, Europe, and Asia Pacific. Headquartered in Davidson, North Carolina, it employs around 21,000 people and has a market cap of approximately 33.8B USD.
ATS Corporation Overview
ATS Corporation specializes in automation solutions, including the design, building, and servicing of automated manufacturing and assembly systems. Its services span pre- and post-automation phases, contract manufacturing, and software-driven factory management systems. Based in Cambridge, Canada, ATS employs about 7,500 people and holds a market cap near 2.8B USD, serving industries like life sciences, electronics, and energy.
Key similarities and differences
Both companies operate in the industrial machinery sector and provide technology-driven solutions to manufacturing and industrial clients. Ingersoll Rand focuses more on air and fluid technologies with broad geographic reach, while ATS emphasizes automation and digital factory systems primarily in North America. Their workforce size and market capitalization also differ significantly, reflecting varied scales and market penetration.
Income Statement Comparison
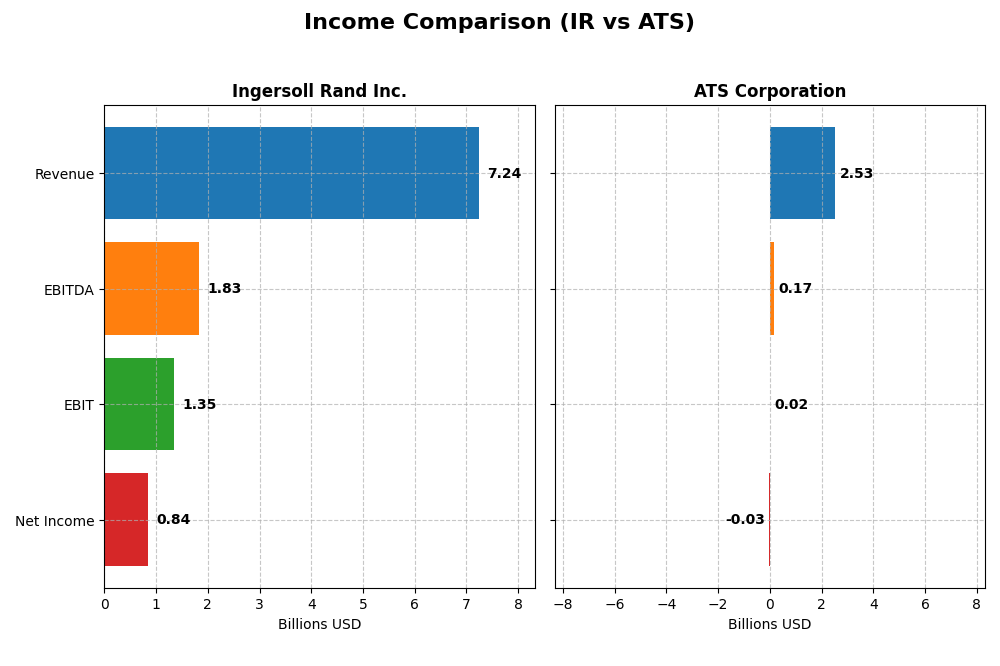
The table below compares the key income statement metrics for Ingersoll Rand Inc. and ATS Corporation for their most recent fiscal years, reflecting their financial performance in 2024 and 2025 respectively.
| Metric | Ingersoll Rand Inc. (2024) | ATS Corporation (2025) |
|---|---|---|
| Market Cap | 33.8B | 2.8B |
| Revenue | 7.24B | 2.53B |
| EBITDA | 1.83B | 168M |
| EBIT | 1.35B | 15.3M |
| Net Income | 839M | -28.0M |
| EPS | 2.08 | -0.29 |
| Fiscal Year | 2024 | 2025 |
Income Statement Interpretations
Ingersoll Rand Inc.
Ingersoll Rand Inc. showed consistent revenue growth from 2020 to 2024, rising from $3.97B to $7.24B, with net income improving markedly from a loss of $33M in 2020 to $839M in 2024. Margins have strengthened, with a gross margin of 43.8% and net margin at 11.6% in 2024. The latest year saw moderate revenue growth of 5.2%, while EBIT and EPS growth were favorable, reflecting improved profitability.
ATS Corporation
ATS Corporation’s revenue grew overall from CAD 1.43B in 2021 to CAD 3.03B in 2024 but declined by 16.5% in the latest year to CAD 2.53B in 2025. Net income has deteriorated, turning negative to CAD -28M in 2025 from a positive CAD 194M in 2024. While the gross margin remained favorable at 25.5%, the net margin was negative at -1.1%, signaling pressure on profitability, especially in the most recent year with significant declines in EBIT and EPS.
Which one has the stronger fundamentals?
Ingersoll Rand displays stronger fundamentals supported by sustained revenue and net income growth, favorable margin improvements, and overall positive income statement evaluations. Conversely, ATS faces challenges with declining recent revenue, negative net income, and unfavorable margin trends. The contrasting trajectories highlight Ingersoll Rand’s more robust income statement performance over the examined periods.
Financial Ratios Comparison
This table presents the latest financial ratios for Ingersoll Rand Inc. and ATS Corporation, offering a side-by-side view of key performance and risk metrics as of their most recent fiscal periods.
| Ratios | Ingersoll Rand Inc. (2024) | ATS Corporation (2025 Q1) |
|---|---|---|
| ROE | 8.24% | -1.64% |
| ROIC | 6.11% | 0.09% |
| P/E | 43.5 | -125.3 |
| P/B | 3.58 | 2.06 |
| Current Ratio | 2.29 | 1.69 |
| Quick Ratio | 1.71 | 1.41 |
| D/E | 0.49 | 1.00 |
| Debt-to-Assets | 27.7% | 36.8% |
| Interest Coverage | 6.10 | 0.09 |
| Asset Turnover | 0.40 | 0.55 |
| Fixed Asset Turnover | 8.59 | 5.66 |
| Payout Ratio | 3.85% | 0% |
| Dividend Yield | 0.09% | 0% |
Interpretation of the Ratios
Ingersoll Rand Inc.
Ingersoll Rand shows a balanced financial profile with 50% of ratios favorable, including a solid current ratio of 2.29 and strong interest coverage at 6.31, indicating good liquidity and debt servicing capacity. However, its return on equity of 8.24% and asset turnover at 0.4 are less impressive, alongside a high PE ratio of 43.51. Dividend yield is low at 0.09%, reflecting modest shareholder returns.
ATS Corporation
ATS Corporation presents challenges with a negative net margin of -1.11% and return on equity at -1.64%, signaling profitability issues. Its liquidity ratios are decent, with a current ratio of 1.69 and quick ratio of 1.41, but interest coverage is weak at 0.16, raising solvency concerns. ATS pays no dividends, likely due to ongoing reinvestment needs or growth focus, and shows a mixed ratio profile.
Which one has the best ratios?
Comparing both, Ingersoll Rand has a slightly favorable ratio profile, stronger liquidity, and better debt management, despite some valuation concerns. ATS exhibits more unfavorable profitability and solvency ratios, with a slightly unfavorable overall rating. Thus, Ingersoll Rand currently demonstrates a more robust set of financial ratios than ATS.
Strategic Positioning
This section compares the strategic positioning of Ingersoll Rand Inc. and ATS Corporation across market position, key segments, and exposure to technological disruption:
Ingersoll Rand Inc.
- Large market cap US industrial machinery company with diversified global presence and moderate competitive pressure.
- Operates two main segments: Industrial Technologies and Services, and Precision and Science Technologies, serving multiple industries.
- Exposure to technological disruption through integrated automation and fluid management technologies in critical applications.
ATS Corporation
- Smaller Canadian industrial machinery firm focused on automation solutions facing competitive pressure in niche markets.
- Provides automation systems and services mainly for manufacturing and assembly across diverse markets.
- Faces disruption risk with continuous innovation in automation, software solutions, and digital factory management.
Ingersoll Rand Inc. vs ATS Corporation Positioning
Ingersoll Rand exhibits a diversified segment approach targeting broad industrial applications, while ATS concentrates on automation and manufacturing systems. IR’s larger scale supports more varied business drivers; ATS’s focus allows specialized offerings but may limit scale advantages.
Which has the best competitive advantage?
Based on MOAT evaluation, Ingersoll Rand has a slightly unfavorable moat with growing profitability, while ATS shows a very unfavorable moat with declining profitability, indicating IR has a comparatively stronger competitive advantage despite value destruction.
Stock Comparison
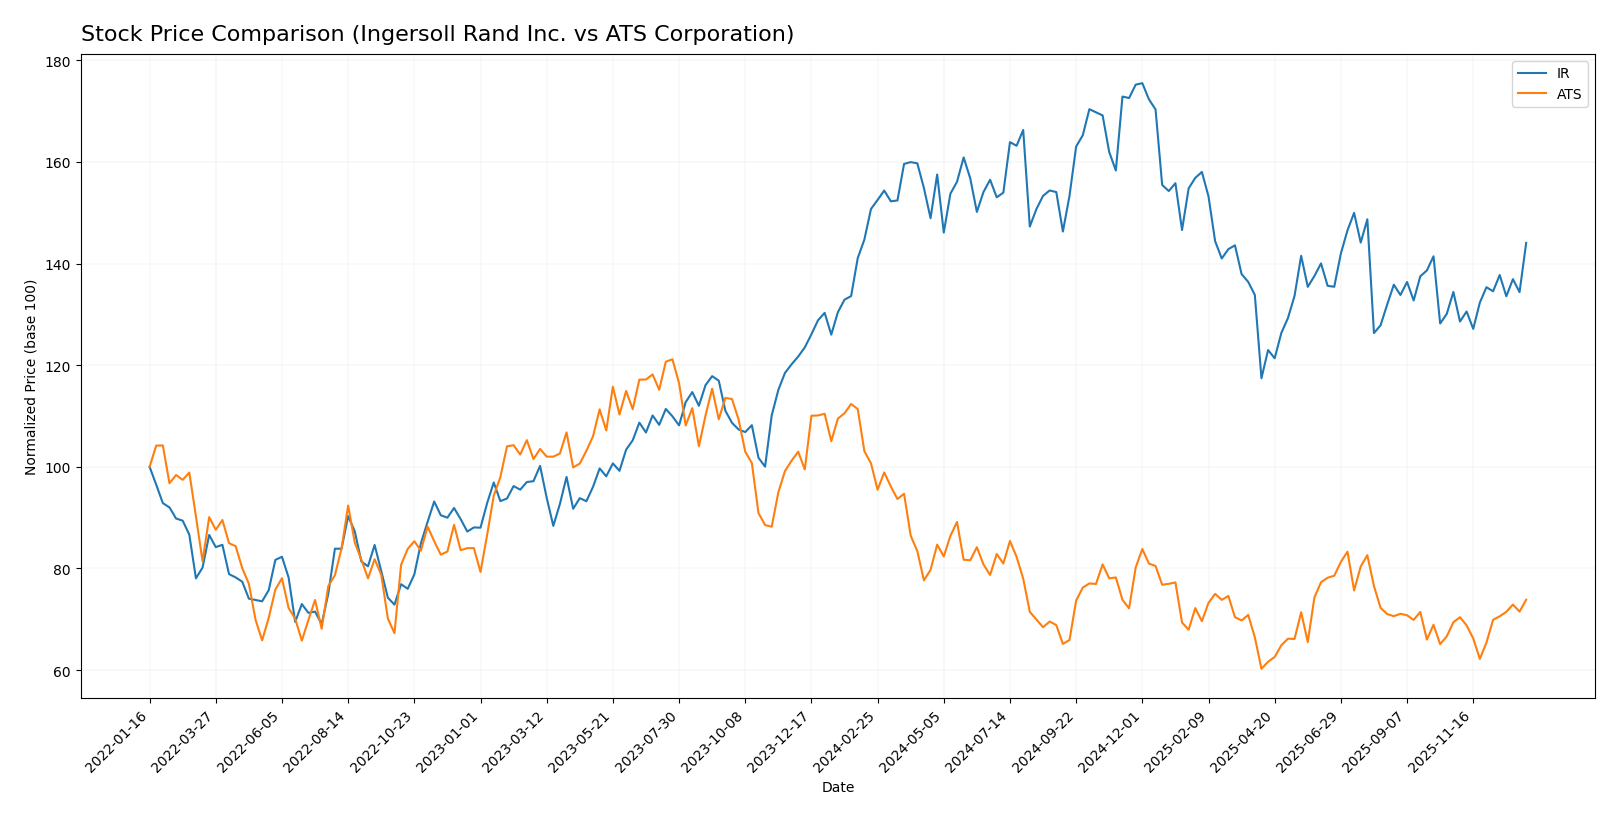
The stock prices of Ingersoll Rand Inc. and ATS Corporation have exhibited notable movements over the past 12 months, with both showing recent upward momentum following extended bearish trends, reflecting dynamic trading activity.
Trend Analysis
Ingersoll Rand Inc. experienced a bearish trend over the past 12 months with a -4.43% price change, accompanied by accelerating decline and high volatility, marked by highs of 104.17 and lows of 69.7. Recent months show a strong recovery with a 7.18% gain and moderate volatility.
ATS Corporation’s stock also followed a bearish trend over the last year, declining by -26.66% with accelerating losses and lower volatility compared to Ingersoll Rand. The recent period indicates a modest rebound of 6.39% with low volatility and a gentle upward slope.
Comparing the two, Ingersoll Rand delivered a less severe decline and a stronger recent recovery than ATS Corporation, resulting in comparatively better market performance across the analyzed period.
Target Prices
Analyst target price consensus suggests moderate upside potential for both Ingersoll Rand Inc. and ATS Corporation.
| Company | Target High | Target Low | Consensus |
|---|---|---|---|
| Ingersoll Rand Inc. | 100 | 81 | 91.5 |
| ATS Corporation | 34 | 34 | 34 |
The consensus target prices for Ingersoll Rand Inc. indicate a potential rise from the current price of 85.51 USD to around 91.5 USD, while ATS Corporation’s target price at 34 USD implies a clear upside from its current 28.8 USD.
Analyst Opinions Comparison
This section compares analysts’ ratings and financial grades for Ingersoll Rand Inc. and ATS Corporation:
Rating Comparison
IR Rating
- Overall rating is C+ with a very favorable status.
- Discounted Cash Flow Score is 3, indicating moderate valuation assessment.
- Return on Equity Score is 2, showing moderate efficiency in profit generation.
- Return on Assets Score is 3, reflecting moderate asset utilization.
- Debt To Equity Score is 2, suggesting moderate financial risk.
- Overall Score is 2, representing a moderate overall financial standing.
ATS Rating
- Overall rating is C with a very favorable status.
- Discounted Cash Flow Score is 3, indicating moderate valuation assessment.
- Return on Equity Score is 1, indicating very unfavorable profit generation.
- Return on Assets Score is 1, reflecting very unfavorable asset utilization.
- Debt To Equity Score is 1, suggesting very unfavorable financial risk.
- Overall Score is 2, representing a moderate overall financial standing.
Which one is the best rated?
Based strictly on provided data, IR holds a slightly better rating (C+) compared to ATS (C). IR scores higher on ROE, ROA, and debt-to-equity metrics, indicating stronger financial health despite equal overall scores.
Scores Comparison
The comparison of the Altman Z-Score and Piotroski Score for Ingersoll Rand Inc. and ATS Corporation is as follows:
Ingersoll Rand Inc. Scores
- Altman Z-Score: 3.27, indicating a safe financial zone
- Piotroski Score: 5, showing average financial strength
ATS Corporation Scores
- Altman Z-Score: 1.68, indicating financial distress zone
- Piotroski Score: 3, indicating very weak financial strength
Which company has the best scores?
Based on the provided data, Ingersoll Rand Inc. has a higher Altman Z-Score, placing it in the safe zone versus ATS in distress. Its Piotroski Score is also higher, indicating stronger financial health compared to ATS.
Grades Comparison
The grades assigned by reputable financial institutions for Ingersoll Rand Inc. and ATS Corporation are summarized below:
Ingersoll Rand Inc. Grades
The following table lists recent grades for Ingersoll Rand Inc. from well-known grading companies:
| Grading Company | Action | New Grade | Date |
|---|---|---|---|
| Wells Fargo | Maintain | Overweight | 2026-01-07 |
| Stifel | Maintain | Hold | 2025-12-16 |
| Citigroup | Maintain | Buy | 2025-12-08 |
| Citigroup | Maintain | Buy | 2025-11-03 |
| Baird | Maintain | Outperform | 2025-11-03 |
| Stifel | Maintain | Hold | 2025-10-20 |
| Wells Fargo | Maintain | Overweight | 2025-10-06 |
| Morgan Stanley | Maintain | Equal Weight | 2025-08-13 |
| Barclays | Maintain | Overweight | 2025-08-04 |
| Stifel | Maintain | Hold | 2025-08-04 |
Overall, Ingersoll Rand’s grades show a consistent pattern of buy-side recommendations with no sell ratings, reflecting confidence among analysts.
ATS Corporation Grades
The latest grades for ATS Corporation from recognized grading companies are as follows:
| Grading Company | Action | New Grade | Date |
|---|---|---|---|
| JP Morgan | Maintain | Neutral | 2024-08-13 |
| Goldman Sachs | Maintain | Sell | 2024-08-13 |
| JP Morgan | Maintain | Neutral | 2024-05-24 |
ATS Corporation’s grades indicate a cautious stance with neutral to sell ratings, suggesting a more reserved outlook from analysts.
Which company has the best grades?
Ingersoll Rand Inc. has received predominantly positive grades, including multiple buy and outperform ratings, while ATS Corporation’s grades are neutral or negative. This disparity may influence investors’ confidence levels and perceived risk profiles when considering these stocks.
Strengths and Weaknesses
Below is a comparison table highlighting key strengths and weaknesses of Ingersoll Rand Inc. (IR) and ATS Corporation (ATS) based on the most recent financial and operational data.
| Criterion | Ingersoll Rand Inc. (IR) | ATS Corporation (ATS) |
|---|---|---|
| Diversification | Well-diversified with strong Industrial Technologies and Precision segments generating over $7.9B revenue in 2024 | Less diversified, limited segment data available; more concentrated operations |
| Profitability | Moderate profitability: net margin 11.59%, ROIC 6.11% (neutral), but ROE 8.24% unfavorable | Negative profitability: net margin -1.11%, ROIC 0.09% unfavorable, ROE -1.64% unfavorable |
| Innovation | Growing ROIC trend (+1067%), indicating improving operational efficiency and potential innovation | Declining ROIC trend (-99%), indicating profitability challenges and weak innovation impact |
| Global presence | Strong global presence evidenced by diversified international operations | More regional focus with less global scale |
| Market Share | Established market player with consistent revenue growth in core segments | Smaller market share with shrinking profitability |
Key takeaways: Ingersoll Rand shows moderate profitability with improving operational efficiency and solid diversification, suggesting cautious optimism for investors. ATS struggles with profitability and declining returns, reflecting higher risk and potential value erosion.
Risk Analysis
Below is a comparison of key risks for Ingersoll Rand Inc. (IR) and ATS Corporation (ATS) based on their latest available data:
| Metric | Ingersoll Rand Inc. (IR) | ATS Corporation (ATS) |
|---|---|---|
| Market Risk | Beta 1.33, moderate volatility, NYSE listed | Beta 1.27, moderate volatility, NYSE listed ADR |
| Debt level | Debt-to-equity 0.49, favorable leverage | Debt-to-equity 1.0, higher leverage, neutral risk |
| Regulatory Risk | US-based, exposure to US and global regulations | Canada-based, exposure to Canadian and US regulations |
| Operational Risk | Diverse industrial segments, 21K employees | Automation focus, 7.5K employees, specialized market |
| Environmental Risk | Industrial machinery sector, moderate exposure | Automation and manufacturing, potential energy use concerns |
| Geopolitical Risk | Global presence including US, Europe, Asia-Pacific | Mainly North America, some global client exposure |
The most impactful and likely risks differ: IR benefits from a stronger balance sheet with favorable debt ratios and a safer Altman Z-Score (3.27), mitigating bankruptcy risk. ATS faces higher financial distress risk with a lower Z-score (1.68) and weak profitability, increasing vulnerability. Market volatility affects both similarly due to moderate beta values. Investors should weigh ATS’s operational and financial weaknesses more cautiously in their portfolios.
Which Stock to Choose?
Ingersoll Rand Inc. (IR) shows a favorable income evolution with strong growth in net income and EPS over 2020-2024. Its financial ratios are slightly favorable, supported by solid profitability, low debt, and a good current ratio. However, the company is shedding value as ROIC remains below WACC, though profitability trends upward. IR holds a moderate overall rating with strengths in financial stability but some valuation concerns.
ATS Corporation (ATS) presents an unfavorable income statement with declining revenue and profitability over 2021-2025. Its financial ratios are slightly unfavorable, reflecting weak returns, high debt levels, and poor interest coverage. The company is destroying value with a declining ROIC below WACC, and financial distress signals appear. ATS has a moderate overall rating but scores poorly on profitability and leverage metrics.
Considering the ratings and overall financial evaluations, IR might appear more suitable for investors seeking moderate stability and improving profitability, while ATS could be interpreted as higher risk with weaker financial health. Investors with a risk-tolerant profile focused on potential turnaround scenarios might find ATS intriguing, whereas risk-averse or quality-focused investors could see IR as a more favorable option.
Disclaimer: Investment carries a risk of loss of initial capital. The past performance is not a reliable indicator of future results. Be sure to understand risks before making an investment decision.
Go Further
I encourage you to read the complete analyses of Ingersoll Rand Inc. and ATS Corporation to enhance your investment decisions: