Choosing the right industrial machinery stock can be a game-changer for your investment portfolio. Illinois Tool Works Inc. (ITW) and ATS Corporation (ATS) are two key players in this sector, both driving innovation in manufacturing and automation solutions. While ITW boasts a diversified product range across multiple segments, ATS specializes in advanced automation technologies. In this article, I will help you determine which company presents the most compelling opportunity for investors.
Table of contents
Companies Overview
I will begin the comparison between Illinois Tool Works and ATS Corporation by providing an overview of these two companies and their main differences.
Illinois Tool Works Overview
Illinois Tool Works Inc. manufactures and sells industrial products and equipment globally, operating through seven segments including Automotive OEM, Food Equipment, and Welding. The company serves diverse markets such as automotive, food equipment, construction, and industrial sectors. Founded in 1912 and based in Glenview, Illinois, ITW has a significant market presence with a market cap of 74.7B USD and employs approximately 44,000 people.
ATS Corporation Overview
ATS Corporation provides automation solutions worldwide, specializing in designing, building, and servicing automated manufacturing and assembly systems. The company also offers services ranging from pre-automation analysis to post-automation maintenance and digital factory floor management. Founded in 1978 and headquartered in Cambridge, Canada, ATS has a market cap of 2.8B USD and employs around 7,500 people, serving industries such as life sciences, transportation, and food and beverage.
Key similarities and differences
Both ITW and ATS operate in the industrial machinery sector with a focus on manufacturing solutions, but ITW has a broader product portfolio across multiple segments while ATS concentrates on automation and digital manufacturing systems. ITW’s market cap and employee base are significantly larger, reflecting a more diversified industrial footprint. ATS emphasizes software and digital solutions to enhance operational efficiency, contrasting with ITW’s extensive range of industrial products and equipment.
Income Statement Comparison
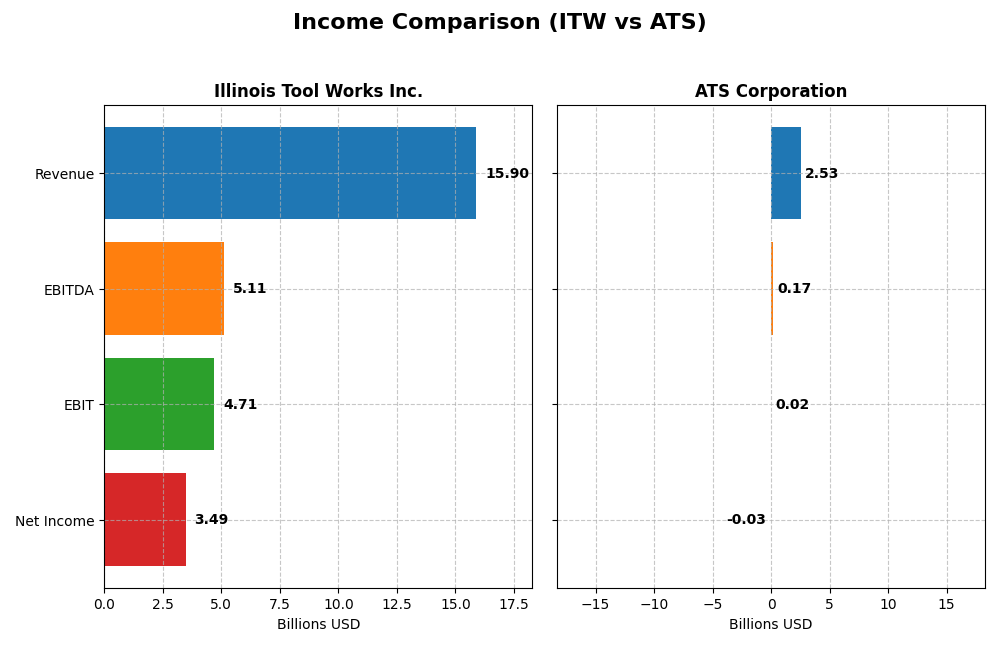
The table below presents a side-by-side comparison of the latest fiscal year income statement figures for Illinois Tool Works Inc. and ATS Corporation, highlighting key financial metrics.
| Metric | Illinois Tool Works Inc. (ITW) | ATS Corporation (ATS) |
|---|---|---|
| Market Cap | 74.7B USD | 2.8B CAD |
| Revenue | 15.9B USD | 2.5B CAD |
| EBITDA | 5.11B USD | 168M CAD |
| EBIT | 4.71B USD | 15.3M CAD |
| Net Income | 3.49B USD | -28.0M CAD |
| EPS | 11.75 USD | -0.29 CAD |
| Fiscal Year | 2024 | 2025 |
Income Statement Interpretations
Illinois Tool Works Inc.
Illinois Tool Works has demonstrated steady revenue growth of 26.44% between 2020 and 2024, with net income increasing 65.39% over the same period. Margins have generally improved, with a favorable gross margin at 43.65% and a net margin of 21.94%. In 2024, revenue slightly declined by 1.3%, but net income and EPS grew by 19.51% and 20.23%, respectively, indicating margin expansion and operational efficiency.
ATS Corporation
ATS Corporation experienced a strong revenue growth of 77.15% from 2021 to 2025 but faced a declining net income trend, resulting in a 143.76% drop in net income overall. Margins remain challenged, with a low EBIT margin of 0.6% and a negative net margin of -1.11%. In 2025, revenue fell 16.47%, accompanied by a 95.18% EBIT decline and deteriorating profitability metrics, signaling operational difficulties in the latest year.
Which one has the stronger fundamentals?
Illinois Tool Works exhibits stronger fundamentals, with consistently favorable margin metrics and positive net income growth despite a slight revenue dip in 2024. Conversely, ATS shows unfavorable profitability and margin trends, including a significant net income decline and negative net margin. Overall, ITW’s income statement reflects more stable and efficient financial performance than ATS’s.
Financial Ratios Comparison
The table below presents a side-by-side comparison of key financial ratios for Illinois Tool Works Inc. (ITW) and ATS Corporation (ATS) based on their most recent fiscal year data, offering insight into their financial health and performance.
| Ratios | Illinois Tool Works Inc. (ITW) | ATS Corporation (ATS) |
|---|---|---|
| ROE | 105.2% | -1.64% |
| ROIC | 27.2% | 0.09% |
| P/E | 21.6 | -125.3 |
| P/B | 22.7 | 2.06 |
| Current Ratio | 1.36 | 1.69 |
| Quick Ratio | 0.99 | 1.41 |
| D/E (Debt to Equity) | 2.44 | 1.00 |
| Debt-to-Assets | 53.6% | 36.8% |
| Interest Coverage | 15.1 | 0.09 |
| Asset Turnover | 1.06 | 0.55 |
| Fixed Asset Turnover | 6.91 | 5.66 |
| Payout Ratio | 48.6% | 0% |
| Dividend Yield | 2.25% | 0% |
Interpretation of the Ratios
Illinois Tool Works Inc.
Illinois Tool Works shows strong profitability with a favorable net margin of 21.94% and an exceptionally high return on equity at 105.16%. The company’s debt levels are relatively high, with debt-to-equity and debt-to-assets ratios flagged as unfavorable. Dividend yield is solid at 2.25%, supported by free cash flow, indicating sustainable shareholder returns with manageable payout risks.
ATS Corporation
ATS Corporation’s ratios reflect challenges, including an unfavorable net margin of -1.11% and negative return on equity at -1.64%, signaling profitability issues. Liquidity ratios are favorable, but low interest coverage and zero dividend yield highlight financial strain. The absence of dividends aligns with ongoing reinvestment and operational turnaround efforts, consistent with its current financial profile.
Which one has the best ratios?
Illinois Tool Works has the more favorable financial ratios overall, with half of its key metrics positive and only a minority unfavorable, reflecting stronger profitability and dividend support. In contrast, ATS Corporation exhibits more unfavorable ratios and operational weaknesses, contributing to a slightly unfavorable overall evaluation.
Strategic Positioning
This section compares the strategic positioning of ITW and ATS, including market position, key segments, and exposure to technological disruption:
Illinois Tool Works Inc. (ITW)
- Large market cap of 74.7B USD with broad industrial machinery presence and moderate competitive pressure.
- Diversified segments including automotive OEM, food equipment, welding, polymers, construction, and specialty products.
- Exposure to technological disruption via electronics testing and software for production efficiency.
ATS Corporation (ATS)
- Smaller market cap of 2.8B USD focused on automation solutions with higher competitive pressure.
- Concentrated on automation engineering, manufacturing, and connected factory floor digital solutions.
- Strong focus on automation and digital solutions, directly tied to technological innovation and disruption.
ITW vs ATS Positioning
ITW adopts a diversified industrial product strategy across multiple segments, providing stability but facing broad market competition. ATS concentrates on automation and digital factory solutions, offering specialization but greater exposure to industry cyclicality and technological shifts.
Which has the best competitive advantage?
ITW demonstrates a very favorable moat with growing ROIC exceeding WACC, indicating durable competitive advantage. ATS shows a very unfavorable moat with declining ROIC below WACC, reflecting value destruction and weaker competitive positioning.
Stock Comparison
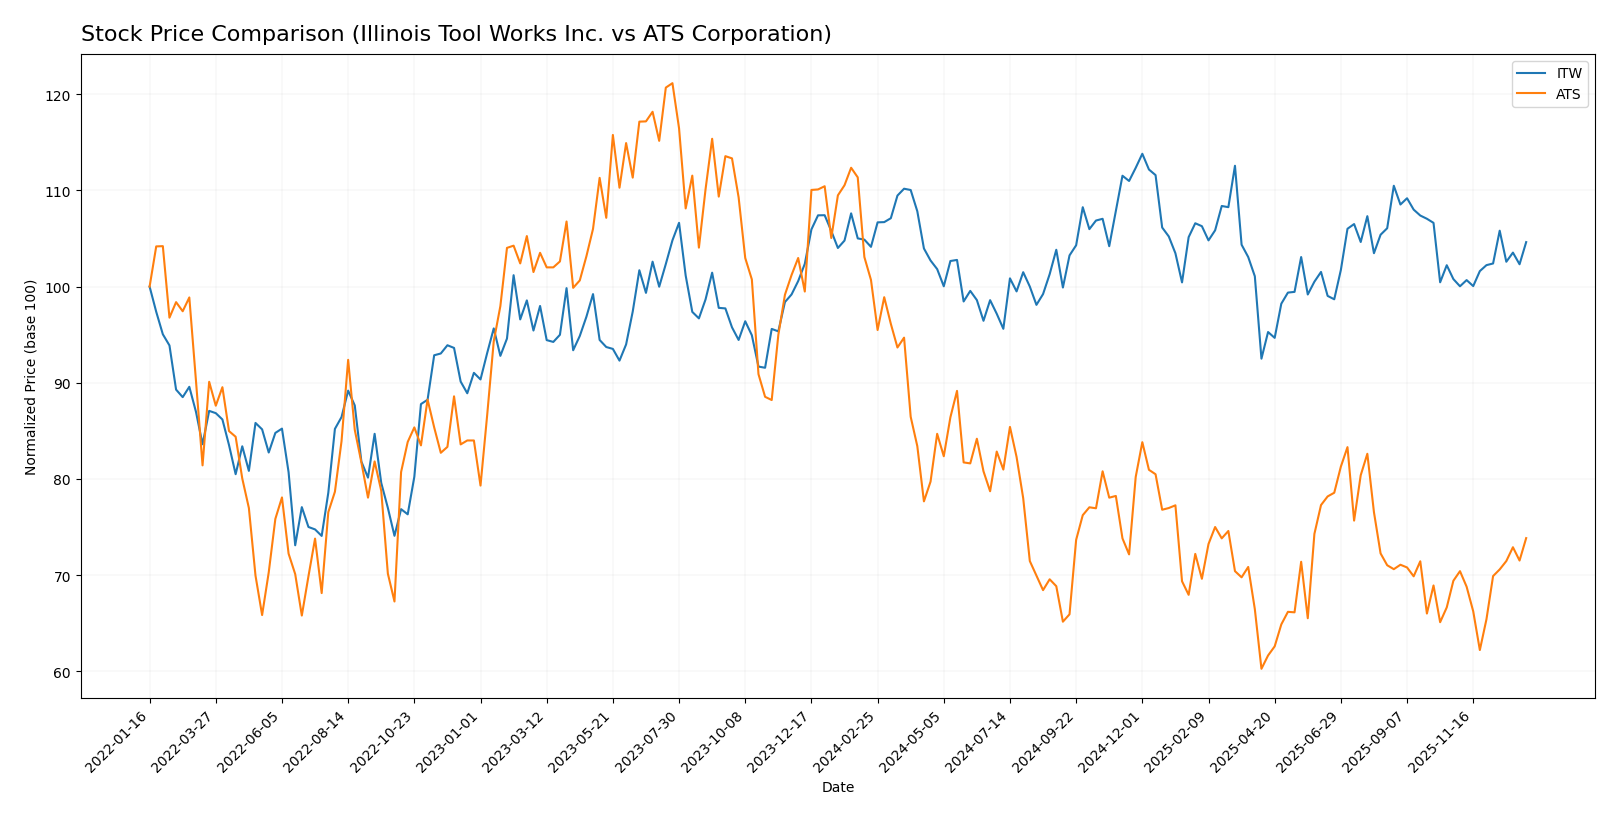
The past year exhibited contrasting price dynamics, with Illinois Tool Works Inc. showing a mild bullish trend with price acceleration, while ATS Corporation faced a pronounced bearish trend despite recent recovery signals.
Trend Analysis
Illinois Tool Works Inc. experienced a 0.47% price increase over the past 12 months, indicating a neutral to mild bullish trend with accelerating momentum and price volatility reflected by a 10.66 standard deviation.
ATS Corporation endured a 26.66% price decline over the same period, confirming a strong bearish trend with accelerating downward momentum and lower volatility at a 3.24 standard deviation.
Comparatively, Illinois Tool Works Inc. delivered the highest market performance, maintaining price stability and slight growth, while ATS Corporation showed significant depreciation despite recent short-term gains.
Target Prices
The current analyst consensus provides clear target price ranges for both Illinois Tool Works Inc. and ATS Corporation.
| Company | Target High | Target Low | Consensus |
|---|---|---|---|
| Illinois Tool Works Inc. | 275 | 230 | 254 |
| ATS Corporation | 34 | 34 | 34 |
For Illinois Tool Works Inc., the consensus target price of 254 USD is slightly below the current market price of 255.12 USD, suggesting a neutral stance among analysts. ATS Corporation’s target price of 34 USD is notably above its current price of 28.8 USD, indicating a positive outlook.
Analyst Opinions Comparison
This section compares analysts’ ratings and grades for Illinois Tool Works Inc. (ITW) and ATS Corporation (ATS):
Rating Comparison
ITW Rating
- Rating: B, considered Very Favorable by analysts.
- Discounted Cash Flow Score: 3, indicating a Moderate valuation assessment.
- ROE Score: 5, reflecting very efficient profit generation from equity.
- ROA Score: 5, denoting very effective asset utilization.
- Debt To Equity Score: 1, signaling very unfavorable financial leverage.
- Overall Score: 3, a Moderate overall financial standing.
ATS Rating
- Rating: C, also labeled Very Favorable by analysts.
- Discounted Cash Flow Score: 3, also Moderate valuation assessment.
- ROE Score: 1, showing very unfavorable profit generation efficiency.
- ROA Score: 1, indicating very unfavorable asset utilization.
- Debt To Equity Score: 1, also very unfavorable financial leverage.
- Overall Score: 2, a Moderate but lower overall financial standing.
Which one is the best rated?
Based on the provided data, ITW is better rated with a higher overall score and superior profitability metrics (ROE and ROA) compared to ATS, despite both having very unfavorable debt to equity scores.
Scores Comparison
Here is a comparison of the Altman Z-Score and Piotroski Score for Illinois Tool Works Inc. (ITW) and ATS Corporation (ATS):
ITW Scores
- Altman Z-Score: 7.93, indicating a safe zone with very low bankruptcy risk.
- Piotroski Score: 7, classified as strong financial health.
ATS Scores
- Altman Z-Score: 1.68, indicating a distress zone with higher bankruptcy risk.
- Piotroski Score: 3, classified as very weak financial health.
Which company has the best scores?
Based on the data, ITW shows a significantly stronger financial position with a safe Altman Z-Score and a strong Piotroski Score. ATS falls in the distress zone for bankruptcy risk and has a very weak Piotroski Score, indicating weaker financial health.
Grades Comparison
The following presents a detailed comparison of grades and ratings for Illinois Tool Works Inc. and ATS Corporation:
Illinois Tool Works Inc. Grades
This table summarizes recent grades and rating actions from reliable financial institutions for Illinois Tool Works Inc.:
| Grading Company | Action | New Grade | Date |
|---|---|---|---|
| Wells Fargo | Maintain | Underweight | 2026-01-07 |
| Goldman Sachs | Downgrade | Sell | 2025-12-16 |
| B of A Securities | Upgrade | Neutral | 2025-11-18 |
| Barclays | Maintain | Underweight | 2025-10-27 |
| Truist Securities | Maintain | Hold | 2025-10-27 |
| Wells Fargo | Maintain | Underweight | 2025-10-27 |
| Truist Securities | Maintain | Hold | 2025-10-08 |
| Barclays | Downgrade | Underweight | 2025-08-14 |
| Barclays | Maintain | Equal Weight | 2025-08-04 |
| UBS | Maintain | Neutral | 2025-07-31 |
Overall, Illinois Tool Works shows a predominantly cautious to negative outlook with multiple underweight and sell ratings, balanced by a few neutral and hold grades.
ATS Corporation Grades
This table summarizes recent grades and rating actions from reliable financial institutions for ATS Corporation:
| Grading Company | Action | New Grade | Date |
|---|---|---|---|
| JP Morgan | Maintain | Neutral | 2024-08-13 |
| Goldman Sachs | Maintain | Sell | 2024-08-13 |
| JP Morgan | Maintain | Neutral | 2024-05-24 |
ATS Corporation’s ratings reflect a cautious stance with a consensus between neutral and sell, indicating moderate risk perception.
Which company has the best grades?
Illinois Tool Works has a broader range of grades but leans mostly towards underweight and hold, while ATS Corporation’s fewer grades are split between neutral and sell. Investors may interpret Illinois Tool Works as having a slightly more varied but still cautious outlook compared to ATS Corporation’s consistent moderate caution.
Strengths and Weaknesses
Below is a comparative overview of key strengths and weaknesses for Illinois Tool Works Inc. (ITW) and ATS Corporation (ATS) based on their latest financial and operational data.
| Criterion | Illinois Tool Works Inc. (ITW) | ATS Corporation (ATS) |
|---|---|---|
| Diversification | Highly diversified across multiple industrial segments with balanced revenue streams (over $17B total in 2024). | Limited diversification; focused primarily in a narrower industrial tech niche. |
| Profitability | Strong profitability: net margin 21.94%, ROE 105.16%, ROIC 27.19%, consistently creating value. | Negative profitability: net margin -1.11%, ROE -1.64%, ROIC 0.09%, value destroying. |
| Innovation | Demonstrates innovation via strong product segments like Test & Measurement and Electronics, with growing ROIC trend (+62%). | Innovation appears limited given declining ROIC trend (-98.9%) and value destruction. |
| Global presence | Established global footprint with revenues from diverse geographic and product segments. | More regional or limited global presence, smaller scale operations. |
| Market Share | Significant market share in industrial equipment sectors with durable competitive advantages. | Smaller market share, struggling to maintain profitability and growth. |
Key takeaways: ITW presents a robust investment profile with strong diversification, profitability, and a durable competitive moat. In contrast, ATS faces challenges with declining profitability and limited diversification, signaling higher investment risk. Investors should consider ITW for stability and value creation, while ATS requires cautious evaluation and risk management.
Risk Analysis
Below is a comparative table summarizing key risks for Illinois Tool Works Inc. (ITW) and ATS Corporation (ATS) based on their most recent financial and market data from 2024–2025.
| Metric | Illinois Tool Works Inc. (ITW) | ATS Corporation (ATS) |
|---|---|---|
| Market Risk | Moderate (Beta 1.17) | Moderate-High (Beta 1.27) |
| Debt Level | High (Debt/Equity 2.44, 53.6% debt/assets) | Moderate (Debt/Equity 1.0, 36.8% debt/assets) |
| Regulatory Risk | Moderate (US industrial regulations) | Moderate (Canada & US market exposure) |
| Operational Risk | Low (diversified segments, strong operational metrics) | Elevated (negative net margin, weak ROE/ROIC) |
| Environmental Risk | Moderate (industrial manufacturing impact) | Moderate (automation sector, energy markets exposure) |
| Geopolitical Risk | Moderate (global supply chains) | Moderate (North American focus, global customers) |
In synthesis, ATS faces more acute operational and financial risks, including a negative net margin and distress-level Altman Z-score, indicating higher bankruptcy risk. ITW, despite higher leverage, shows stronger profitability and financial stability, making market and debt levels the primary risks to monitor.
Which Stock to Choose?
Illinois Tool Works Inc. (ITW) shows a generally favorable income evolution with strong net margin growth and profitability metrics. Its financial ratios reveal solid returns on equity and capital, though debt levels and price-to-book ratios are less favorable. The company holds a very favorable rating supported by robust scores and a very favorable moat status indicating durable competitive advantages.
ATS Corporation (ATS) presents an unfavorable income evolution marked by negative net margin and declining profitability. Its financial ratios indicate weaker returns and higher financial risk with unfavorable debt and interest coverage metrics. Despite a very favorable rating label, its scores show financial distress, and the moat evaluation is very unfavorable, reflecting value destruction and deteriorating profitability.
Investors focused on stability and quality investing might find ITW’s strong profitability and durable competitive advantage more appealing, while those with a tolerance for higher risk and a growth-oriented profile could interpret ATS’s recent price recovery and market cap growth as potential opportunities, despite its financial challenges.
Disclaimer: Investment carries a risk of loss of initial capital. The past performance is not a reliable indicator of future results. Be sure to understand risks before making an investment decision.
Go Further
I encourage you to read the complete analyses of Illinois Tool Works Inc. and ATS Corporation to enhance your investment decisions: