Home > Comparison > Industrials > IEX vs ATS
The strategic rivalry between IDEX Corporation and ATS Corporation shapes the trajectory of the industrial machinery sector. IDEX operates as a diversified industrial powerhouse with fluidics and safety solutions, while ATS specializes in automation systems and digital manufacturing services. This head-to-head highlights a contest between broad-based industrial manufacturing and focused automation innovation. This analysis will determine which company offers superior risk-adjusted returns for a diversified portfolio in a complex industrial landscape.
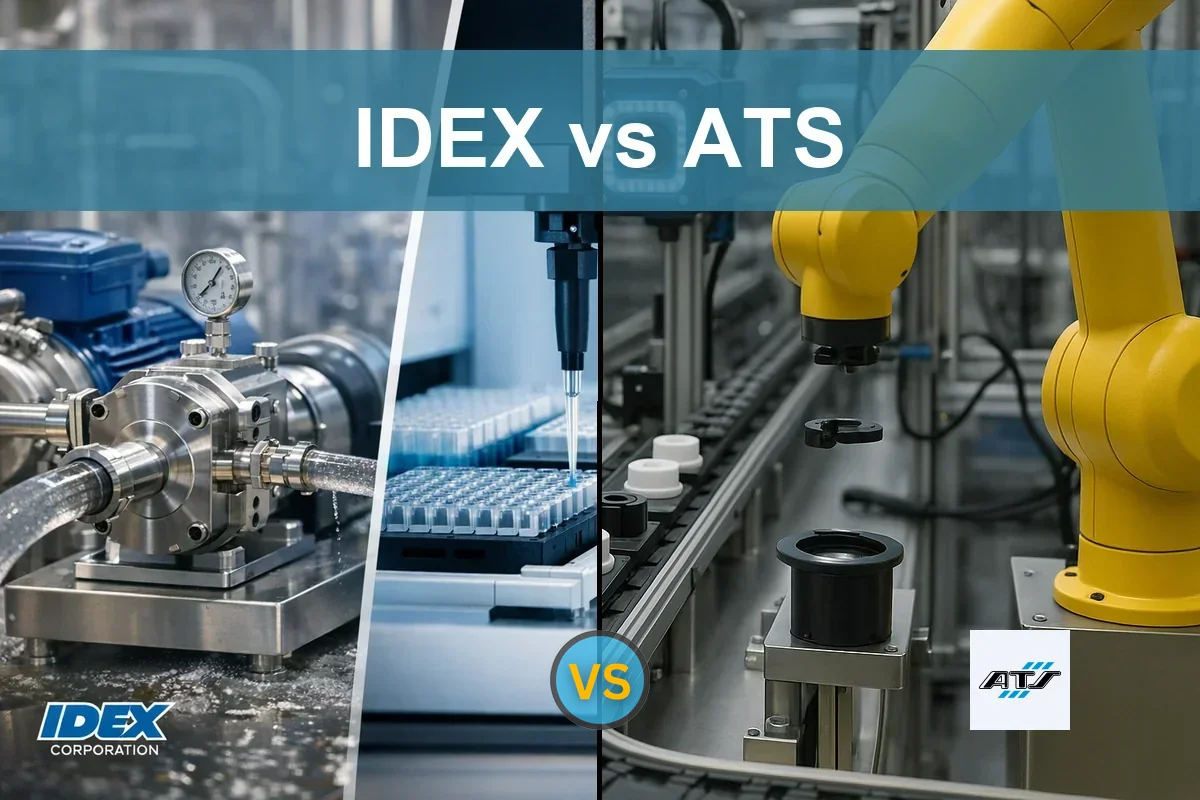
Table of contents
Companies Overview
IDEX Corporation and ATS Corporation occupy pivotal roles in the industrial machinery sector, shaping automation and fluid technology markets.
IDEX Corporation: Applied Solutions Powerhouse
IDEX Corporation stands as a leader in fluid and metering technologies, generating revenue primarily through the design and distribution of pumps, flow meters, and fluid-handling systems. In 2026, its strategic focus centers on expanding precision fluidics and engineered products across diverse industries, including life sciences and energy, leveraging its broad product portfolio to maintain competitive advantage globally.
ATS Corporation: Automation Innovator
ATS Corporation specializes in automation solutions, deriving income from planning, building, and servicing automated manufacturing systems. The company’s 2026 strategy emphasizes integrating connected factory floor management systems and digital solutions to enhance operational efficiency and reduce downtime across sectors such as life sciences, transportation, and consumer products.
Strategic Collision: Similarities & Divergences
Both companies emphasize industrial innovation but differ fundamentally; IDEX relies on a diversified product portfolio with fluid technologies, while ATS pursues an open automation infrastructure supported by digital integration. Their competition centers on the evolving manufacturing ecosystem, where fluid control meets smart automation. Investors face distinct profiles: IDEX offers broad industrial exposure, ATS targets growth through digital transformation and service-led differentiation.
Income Statement Comparison
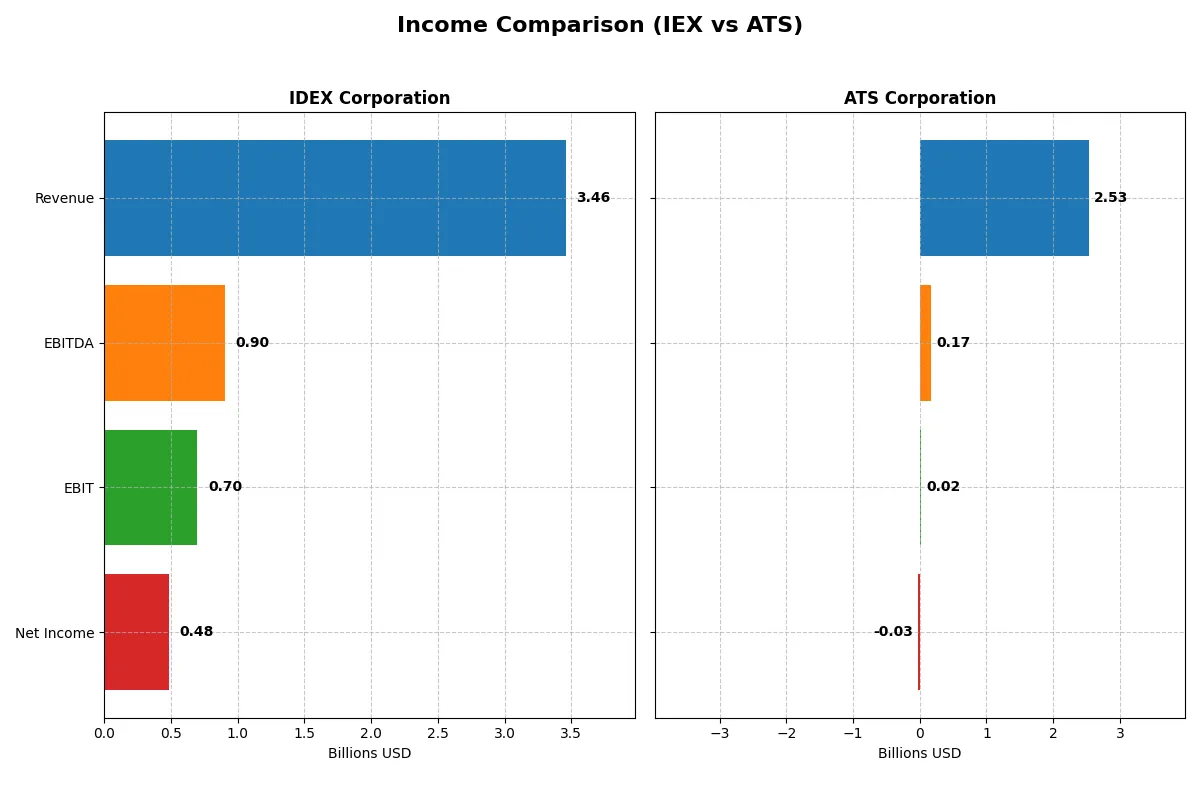
The following data dissects the core profitability and scalability of both corporate engines to reveal who dominates the bottom line:
| Metric | IDEX Corporation (IEX) | ATS Corporation (ATS) |
|---|---|---|
| Revenue | 3.46B | 2.53B |
| Cost of Revenue | 1.92B | 1.89B |
| Operating Expenses | 819M | 637M |
| Gross Profit | 1.54B | 647M |
| EBITDA | 904M | 168M |
| EBIT | 697M | 15M |
| Interest Expense | 64M | 98M |
| Net Income | 483M | -28M |
| EPS | 6.41 | -0.29 |
| Fiscal Year | 2025 | 2025 |
Income Statement Analysis: The Bottom-Line Duel
This income statement comparison reveals which company drives profitability and margin efficiency more effectively through their operational engines.
IDEX Corporation Analysis
IDEX Corporation shows steady revenue growth, reaching $3.46B in 2025 with a net income of $483M. Gross and net margins remain robust at 44.5% and 14.0%, respectively, demonstrating solid operational efficiency. Despite a slight net margin decline last year, IDEX sustains favorable earnings momentum and disciplined expense control.
ATS Corporation Analysis
ATS Corporation’s revenue declined 16.5% to CAD 2.53B in 2025, accompanied by a net loss of CAD 28M. Gross margin at 25.5% is moderate, but net margin sits negative, reflecting operational challenges. The sharp drop in EBIT and net income signals deteriorating profitability and weak margin management in the most recent fiscal year.
Margin Strength vs. Revenue Stability
IDEX outperforms ATS with superior margin health and consistent profitability despite slower revenue growth. ATS’s revenue volatility and steep margin erosion mark it as the weaker fundamental performer. Investors seeking stability and margin resilience will find IDEX’s profile more attractive due to its proven earnings quality.
Financial Ratios Comparison
These vital ratios act as a diagnostic tool to expose the underlying fiscal health, valuation premiums, and capital efficiency of the companies compared below:
| Ratios | IDEX Corporation (IEX) | ATS Corporation (ATS) |
|---|---|---|
| ROE | 12.0% | -1.6% |
| ROIC | 8.6% | 0.09% |
| P/E | 27.7 | -125.3 |
| P/B | 3.33 | 2.06 |
| Current Ratio | 2.86 | 1.69 |
| Quick Ratio | 2.02 | 1.41 |
| D/E | 0.00017 | 1.00 |
| Debt-to-Assets | 0.0001 | 0.37 |
| Interest Coverage | 11.18 | 0.09 |
| Asset Turnover | 0.50 | 0.55 |
| Fixed Asset Turnover | 7.39 | 5.66 |
| Payout ratio | 44.0% | 0% |
| Dividend yield | 1.59% | 0% |
| Fiscal Year | 2025 | 2025 |
Efficiency & Valuation Duel: The Vital Signs
Financial ratios serve as a company’s DNA, exposing hidden risks and operational strengths critical to investment decisions.
IDEX Corporation
IDEX delivers solid profitability with a 12% ROE and a favorable 14% net margin, revealing operational efficiency. The stock appears stretched with a high P/E of 27.7 and a P/B of 3.3. It supports shareholders with a 1.6% dividend yield, signaling steady income alongside reinvestment in growth and innovation.
ATS Corporation
ATS struggles with a negative ROE of -1.6% and a -1.1% net margin, underscoring weak profitability. The stock’s valuation appears attractive with a negative P/E, reflecting losses, while its P/B stands neutral at 2.1. ATS pays no dividend, indicating focus on restructuring or reinvestment amid financial challenges.
Balanced Efficiency vs. Recovery Risks
IDEX offers a safer profile with consistent profits and modest dividends, despite a premium valuation. ATS presents higher risk due to losses and weak returns but trades at a discount. Investors seeking stability lean toward IDEX, while those favoring turnaround potential may consider ATS’s riskier stance.
Which one offers the Superior Shareholder Reward?
IDEX Corporation (IEX) delivers a more compelling shareholder reward than ATS Corporation (ATS) in 2026. IEX pays a 1.59% dividend yield with a 44% payout ratio, well-covered by free cash flow (0.91 FCF/OCF ratio). Its buyback program further boosts returns. Conversely, ATS pays no dividend, runs negative free cash flow (-0.53/share), and shows weak operating cash flow (0.02 ratio), relying heavily on reinvestment amid losses. ATS’s financial leverage and low coverage ratios raise risk. IEX’s balanced dividend and buyback approach offers more sustainable, total shareholder return. I recommend IEX for long-term value and income stability.
Comparative Score Analysis: The Strategic Profile
The radar chart reveals the fundamental DNA and trade-offs of IDEX Corporation and ATS Corporation, highlighting their financial strengths and weaknesses across key metrics:
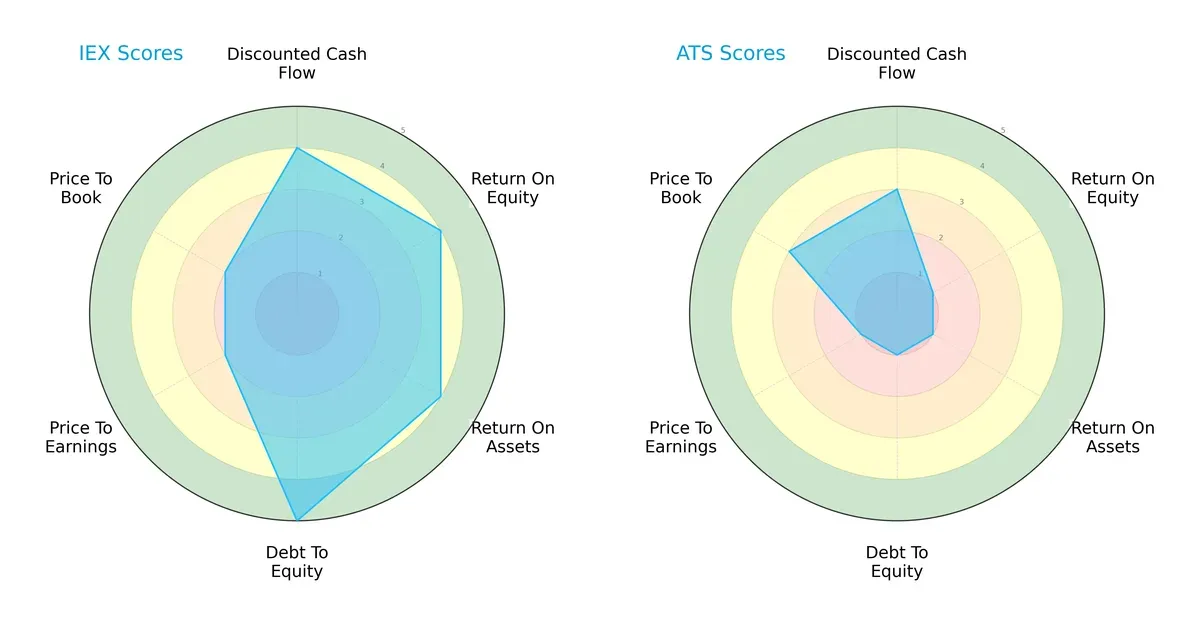
IDEX Corporation demonstrates a balanced profile with strong scores in DCF (4), ROE (4), ROA (4), and an excellent debt-to-equity score (5). ATS relies heavily on a modest DCF (3) but suffers from poor profitability (ROE 1, ROA 1) and high financial risk (debt-to-equity 1). IDEX’s valuation metrics (P/E 2, P/B 2) show moderate caution, whereas ATS has weaker pricing scores, underscoring its riskier profile.
Bankruptcy Risk: Solvency Showdown
The Altman Z-Score gap between IDEX (5.23) and ATS (1.76) is stark:
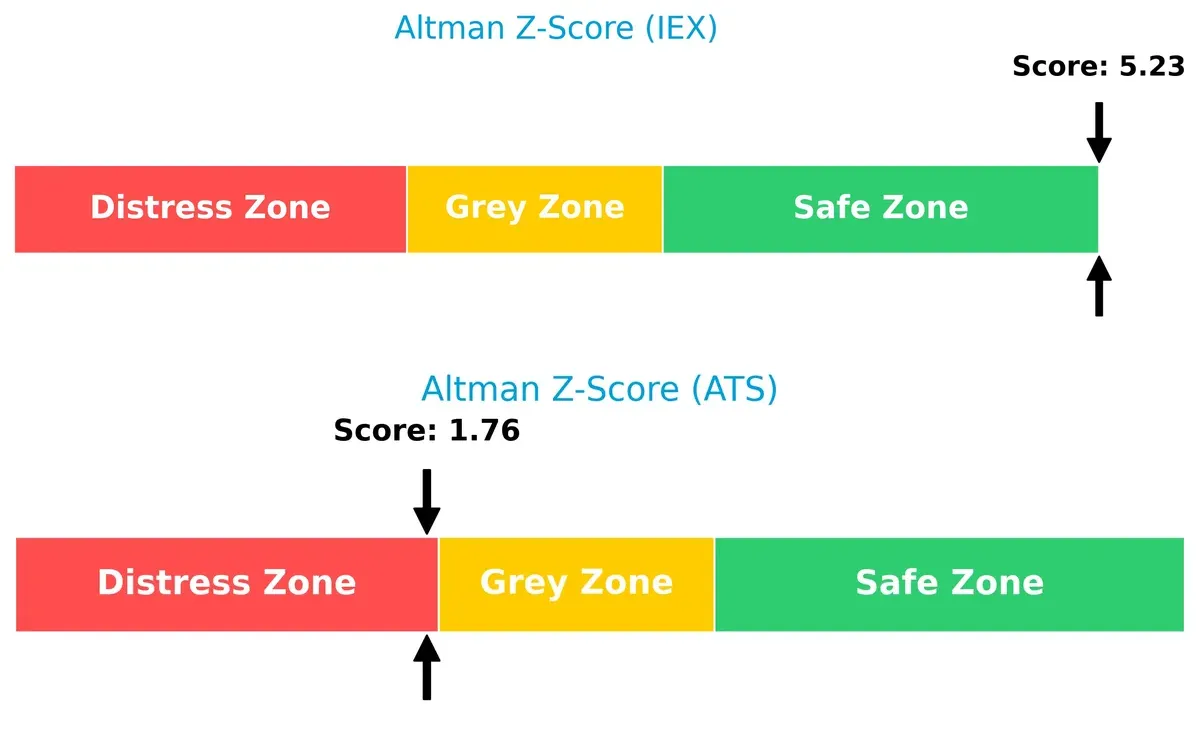
IDEX sits firmly in the safe zone, indicating strong long-term survival prospects amid economic cycles. ATS falls in the distress zone, signaling high bankruptcy risk and vulnerability to market downturns.
Financial Health: Quality of Operations
Piotroski F-Scores highlight clear operational quality differences:
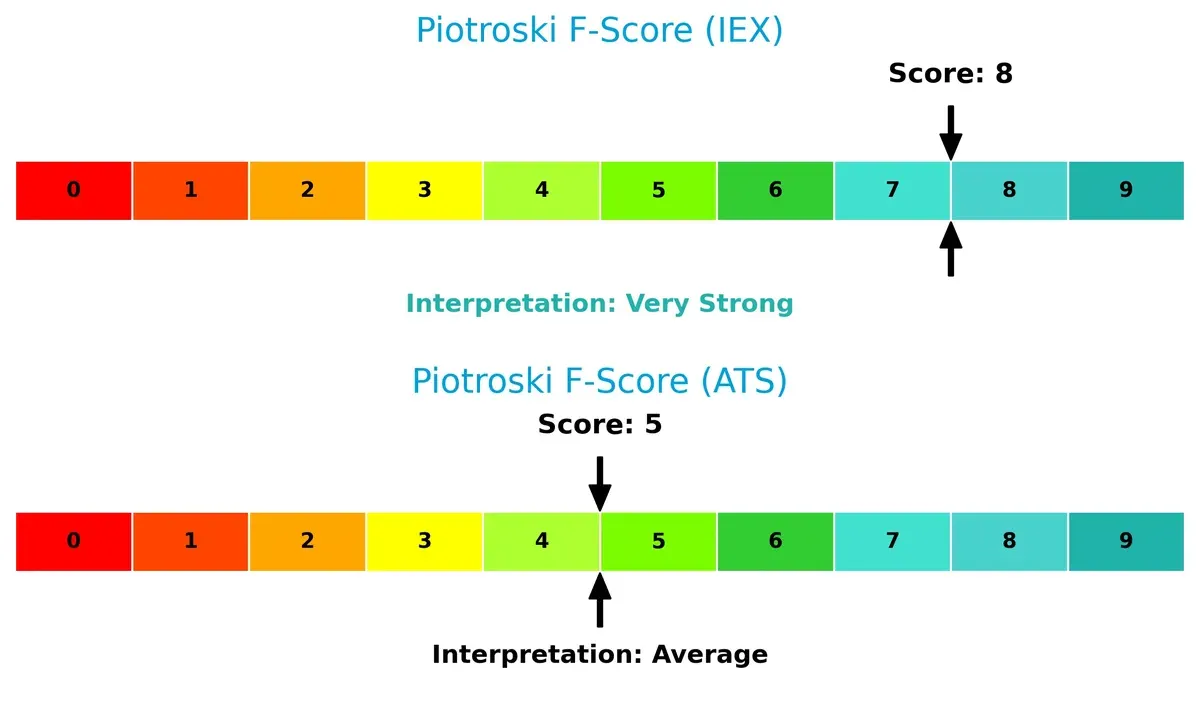
IDEX’s score of 8 signals very strong financial health, reflecting robust profitability and efficient capital use. ATS’s average score of 5 raises red flags about its internal metrics and operational resilience compared to IDEX. Investors should exercise caution with ATS’s financial stability.
How are the two companies positioned?
This section dissects the operational DNA of IEX and ATS by comparing their revenue distribution by segment alongside internal strengths and weaknesses. The goal is to confront their economic moats and reveal which business model delivers the most resilient, sustainable competitive advantage today.
Revenue Segmentation: The Strategic Mix
This visual comparison dissects how IDEX Corporation and ATS Corporation diversify their income streams and where their primary sector bets lie:
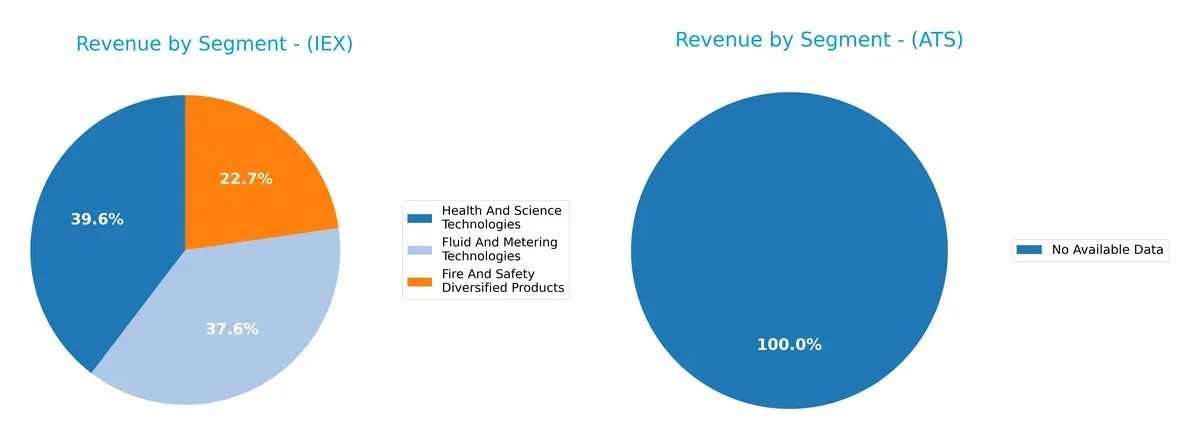
IDEX Corporation reveals a balanced revenue mix across Health And Science Technologies at $1.3B, Fluid And Metering Technologies near $1.23B, and Fire And Safety Diversified Products at $744M. This diversification reduces sector risk and anchors its ecosystem lock-in. ATS Corporation lacks available revenue segmentation data, preventing direct comparison. IDEX’s broad base contrasts with ATS’s unknown concentration, highlighting IDEX’s strategic advantage in infrastructure dominance.
Strengths and Weaknesses Comparison
This table compares the strengths and weaknesses of IDEX Corporation and ATS Corporation:
IDEX Corporation Strengths
- Diversified revenue across three product segments
- Strong net margin of 13.98%
- Favorable liquidity ratios with current ratio at 2.86
- Very low debt-to-assets at 0.01%
- Solid presence in the US and Europe markets
- Favorable fixed asset turnover at 7.39
ATS Corporation Strengths
- Presence in key markets including US, Germany, Italy, and Europe
- Favorable fixed asset turnover at 5.66
- Moderate current ratio of 1.69 and quick ratio of 1.41
- Price-to-earnings ratio favorable due to negative earnings
- Neutral price-to-book at 2.06
IDEX Corporation Weaknesses
- Price-to-earnings and price-to-book ratios unfavorable
- Asset turnover low at 0.5 indicates less efficient asset use
- Return on equity and return on invested capital neutral
- Dividend yield only neutral at 1.59%
- Limited growth outside the US compared to global peers
ATS Corporation Weaknesses
- Negative net margin and negative return on equity indicate losses
- Very low interest coverage ratio at 0.16 signals financial stress
- Debt-to-equity ratio of 1.0 reflects higher leverage
- No dividend yield
- Slightly unfavorable global ratio opinion
IDEX’s strengths lie in its diversified product base, strong profitability, and robust liquidity. ATS faces profitability challenges and financial risks but benefits from geographic presence and asset utilization. Each company’s strategy must address these core financial and market position dynamics.
The Moat Duel: Analyzing Competitive Defensibility
A structural moat is the sole shield preserving long-term profits from relentless competitive erosion. Here’s how IEX Corporation and ATS Corporation defend their turf:
IDEX Corporation: Diverse Industrial Solutions with Intangible Asset Moat
IEX leverages intangible assets like specialized engineering and brand reputation. This shows in its stable 20% EBIT margin and solid gross margin near 45%. In 2026, expanding fluidics and safety tech could reinforce its niche defenses.
ATS Corporation: Automation Expertise with Cost and Service Moat
ATS relies on cost-efficient automation engineering and comprehensive lifecycle services, contrasting IEX’s product breadth. Though margins are thinner, ATS’s integration of software solutions drives operational efficiency. New digital factory offerings may deepen its competitive edge.
Defensive Depth: Intangible Assets vs. Service-Driven Cost Advantage
Both firms struggle with declining ROICs below WACC, signaling value erosion. However, IEX’s higher margin base and diversified product portfolio create a wider moat. I view IEX as better positioned to protect market share amid industry headwinds.
Which stock offers better returns?
Over the past 12 months, both IDEX Corporation and ATS Corporation exhibited bearish trends overall, followed by recent strong recoveries marked by accelerating price gains.
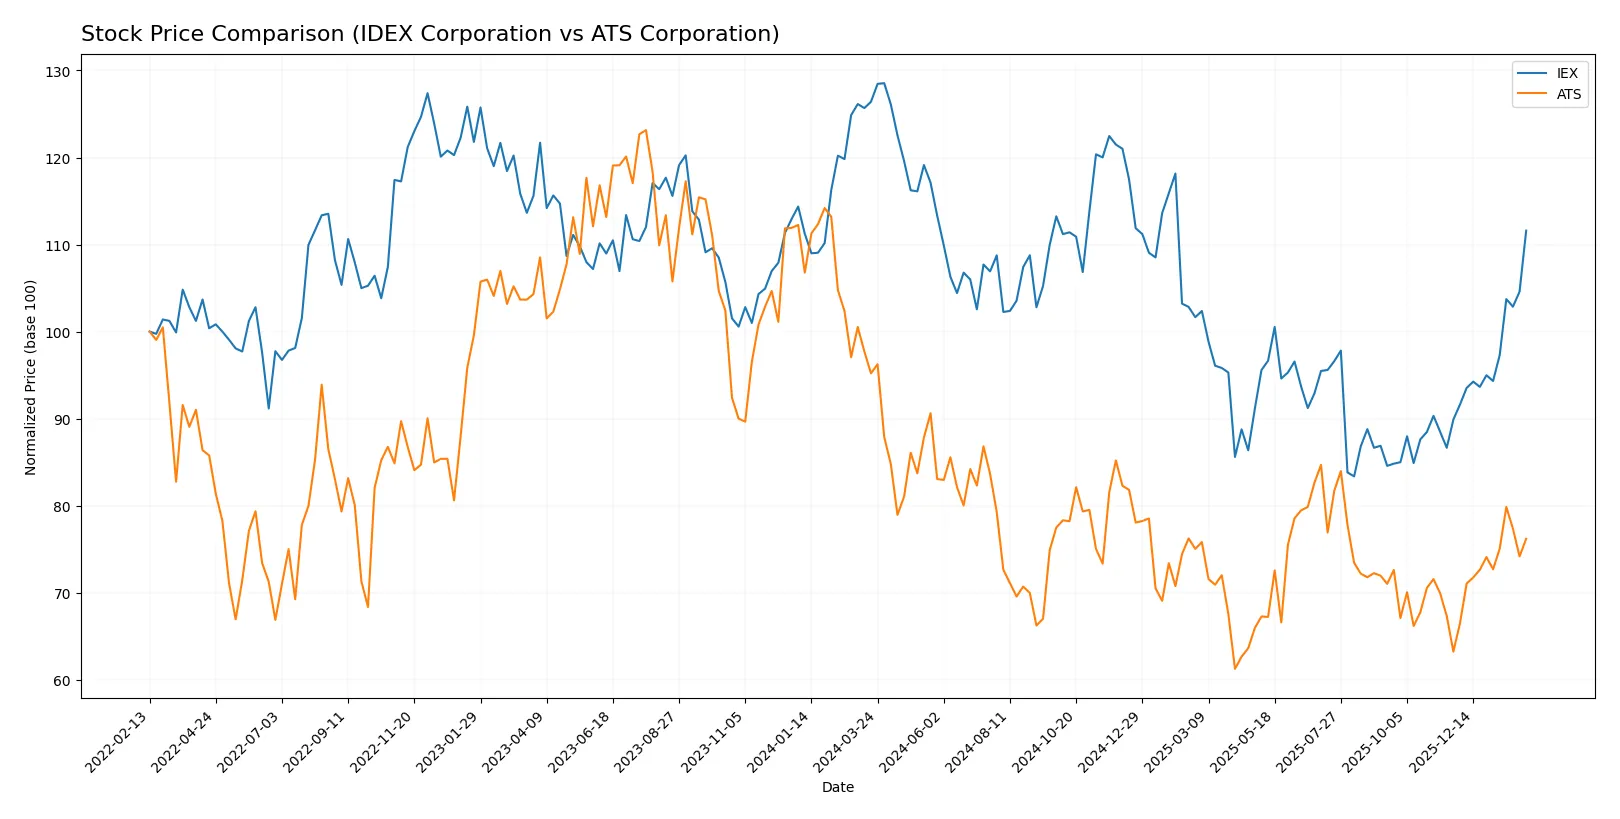
Trend Comparison
IDEX Corporation’s stock declined 11.71% over the last year, showing a bearish trend with accelerating losses. It reached a high of 244.02 and a low of 158.26, with notable volatility at 22.68%.
ATS Corporation’s stock fell 19.97% during the same period, also bearish with accelerating losses. It recorded a high of 36.93 and a low of 23.5, but with much lower volatility at 2.71%.
Both stocks reversed recent declines, gaining 24.15% for IDEX and 20.51% for ATS since November 2025. IDEX delivered the stronger recent market performance.
Target Prices
Analysts present a clear consensus on target prices for IDEX Corporation and ATS Corporation.
| Company | Target Low | Target High | Consensus |
|---|---|---|---|
| IDEX Corporation | 210 | 247 | 222 |
| ATS Corporation | 34 | 34 | 34 |
The target consensus for IDEX at 222 suggests moderate upside from its 211.57 price, reflecting confidence in its industrial machinery niche. ATS’s consensus of 34 indicates a potential 15% gain from its 29.44 current price, signaling solid analyst optimism.

Don’t Let Luck Decide Your Entry Point
Optimize your entry points with our advanced ProRealTime indicators. You’ll get efficient buy signals with precise price targets for maximum performance. Start outperforming now!
How do institutions grade them?
IDEX Corporation Grades
The table below summarizes recent grades issued by reputable firms for IDEX Corporation.
| Grading Company | Action | New Grade | Date |
|---|---|---|---|
| Stifel | Maintain | Buy | 2026-01-23 |
| Citigroup | Maintain | Buy | 2025-12-08 |
| RBC Capital | Maintain | Outperform | 2025-10-30 |
| Stifel | Maintain | Buy | 2025-10-20 |
| Oppenheimer | Maintain | Outperform | 2025-10-07 |
| DA Davidson | Maintain | Neutral | 2025-08-04 |
| Stifel | Maintain | Buy | 2025-07-31 |
| RBC Capital | Maintain | Outperform | 2025-07-31 |
| Oppenheimer | Maintain | Outperform | 2025-07-31 |
| Stifel | Maintain | Buy | 2025-07-21 |
ATS Corporation Grades
The table below summarizes recent grades issued by reputable firms for ATS Corporation.
| Grading Company | Action | New Grade | Date |
|---|---|---|---|
| JP Morgan | Maintain | Neutral | 2026-01-16 |
| JP Morgan | Maintain | Neutral | 2024-08-13 |
| Goldman Sachs | Maintain | Sell | 2024-08-13 |
| JP Morgan | Maintain | Neutral | 2024-05-24 |
Which company has the best grades?
IDEX Corporation consistently receives buy and outperform ratings from multiple firms. ATS Corporation holds mostly neutral ratings, with a recent sell from Goldman Sachs. Investors may view IDEX’s stronger consensus grades as indicative of better market confidence.
Risks specific to each company
The following categories identify the critical pressure points and systemic threats facing both firms in the 2026 market environment:
1. Market & Competition
IDEX Corporation
- Strong market cap at $15.9B with diversified segments shields against competition.
ATS Corporation
- Smaller $2.9B market cap limits scale; faces intense pressure from larger automation firms.
2. Capital Structure & Debt
IDEX Corporation
- Virtually no debt; debt-to-assets at 1% with strong interest coverage of 10.8x.
ATS Corporation
- High leverage with debt-to-assets near 37%; interest coverage weak at 0.16x signals financial strain.
3. Stock Volatility
IDEX Corporation
- Beta near 1.0 implies market-aligned volatility; stable trading range $153-$214.
ATS Corporation
- Beta 1.26 indicates above-market volatility; wider price swings within $21-$33 range.
4. Regulatory & Legal
IDEX Corporation
- US-based with standard industrial regulatory exposure; no major legal flags.
ATS Corporation
- Canadian base with cross-border trade regulations; potential risk from evolving automation compliance standards.
5. Supply Chain & Operations
IDEX Corporation
- Diverse global operations reduce supply chain risk; stable fixed asset turnover.
ATS Corporation
- Supply chain more vulnerable due to smaller scale and recent operational challenges.
6. ESG & Climate Transition
IDEX Corporation
- Increasing focus on sustainable fluid and safety technologies aligns with ESG trends.
ATS Corporation
- Automation systems face pressure to meet energy efficiency and emissions standards; adaptation ongoing.
7. Geopolitical Exposure
IDEX Corporation
- US headquarters with global operations; moderate geopolitical risk exposure.
ATS Corporation
- Canadian firm with international clients; geopolitical tensions could disrupt supply chains and contracts.
Which company shows a better risk-adjusted profile?
IDEX Corporation’s strongest risk factor is market competition but its pristine balance sheet and stable operations position it favorably. ATS Corporation suffers most from capital structure risks, with heavy debt and weak interest coverage undermining financial stability. IDEX’s Altman Z-score of 5.23 confirms a safe financial zone, while ATS’s 1.76 signals distress. The evidence clearly favors IDEX for a superior risk-adjusted profile in 2026.
Final Verdict: Which stock to choose?
IDEX Corporation’s superpower lies in its robust operational efficiency and strong balance sheet. It generates consistent free cash flow, underpinning its ability to weather economic cycles. A point of vigilance is its declining ROIC relative to WACC, signaling potential challenges in value creation. It fits well within portfolios targeting stable, disciplined industrial growth.
ATS Corporation’s strategic moat centers on its niche manufacturing capabilities and moderate asset turnover. However, its financial performance reveals significant volatility and weaker profitability margins compared to IDEX. Relative to IDEX, ATS offers less stability but might appeal to investors willing to take on higher risk for potential turnaround gains. It aligns with speculative or contrarian portfolio strategies.
If you prioritize resilience and proven cash generation, IDEX outshines ATS with better financial health and operational discipline. However, if you seek speculative exposure in a specialized industrial player with turnaround potential, ATS offers a higher-risk, higher-reward profile. Both choices require careful risk assessment given their respective challenges.
Disclaimer: Investment carries a risk of loss of initial capital. The past performance is not a reliable indicator of future results. Be sure to understand risks before making an investment decision.
Go Further
I encourage you to read the complete analyses of IDEX Corporation and ATS Corporation to enhance your investment decisions: