Investors seeking growth in the industrial machinery sector often consider Howmet Aerospace Inc. (HWM) and ATS Corporation (ATS), two prominent players with distinct yet overlapping market focuses. Howmet specializes in advanced engineered solutions for aerospace and transportation, while ATS excels in automation systems across diverse industries. This comparison highlights their innovation strategies and market positioning to help you decide which company might best enhance your investment portfolio in 2026.
Table of contents
Companies Overview
I will begin the comparison between Howmet Aerospace Inc. and ATS Corporation by providing an overview of these two companies and their main differences.
Howmet Aerospace Inc. Overview
Howmet Aerospace Inc. specializes in advanced engineered solutions for aerospace and transportation sectors, operating internationally across multiple countries. It segments its business into Engine Products, Fastening Systems, Engineered Structures, and Forged Wheels, serving aircraft engine, industrial gas turbine, and commercial transportation markets. Founded in 1888 and based in Pittsburgh, the company holds a strong position in industrial machinery with a market cap of 87.7B USD.
ATS Corporation Overview
ATS Corporation delivers automation solutions globally, focusing on designing, building, and servicing automated manufacturing and assembly systems. It provides extensive pre- and post-automation services, including engineering design, software development, and supply chain management. Founded in 1978 and headquartered in Cambridge, Canada, ATS serves diverse markets such as life sciences and transportation, with a market cap of 2.8B USD.
Key similarities and differences
Both Howmet Aerospace and ATS operate within the industrial machinery sector, emphasizing engineered and automated solutions for manufacturing and transportation industries. While Howmet Aerospace concentrates on aerospace components and forged products, ATS focuses on automation systems and digital solutions across varied markets. The companies differ significantly in scale, with Howmet’s market cap substantially larger, reflecting distinct business models and geographic reach.
Income Statement Comparison
The following table presents a side-by-side comparison of key income statement metrics for Howmet Aerospace Inc. and ATS Corporation for their most recent fiscal years.
| Metric | Howmet Aerospace Inc. (HWM) | ATS Corporation (ATS) |
|---|---|---|
| Market Cap | 87.7B USD | 2.8B CAD |
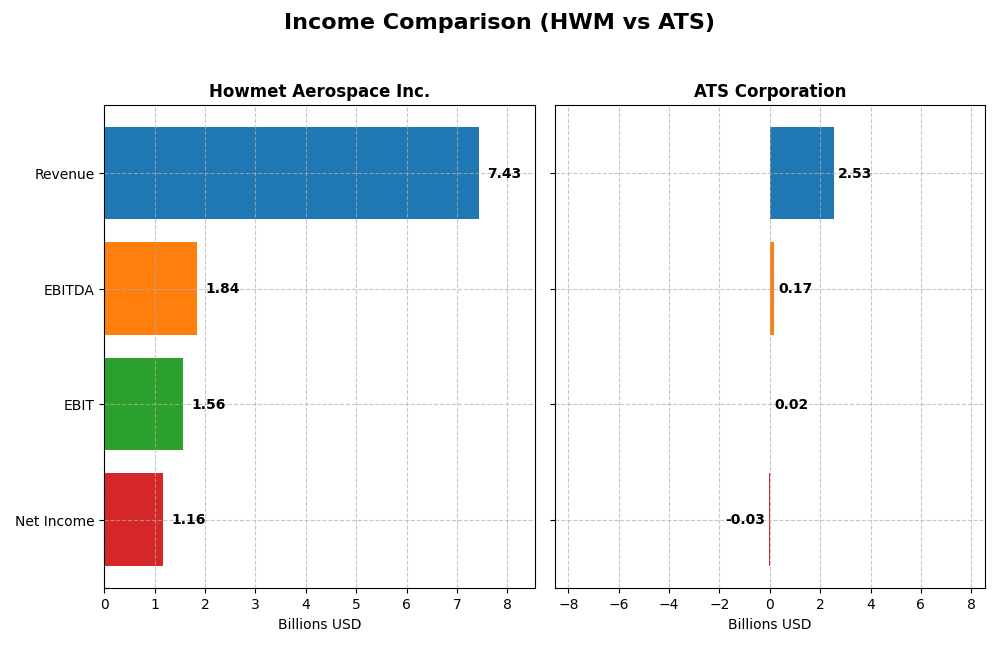
| Revenue | 7.43B USD | 2.53B CAD |
| EBITDA | 1.84B USD | 168M CAD |
| EBIT | 1.57B USD | 15.3M CAD |
| Net Income | 1.16B USD | -28.0M CAD |
| EPS | 2.83 USD | -0.29 CAD |
| Fiscal Year | 2024 | 2025 |
Income Statement Interpretations
Howmet Aerospace Inc.
Howmet Aerospace Inc. has demonstrated a consistent revenue growth trend from 2020 to 2024, with a 41.3% increase overall and an 11.9% rise in the most recent year. Net income surged impressively by 447.4% over the period, accompanied by a 34.9% rise in net margin. The 2024 fiscal year showed strong margin improvements with a gross margin of 27.6% and an EBIT margin exceeding 21%, reflecting operational efficiency gains.
ATS Corporation
ATS Corporation experienced overall revenue growth of 77.2% from 2021 to 2025, but its net income declined sharply by 143.8% in the same period. The 2025 fiscal year saw a significant revenue drop of 16.5% and a net loss, with a negative net margin of -1.11%. Despite a favorable gross margin of 25.5%, EBIT margin remained very low at 0.6%, highlighting challenges in profitability and operational leverage in the latest year.
Which one has the stronger fundamentals?
Howmet Aerospace presents stronger fundamentals with favorable trends across all key income statement metrics, including sustained revenue growth, improving margins, and robust net income increases. Conversely, ATS Corporation’s fundamentals appear weaker, marked by declining profitability, negative net margins, and a steep net income contraction despite past revenue gains. The contrast underscores Howmet’s superior income statement strength over ATS.
Financial Ratios Comparison
The table below presents a side-by-side comparison of key financial ratios for Howmet Aerospace Inc. (HWM) and ATS Corporation (ATS), based on the most recent fiscal year data available.
| Ratios | Howmet Aerospace Inc. (HWM) 2024 | ATS Corporation (ATS) 2025 |
|---|---|---|
| ROE | 25.36% | -1.64% |
| ROIC | 15.49% | 0.09% |
| P/E | 38.63 | -125.28 |
| P/B | 9.80 | 2.06 |
| Current Ratio | 2.17 | 1.69 |
| Quick Ratio | 0.98 | 1.41 |
| D/E | 0.76 | 1.00 |
| Debt-to-Assets | 33.00% | 36.79% |
| Interest Coverage | 9.19 | 0.09 |
| Asset Turnover | 0.71 | 0.55 |
| Fixed Asset Turnover | 2.92 | 5.66 |
| Payout ratio | 9.44% | 0% |
| Dividend yield | 0.24% | 0% |
Interpretation of the Ratios
Howmet Aerospace Inc.
Howmet Aerospace shows several strong ratios, including a favorable net margin of 15.55%, ROE at 25.36%, and ROIC at 15.49%, indicating solid profitability and capital efficiency. The current ratio of 2.17 and interest coverage of 8.6 are also positive. However, valuation metrics such as a PE of 38.63 and PB of 9.8 are unfavorable, suggesting the stock might be overvalued. The company pays a dividend with a low yield of 0.24%, indicating modest shareholder returns supported by a cautious payout approach.
ATS Corporation
ATS Corporation presents mixed financial ratios with unfavorable net margin (-1.11%), ROE (-1.64%), and ROIC (0.09%), reflecting profitability challenges. Liquidity ratios like current ratio (1.69) and quick ratio (1.41) are favorable, but interest coverage is poor at 0.16, raising solvency concerns. ATS does not pay dividends, likely due to negative earnings and reinvestment priorities. The PE ratio is negative but considered favorable due to losses, while fixed asset turnover is strong at 5.66, showing asset utilization efficiency.
Which one has the best ratios?
Howmet Aerospace displays a stronger overall financial profile with more favorable profitability and liquidity ratios despite some overvaluation signals. ATS Corporation struggles with profitability and solvency but maintains decent liquidity and asset turnover. Overall, Howmet’s slightly favorable ratios contrast with ATS’s slightly unfavorable evaluation, indicating a more robust financial standing for Howmet Aerospace based on the provided metrics.
Strategic Positioning
This section compares the strategic positioning of Howmet Aerospace Inc. and ATS Corporation in terms of market position, key segments, and exposure to technological disruption:
Howmet Aerospace Inc.
- Large market cap of $87.7B with diversified aerospace and transportation competition.
- Operates four segments: Engine Products, Fastening Systems, Engineered Structures, and Forged Wheels.
- Exposure to aerospace and industrial manufacturing technology, no explicit mention of disruption.
ATS Corporation
- Smaller market cap of $2.8B, facing competitive pressures in automation solutions.
- Focuses on automation solutions across multiple industries including life sciences and transportation.
- Provides software and digital solutions for connected factory management, implying adaptation to tech trends.
Howmet Aerospace Inc. vs ATS Corporation Positioning
Howmet Aerospace’s strategy is diversified across aerospace and transportation segments, offering a broad revenue base. ATS concentrates on automation systems and digital solutions, targeting efficiency in manufacturing industries. Diversification vs specialization highlights varied risk and opportunity profiles.
Which has the best competitive advantage?
Howmet Aerospace demonstrates a very favorable moat with growing ROIC above WACC, indicating durable value creation. ATS shows a very unfavorable moat with declining ROIC below WACC, suggesting value destruction and weaker competitive positioning.
Stock Comparison
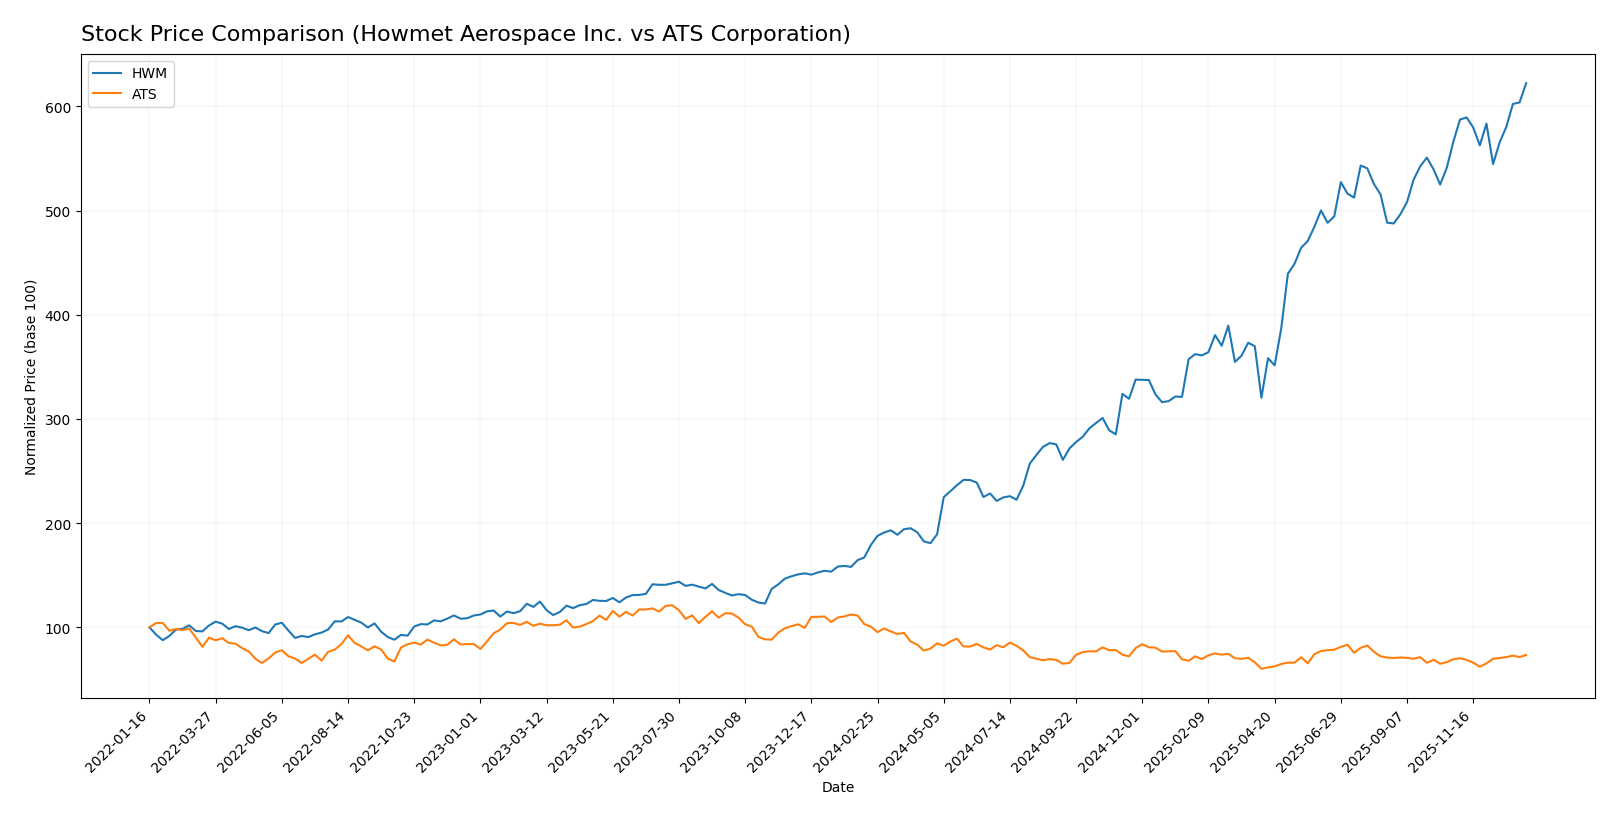
The stock price movements of Howmet Aerospace Inc. (HWM) and ATS Corporation (ATS) over the past year reveal contrasting trends with significant shifts in market sentiment and trading volumes.
Trend Analysis
Howmet Aerospace Inc. (HWM) experienced a strong bullish trend over the past 12 months, gaining 247.34% despite a deceleration in momentum. The stock fluctuated between 62.82 and 218.2, showing elevated volatility with a 47.0 standard deviation.
ATS Corporation (ATS) showed a bearish trend with a 26.99% decline over the same period, yet it displayed acceleration in downward movement. Price ranged from 23.5 to 39.27, with lower volatility evidenced by a 3.24 standard deviation.
Comparing both, HWM delivered the highest market performance with substantial gains, whereas ATS underperformed with a notable loss across the year.
Target Prices
Analyst consensus target prices indicate potential upside for both Howmet Aerospace Inc. and ATS Corporation.
| Company | Target High | Target Low | Consensus |
|---|---|---|---|
| Howmet Aerospace Inc. | 258 | 205 | 231.75 |
| ATS Corporation | 34 | 34 | 34 |
The consensus target for Howmet Aerospace at 231.75 suggests modest upside from its current price of 217.93 USD. ATS Corporation’s target price of 34 indicates a potential increase from its current trading price of 28.67 USD. Overall, analysts expect gains but investors should monitor market conditions carefully.
Analyst Opinions Comparison
This section compares analysts’ ratings and grades for Howmet Aerospace Inc. (HWM) and ATS Corporation (ATS):
Rating Comparison
HWM Rating
- Rating: B, classified as Very Favorable by analysts.
- Discounted Cash Flow Score: 2, indicating Moderate DCF.
- ROE Score: 5, reflecting Very Favorable profitability.
- ROA Score: 5, showing Very Favorable asset use.
- Debt To Equity Score: 2, with Moderate financial risk.
- Overall Score: 3, rated Moderate overall.
ATS Rating
- Rating: C, also classified as Very Favorable.
- Discounted Cash Flow Score: 3, a Moderate rating.
- ROE Score: 1, considered Very Unfavorable.
- ROA Score: 1, marked as Very Unfavorable.
- Debt To Equity Score: 1, indicating Very Unfavorable risk.
- Overall Score: 2, also Moderate but lower than HWM.
Which one is the best rated?
Based strictly on the provided data, HWM holds a higher overall rating (B) and outperforms ATS in key financial metrics like ROE and ROA. ATS has a lower overall score and weaker profitability and financial risk scores.
Scores Comparison
Here is the comparison of the Altman Z-Score and Piotroski Score for Howmet Aerospace Inc. and ATS Corporation:
HWM Scores
- Altman Z-Score: 10.43, indicating a safe zone and low bankruptcy risk.
- Piotroski Score: 9, classified as very strong financial health.
ATS Scores
- Altman Z-Score: 1.68, indicating distress zone and high bankruptcy risk.
- Piotroski Score: 3, classified as very weak financial health.
Which company has the best scores?
Based on the provided data, Howmet Aerospace Inc. has significantly better scores, with a safe zone Altman Z-Score and a very strong Piotroski Score, compared to ATS’s distress zone and very weak Piotroski Score.
Grades Comparison
Here is a comparison of recent and reliable grades for Howmet Aerospace Inc. and ATS Corporation:
Howmet Aerospace Inc. Grades
The table below summarizes recent grades from recognized grading companies for Howmet Aerospace Inc.:
| Grading Company | Action | New Grade | Date |
|---|---|---|---|
| B of A Securities | Maintain | Buy | 2025-11-14 |
| JP Morgan | Maintain | Overweight | 2025-11-10 |
| Goldman Sachs | Maintain | Buy | 2025-11-03 |
| BTIG | Maintain | Buy | 2025-11-03 |
| UBS | Maintain | Neutral | 2025-10-31 |
| RBC Capital | Maintain | Outperform | 2025-10-31 |
| TD Cowen | Maintain | Buy | 2025-10-31 |
| Truist Securities | Maintain | Buy | 2025-10-15 |
| Susquehanna | Maintain | Positive | 2025-10-09 |
| B of A Securities | Maintain | Buy | 2025-08-05 |
The overall trend for Howmet Aerospace shows strong buy-side support with multiple buy and outperform ratings, indicating a generally positive consensus.
ATS Corporation Grades
The table below summarizes recent grades from recognized grading companies for ATS Corporation:
| Grading Company | Action | New Grade | Date |
|---|---|---|---|
| JP Morgan | Maintain | Neutral | 2024-08-13 |
| Goldman Sachs | Maintain | Sell | 2024-08-13 |
| JP Morgan | Maintain | Neutral | 2024-05-24 |
ATS Corporation’s grades reflect a more cautious stance, with neutral and sell ratings suggesting limited upside potential.
Which company has the best grades?
Howmet Aerospace Inc. has received notably better grades, dominated by buy and outperform ratings, compared to ATS Corporation’s neutral and sell consensus. This disparity may influence investor confidence and risk perception between the two stocks.
Strengths and Weaknesses
Below is a comparative overview of key strengths and weaknesses for Howmet Aerospace Inc. (HWM) and ATS Corporation (ATS), based on their latest financial and operational data.
| Criterion | Howmet Aerospace Inc. (HWM) | ATS Corporation (ATS) |
|---|---|---|
| Diversification | Strong product diversification across Engine Products, Fastening Systems, and Structure Systems segments. | Less diversified product portfolio; limited revenue segmentation data. |
| Profitability | High profitability with 15.55% net margin and 25.36% ROE; creates value consistently (ROIC > WACC by 5.86%). | Negative profitability, net margin at -1.11%, ROE at -1.64%; value destroying (ROIC < WACC by -7.91%). |
| Innovation | Demonstrates durable competitive advantage with growing ROIC (+86% trend), indicating effective innovation and operational efficiency. | Declining ROIC (-98%), indicating challenges in maintaining competitive edge and innovation. |
| Global presence | Strong global footprint with broad aerospace industry exposure. | Moderate global presence but weaker financial results suggest limited competitive positioning. |
| Market Share | Solid market share in aerospace components, supported by consistent revenue growth in key segments. | Market share appears limited with declining financial performance and profitability. |
Key takeaway: Howmet Aerospace shows robust strengths in diversification, profitability, and innovation with a durable competitive advantage, making it a more favorable investment. ATS Corporation struggles financially with declining profitability and competitive positioning, indicating higher investment risk.
Risk Analysis
Below is a comparative overview of key risks for Howmet Aerospace Inc. (HWM) and ATS Corporation (ATS) based on the most recent data available in 2026:
| Metric | Howmet Aerospace Inc. (HWM) | ATS Corporation (ATS) |
|---|---|---|
| Market Risk | Beta 1.29, moderate volatility in aerospace sector | Beta 1.27, moderate volatility in automation industry |
| Debt level | Debt-to-Equity 0.76, moderate leverage | Debt-to-Equity 1.00, higher leverage risk |
| Regulatory Risk | Exposure to aerospace and defense regulations globally | Exposure to manufacturing and automation regulations, including Canadian and US standards |
| Operational Risk | Complex global supply chains, manufacturing scale with 23.9K employees | Automation system integration challenges, 7.5K employees, contract manufacturing dependencies |
| Environmental Risk | Moderate, with aerospace manufacturing impact considerations | Moderate, related to automation equipment and energy use |
| Geopolitical Risk | Significant, due to international aerospace markets (US, Europe, Asia) | Moderate, mainly North American exposure with some global clients |
The most likely and impactful risks are market and geopolitical for Howmet Aerospace, given its global aerospace footprint and supply chain complexity. ATS faces higher financial risk due to its debt level and weaker profitability, with operational risks tied to automation system deployments and maintenance. Howmet’s strong Altman Z-Score (10.4, safe zone) contrasts with ATS’s distress zone score (1.68), highlighting ATS’s higher bankruptcy risk. Investors should weigh these factors carefully, prioritizing risk management when considering these industrial stocks.
Which Stock to Choose?
Howmet Aerospace Inc. (HWM) shows a strong income evolution with consistent growth in revenue and net margin, favorable financial ratios including a high return on equity of 25.36%, manageable debt levels, and a very favorable overall rating of B. The company demonstrates a very favorable economic moat with ROIC well above WACC and growing profitability.
ATS Corporation (ATS) presents a mixed picture with an unfavorable income statement marked by negative net margin and declining profitability, slightly unfavorable financial ratios including negative returns and high debt ratios, and a very unfavorable economic moat indicating value destruction. Its overall rating is C, reflecting moderate scores but concerns on profitability and financial stability.
Investors focused on growth and quality might find HWM more appealing due to its favorable rating, robust income growth, and strong economic moat, while those with a tolerance for risk or seeking turnaround opportunities could view ATS as a potential candidate, given its lower valuation ratios but weaker financial and profitability metrics.
Disclaimer: Investment carries a risk of loss of initial capital. The past performance is not a reliable indicator of future results. Be sure to understand risks before making an investment decision.
Go Further
I encourage you to read the complete analyses of Howmet Aerospace Inc. and ATS Corporation to enhance your investment decisions: