In the dynamic industrial machinery sector, Generac Holdings Inc. (GNRC) and ATS Corporation (ATS) stand out as leading innovators with distinct market approaches. Generac focuses on power generation and energy solutions, while ATS specializes in automated manufacturing systems, serving diverse industries worldwide. This comparison explores their strategies, growth potential, and market positioning to help you decide which company may offer the most compelling investment opportunity in 2026.

Table of contents
Companies Overview
I will begin the comparison between Generac Holdings Inc. and ATS Corporation by providing an overview of these two companies and their main differences.
Generac Holdings Inc. Overview
Generac Holdings Inc. focuses on designing, manufacturing, and selling power generation equipment and energy storage systems for residential, commercial, and industrial markets worldwide. The company offers a broad range of products including standby generators, portable generators, outdoor power equipment, and clean energy solutions. Established in 1959 and headquartered in Waukesha, Wisconsin, Generac serves its customers through a diverse distribution network including dealers, retailers, and e-commerce platforms.
ATS Corporation Overview
ATS Corporation delivers automation solutions globally, specializing in planning, designing, building, and servicing automated manufacturing and assembly systems. The company provides comprehensive pre- and post-automation services, engineering design, software solutions, and contract manufacturing across multiple sectors such as life sciences, transportation, and energy. Founded in 1978 and based in Cambridge, Canada, ATS integrates digital factory management systems to optimize machine performance and operational efficiency for sustainable production.
Key similarities and differences
Both Generac and ATS operate within the industrial machinery sector but target different market segments: Generac focuses on power generation and outdoor equipment, while ATS specializes in automation systems and manufacturing services. Each company offers extensive aftersales support and leverages technology to enhance product performance. However, Generac’s product range is more consumer and industrial equipment-oriented, whereas ATS provides complex automation engineering and digital solutions for manufacturing processes.
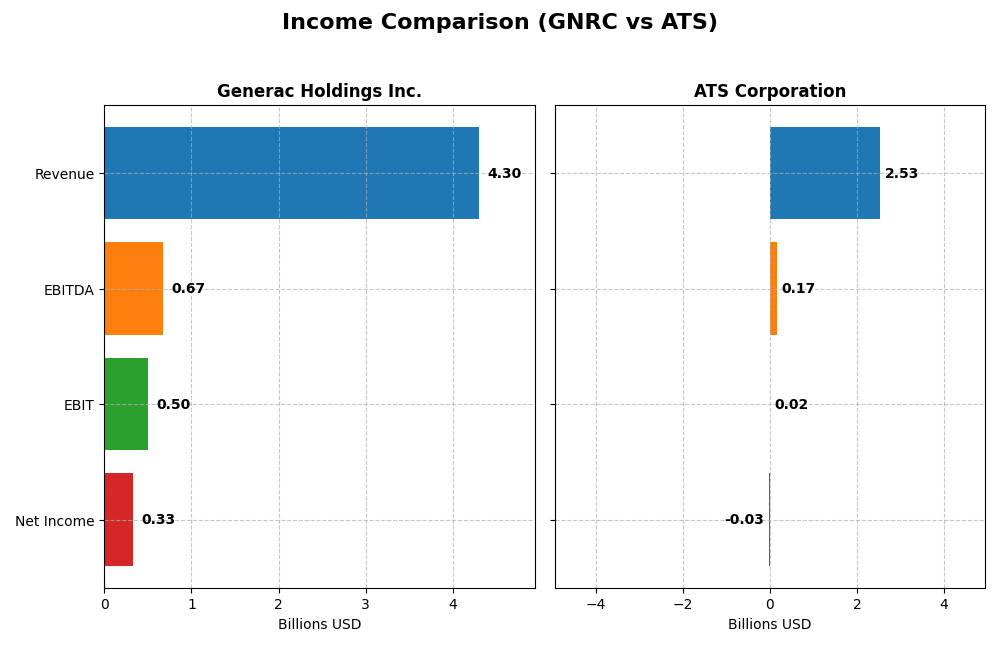
Income Statement Comparison
This table presents a side-by-side comparison of key income statement metrics for Generac Holdings Inc. and ATS Corporation based on their most recent fiscal year data.
| Metric | Generac Holdings Inc. (GNRC) | ATS Corporation (ATS) |
|---|---|---|
| Market Cap | 8.97B USD | 2.82B CAD |
| Revenue | 4.30B USD | 2.53B CAD |
| EBITDA | 671M USD | 168M CAD |
| EBIT | 499M USD | 15.3M CAD |
| Net Income | 325M USD | -28.0M CAD |
| EPS | 5.46 USD | -0.29 CAD |
| Fiscal Year | 2024 | 2025 |
Income Statement Interpretations
Generac Holdings Inc.
Generac’s revenue grew by 72.9% from 2020 to 2024, reaching $4.3B in 2024, while net income declined by 6.9% over the same period to $325M. Margins showed mixed trends, with gross margin at a favorable 38.8% and net margin at 7.6% in 2024. The latest year showed moderate revenue growth of 6.8%, significant margin improvements, and a 50% rise in net margin.
ATS Corporation
ATS reported a 77.2% revenue increase over 2021-2025, hitting CAD 2.5B in 2025, but net income plunged 143.8% to a net loss of CAD 28M. Gross margin remained favorable at 25.5%, but net margin was negative at -1.1%. The latest year saw revenue fall 16.5%, with sharp declines in profitability and a 117% drop in net margin, signaling operational challenges.
Which one has the stronger fundamentals?
Generac displays stronger fundamentals with consistent revenue growth, positive net income, and improved margins, supported by a favorable overall income statement evaluation. ATS, despite solid revenue growth over the period, suffers from a significant net loss and deteriorating margins, resulting in an unfavorable income statement outlook. The contrast favors Generac in terms of profitability and stability.
Financial Ratios Comparison
The table below presents a side-by-side comparison of key financial ratios for Generac Holdings Inc. (GNRC) and ATS Corporation (ATS) based on the most recent full fiscal year data available for each company.
| Ratios | Generac Holdings Inc. (2024) | ATS Corporation (2025) |
|---|---|---|
| ROE | 13.0% | -1.6% |
| ROIC | 9.9% | 0.09% |
| P/E | 28.4 | -125.3 |
| P/B | 3.7 | 2.1 |
| Current Ratio | 1.97 | 1.69 |
| Quick Ratio | 0.97 | 1.41 |
| D/E (Debt-to-Equity) | 0.59 | 1.00 |
| Debt-to-Assets | 28.9% | 36.8% |
| Interest Coverage | 6.0 | 0.09 |
| Asset Turnover | 0.84 | 0.55 |
| Fixed Asset Turnover | 5.0 | 5.7 |
| Payout Ratio | 0.08% | 0% |
| Dividend Yield | 0.003% | 0% |
Interpretation of the Ratios
Generac Holdings Inc.
Generac’s ratios show a balanced profile with favorable current and debt-to-assets ratios, but challenges in valuation metrics like PE and PB, which are unfavorable. The company has a neutral net margin, ROE, and ROIC, with a solid interest coverage ratio. Generac does not pay dividends, reflecting a possible reinvestment strategy or growth focus.
ATS Corporation
ATS exhibits several unfavorable profitability ratios, including negative net margin, ROE, and ROIC, signaling operational difficulties. It benefits from favorable liquidity ratios such as current and quick ratios, but suffers from poor interest coverage. ATS also does not pay dividends, which may be due to its negative earnings and reinvestment priorities.
Which one has the best ratios?
Both companies have an equal proportion of favorable ratios at 28.57%, but ATS has a higher share of unfavorable ratios at 35.71% compared to Generac’s 28.57%. Generac’s neutral overall rating contrasts with ATS’s slightly unfavorable profile, suggesting Generac presents a more balanced financial ratio structure as of their latest fiscal years.
Strategic Positioning
This section compares the strategic positioning of Generac Holdings Inc. and ATS Corporation regarding Market position, Key segments, and disruption:
Generac Holdings Inc.
- Leading power generation equipment maker with significant competitive pressure in industrial machinery.
- Focuses on power generation, energy storage, and outdoor power equipment for residential, commercial, and industrial markets.
- Exposure to technological disruption through clean energy solutions and remote monitoring in power products.
ATS Corporation
- Provides global automation solutions, facing competitive dynamics in industrial machinery.
- Offers automation systems and services across diverse sectors including life sciences, transportation, and energy.
- Faces disruption from digital and software solutions in connected factory floor management.
Generac Holdings Inc. vs ATS Corporation Positioning
Generac holds a diversified product range in power generation and energy storage, while ATS concentrates on automation solutions across multiple industries. Generac’s advantage lies in varied end markets; ATS benefits from specialized automation and digital integration expertise.
Which has the best competitive advantage?
Both companies show very unfavorable MOAT evaluations with declining ROIC and value destruction, indicating neither currently sustains a strong competitive advantage based on invested capital efficiency.
Stock Comparison
The stock prices of Generac Holdings Inc. and ATS Corporation have exhibited contrasting dynamics over the past year, with Generac showing a strong overall gain despite recent setbacks, while ATS experienced a general decline with a recent uptick in buying interest.

Trend Analysis
Generac Holdings Inc. recorded a bullish trend with a 30.27% price increase over the past 12 months, though the trend shows deceleration and a recent short-term decline of 20.41%. Volatility remains high with a standard deviation of 22.61.
ATS Corporation’s stock suffered a bearish trend over the same period, dropping 26.66%, but recently shifted to a mild 6.39% gain with accelerating price movement and low volatility, indicated by a 3.24 standard deviation.
Comparing both, Generac delivered the highest market performance over the full year despite recent weakness, while ATS’s overall decline was partially offset by a recent positive momentum.
Target Prices
Analysts provide a clear consensus on target prices for Generac Holdings Inc. and ATS Corporation.
| Company | Target High | Target Low | Consensus |
|---|---|---|---|
| Generac Holdings Inc. | 248 | 184 | 210 |
| ATS Corporation | 34 | 34 | 34 |
For Generac Holdings Inc., the consensus target price of $210 suggests a significant upside from the current price of $152.78, indicating optimistic analyst expectations. ATS Corporation’s consensus target price of $34 compares favorably to its current $28.80, showing moderate growth potential anticipated by analysts.
Analyst Opinions Comparison
This section compares analysts’ ratings and grades for Generac Holdings Inc. and ATS Corporation:
Rating Comparison
GNRC Rating
- Rating: B, categorized as Very Favorable overall.
- Discounted Cash Flow Score: 3, indicating a moderate valuation perspective.
- ROE Score: 4, showing favorable efficiency in generating profit for equity.
- ROA Score: 4, demonstrating favorable asset utilization.
- Debt To Equity Score: 2, suggesting moderate financial risk exposure.
- Overall Score: 3, reflecting a moderate overall financial standing.
ATS Rating
- Rating: C, also categorized as Very Favorable overall.
- Discounted Cash Flow Score: 3, reflecting a moderate valuation perspective.
- ROE Score: 1, considered very unfavorable for profit generation efficiency.
- ROA Score: 1, indicating very unfavorable asset utilization.
- Debt To Equity Score: 1, reflecting very unfavorable financial risk profile.
- Overall Score: 2, indicating a moderate but lower overall financial standing.
Which one is the best rated?
Based strictly on the provided data, Generac Holdings Inc. (GNRC) is better rated with a B rating and higher scores in ROE, ROA, debt-to-equity, and overall financial standing compared to ATS Corporation (ATS), which holds a C rating and lower scores.
Scores Comparison
Here is a comparison of the Altman Z-Score and Piotroski Score for Generac Holdings Inc. and ATS Corporation:
Generac Holdings Inc. Scores
- Altman Z-Score: 3.73, in the safe zone, low bankruptcy risk
- Piotroski Score: 7, strong financial health
ATS Corporation Scores
- Altman Z-Score: 1.68, in the distress zone, high bankruptcy risk
- Piotroski Score: 3, very weak financial health
Which company has the best scores?
Generac Holdings Inc. has stronger scores with a safe zone Altman Z-Score and a strong Piotroski Score of 7. ATS Corporation’s scores indicate higher financial risk and weaker strength.
Grades Comparison
Here is a comparison of the latest available grades from reputable grading companies for both companies:
Generac Holdings Inc. Grades
This table shows recent grades assigned by well-known financial institutions for Generac Holdings Inc.:
| Grading Company | Action | New Grade | Date |
|---|---|---|---|
| Baird | Upgrade | Outperform | 2026-01-09 |
| Citigroup | Upgrade | Buy | 2026-01-08 |
| B of A Securities | Maintain | Buy | 2026-01-07 |
| Wells Fargo | Upgrade | Overweight | 2025-12-19 |
| JP Morgan | Upgrade | Overweight | 2025-12-08 |
| Citigroup | Maintain | Neutral | 2025-11-03 |
| Barclays | Maintain | Equal Weight | 2025-10-31 |
| UBS | Maintain | Buy | 2025-10-30 |
| Canaccord Genuity | Maintain | Buy | 2025-10-30 |
| Citigroup | Maintain | Neutral | 2025-10-21 |
Generac Holdings has mostly received upgrades or maintained positive ratings recently, reflecting a generally optimistic outlook among analysts.
ATS Corporation Grades
This table displays recent grades assigned by recognized financial institutions for ATS Corporation:
| Grading Company | Action | New Grade | Date |
|---|---|---|---|
| JP Morgan | Maintain | Neutral | 2024-08-13 |
| Goldman Sachs | Maintain | Sell | 2024-08-13 |
| JP Morgan | Maintain | Neutral | 2024-05-24 |
ATS Corporation’s grades have been stable or negative, with no upgrades noted and a sell rating maintained by Goldman Sachs.
Which company has the best grades?
Generac Holdings Inc. has received consistently better grades, including multiple upgrades to buy and outperform ratings, while ATS Corporation’s grades remain neutral or sell. This difference may influence investors’ confidence and portfolio positioning due to the more positive analyst sentiment toward Generac.
Strengths and Weaknesses
Below is a comparative analysis of Generac Holdings Inc. (GNRC) and ATS Corporation (ATS) based on their diversification, profitability, innovation, global presence, and market share.
| Criterion | Generac Holdings Inc. (GNRC) | ATS Corporation (ATS) |
|---|---|---|
| Diversification | Limited product diversification, focused on power solutions | Moderate diversification in automation and manufacturing solutions |
| Profitability | Neutral profitability with ROIC at 9.89%, but WACC higher at 11.3%, indicating value destruction | Unfavorable profitability with near-zero ROIC (0.09%) and negative margins |
| Innovation | Moderate innovation capacity, stable asset turnover and fixed asset turnover favorable | Innovation constrained by declining profitability, though fixed asset turnover is favorable |
| Global presence | Strong presence in North America, limited global expansion | Moderate global footprint with somewhat balanced asset utilization |
| Market Share | Solid market share in backup power systems, but facing competitive pressures | Smaller market share with challenges in maintaining profitability |
Key takeaway: Both companies are currently facing challenges in value creation, with GNRC showing neutral operational efficiency but unable to generate excess returns, and ATS struggling with declining profitability and value destruction. Caution is advised when considering investments, with attention to future improvements in profitability and innovation.
Risk Analysis
Below is a comparison of key risks for Generac Holdings Inc. (GNRC) and ATS Corporation (ATS) based on the most recent data available in 2026:
| Metric | Generac Holdings Inc. (GNRC) | ATS Corporation (ATS) |
|---|---|---|
| Market Risk | High beta at 1.83 indicates above-average volatility | Moderate beta at 1.27 suggests moderate volatility |
| Debt Level | Moderate debt-to-equity ratio of 0.59 (favorable) | High debt-to-equity ratio of 1.0 (neutral) with low interest coverage |
| Regulatory Risk | Moderate, typical for US industrial sector | Moderate, with exposure to Canadian and global regulations |
| Operational Risk | Diversified product range with stable operations | Complexity in automation services and contract manufacturing adds risk |
| Environmental Risk | Exposure to environmental regulations due to manufacturing | Similar exposure, with potential risks from energy and industrial segments |
| Geopolitical Risk | Primarily US-based with some global exposure | Canadian base with global customers, moderate geopolitical sensitivity |
The most likely and impactful risks for these companies stem from financial leverage and operational challenges. ATS shows higher financial strain with a debt-to-equity of 1.0 and very low interest coverage of 0.16, placing it in a distress zone for bankruptcy risk. Generac’s higher market volatility and unfavorable valuation ratios pose a risk, but it maintains a safer financial position overall. Investors should monitor ATS’s financial health closely due to its weak profitability and solvency scores.
Which Stock to Choose?
Generac Holdings Inc. (GNRC) shows a favorable income statement with improving profitability metrics, including a 7.57% net margin and 13.04% ROE, though its WACC at 11.3% and valuation ratios like P/E and P/B are unfavorable. Its debt levels are moderate, with a net debt to EBITDA of 1.78 and a current ratio near 2, reflecting reasonable liquidity. The company holds a very favorable overall rating of B but faces a very unfavorable MOAT due to declining ROIC below WACC, indicating value destruction.
ATS Corporation (ATS) presents an unfavorable income profile marked by a -1.11% net margin and negative ROE, alongside a very unfavorable MOAT with a steeply declining ROIC far below WACC, signaling significant value erosion. Financial ratios paint a slightly unfavorable picture with high debt (net debt to EBITDA near 8.8) and weak interest coverage. Its overall rating is C, reflecting moderate scores but poor profitability and financial stability.
Investors seeking growth and more stable profitability might find GNRC’s favorable income trends and stronger rating more aligned with their profile, despite its value destruction signals. Conversely, those with higher risk tolerance or value-oriented strategies might interpret ATS’s lower valuation multiples and recent price trend uptick as potential opportunities, acknowledging its financial challenges and unfavorable moat.
Disclaimer: Investment carries a risk of loss of initial capital. The past performance is not a reliable indicator of future results. Be sure to understand risks before making an investment decision.
Go Further
I encourage you to read the complete analyses of Generac Holdings Inc. and ATS Corporation to enhance your investment decisions: