Emerson Electric Co. (EMR) and ATS Corporation (ATS) are prominent players in the industrial machinery sector, delivering advanced automation and engineering solutions worldwide. While Emerson boasts a broad portfolio spanning multiple industries, ATS specializes in tailored automation systems and digital factory innovations. Comparing these companies reveals insights into their market positions and innovation strategies. Join me as we evaluate which stock offers the most compelling investment opportunity in 2026.
Table of contents
Companies Overview
I will begin the comparison between Emerson Electric Co. and ATS Corporation by providing an overview of these two companies and their main differences.
Emerson Electric Co. Overview
Emerson Electric Co. is a technology and engineering company offering solutions across industrial, commercial, and residential markets worldwide. Operating through Automation Solutions and Commercial & Residential Solutions segments, Emerson serves diverse industries such as oil and gas, food and beverage, and municipal water supplies. Headquartered in Saint Louis, Missouri, it employs 73,000 people and has a market capitalization of 81B USD.
ATS Corporation Overview
ATS Corporation specializes in automation solutions, providing design, commissioning, and servicing of automated manufacturing systems globally. It offers services from pre-automation consulting to post-installation support, serving markets like life sciences, transportation, and energy. Based in Cambridge, Canada, ATS employs 7,500 staff and has a market capitalization of 2.8B USD, focusing on integrated software and digital factory management systems.
Key similarities and differences
Both Emerson and ATS operate in the industrial machinery sector with a focus on automation solutions. Emerson has a broader market presence with diversified segments including residential and commercial solutions, while ATS concentrates on end-to-end automation system integration and digital factory solutions. Emerson’s scale and employee base are significantly larger, reflecting a more extensive global footprint relative to ATS’s specialized service offerings.
Income Statement Comparison
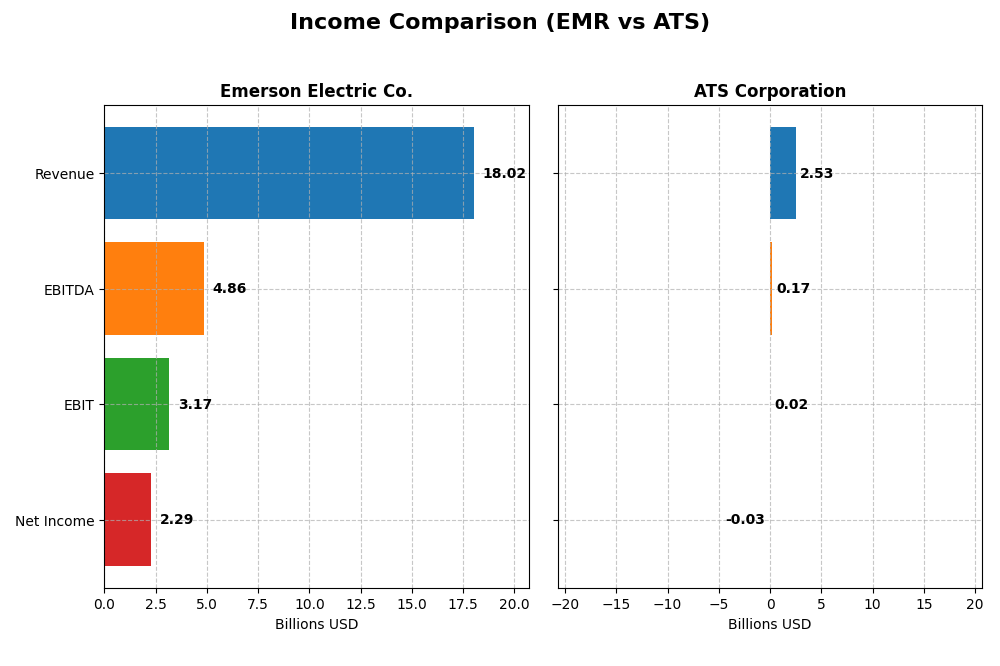
The following table compares the key income statement metrics of Emerson Electric Co. and ATS Corporation for their most recent fiscal years.
| Metric | Emerson Electric Co. (EMR) | ATS Corporation (ATS) |
|---|---|---|
| Market Cap | 81.0B | 2.8B |
| Revenue | 18.0B | 2.53B (CAD) |
| EBITDA | 4.86B | 168M (CAD) |
| EBIT | 3.17B | 15.3M (CAD) |
| Net Income | 2.29B | -28.0M (CAD) |
| EPS | 4.06 | -0.29 |
| Fiscal Year | 2025 | 2025 |
Income Statement Interpretations
Emerson Electric Co.
Emerson Electric Co. showed a 39.31% revenue increase from 2021 to 2025, with a slight net income decline of 0.43%. Margins remain strong, with a gross margin of 52.84% and a net margin of 12.73%, both favorable. The most recent year saw revenue growth slow to 3.0%, but earnings per share rose 17.83%, reflecting improved profitability and margin expansion.
ATS Corporation
ATS Corporation experienced a 77.15% revenue growth over 2021-2025, but net income and margins deteriorated significantly, with a net margin at -1.11%. The latest fiscal year saw a 16.47% revenue decline and a sharp 95.18% drop in EBIT, causing EPS to fall by 114.72%. Margins remain under pressure, reflecting operational challenges despite past top-line gains.
Which one has the stronger fundamentals?
Emerson Electric Co. exhibits stronger fundamentals with consistently favorable margin profiles and a positive earnings trajectory, supported by solid revenue growth. Conversely, ATS Corporation, despite robust revenue expansion over five years, faces considerable profitability and margin setbacks, with a notable net loss in the latest year. This contrast highlights Emerson’s more stable income statement performance.
Financial Ratios Comparison
The table below compares key financial ratios for Emerson Electric Co. (EMR) and ATS Corporation (ATS) for their most recent fiscal years, highlighting differences in profitability, liquidity, leverage, and efficiency metrics.
| Ratios | Emerson Electric Co. (2025) | ATS Corporation (2025) |
|---|---|---|
| ROE | 11.30% | -1.64% |
| ROIC | 4.62% | 0.09% |
| P/E | 32.42 | -125.28 |
| P/B | 3.66 | 2.06 |
| Current Ratio | 0.88 | 1.69 |
| Quick Ratio | 0.65 | 1.41 |
| D/E (Debt-to-Equity) | 0.65 | 1.00 |
| Debt-to-Assets | 31.3% | 36.8% |
| Interest Coverage | 9.44 | 0.09 |
| Asset Turnover | 0.43 | 0.55 |
| Fixed Asset Turnover | 6.28 | 5.66 |
| Payout Ratio | 52.0% | 0% |
| Dividend Yield | 1.60% | 0% |
Interpretation of the Ratios
Emerson Electric Co.
Emerson Electric Co. shows a mixed ratio profile with favorable net margin (12.73%) and interest coverage (13.38) but weak liquidity, reflected in a low current ratio (0.88) and quick ratio (0.65). Return on equity is neutral (11.3%), while return on invested capital is below expectations (4.62%). The company pays dividends, with a 1.6% yield, supported moderately by free cash flow, but valuation multiples like P/E (32.42) and P/B (3.66) appear stretched, posing potential risks.
ATS Corporation
ATS Corporation’s ratios reveal challenges, including negative net margin (-1.11%) and return on equity (-1.64%), alongside weak interest coverage (0.16). Liquidity ratios are strong with a current ratio of 1.69 and quick ratio of 1.41. The company does not pay dividends, likely due to negative profitability and a reinvestment strategy focused on growth and operations. Asset turnover is neutral, while fixed asset turnover is favorable, indicating efficient asset use despite overall profitability concerns.
Which one has the best ratios?
Both Emerson Electric Co. and ATS Corporation exhibit slightly unfavorable global ratio profiles. Emerson has stronger profitability and dividend returns but weaker liquidity and valuation concerns. ATS benefits from better liquidity and asset efficiency but suffers from negative profitability and poor interest coverage. The choice depends on investor priorities between profitability with dividends or liquidity with growth focus.
Strategic Positioning
This section compares the strategic positioning of Emerson Electric Co. and ATS Corporation, covering market position, key segments, and exposure to technological disruption:
Emerson Electric Co.
- Large market cap of 81B USD with diversified industrial machinery presence and moderate competitive pressure
- Operates through Automation Solutions and Commercial & Residential Solutions, serving multiple industries
- Exposure includes advanced industrial automation and software control, impacting traditional and emerging tech
ATS Corporation
- Smaller market cap of 2.8B USD focused on automation solutions, facing competitive pressures in niche markets
- Provides automation manufacturing, engineering, and digital solutions across life sciences, mobility, and energy
- Focus on automation and connected factory floor management systems, integrating real-time data and digital solutions
Emerson Electric Co. vs ATS Corporation Positioning
Emerson’s approach is diversified across multiple industrial and residential segments, offering broad market reach but facing complex management. ATS is more concentrated on automation and digital solutions, enabling specialized service but with narrower market scope and smaller scale.
Which has the best competitive advantage?
Both companies show very unfavorable MOAT evaluations with declining ROIC trends, indicating value destruction and weakening competitive advantages in their respective industries.
Stock Comparison
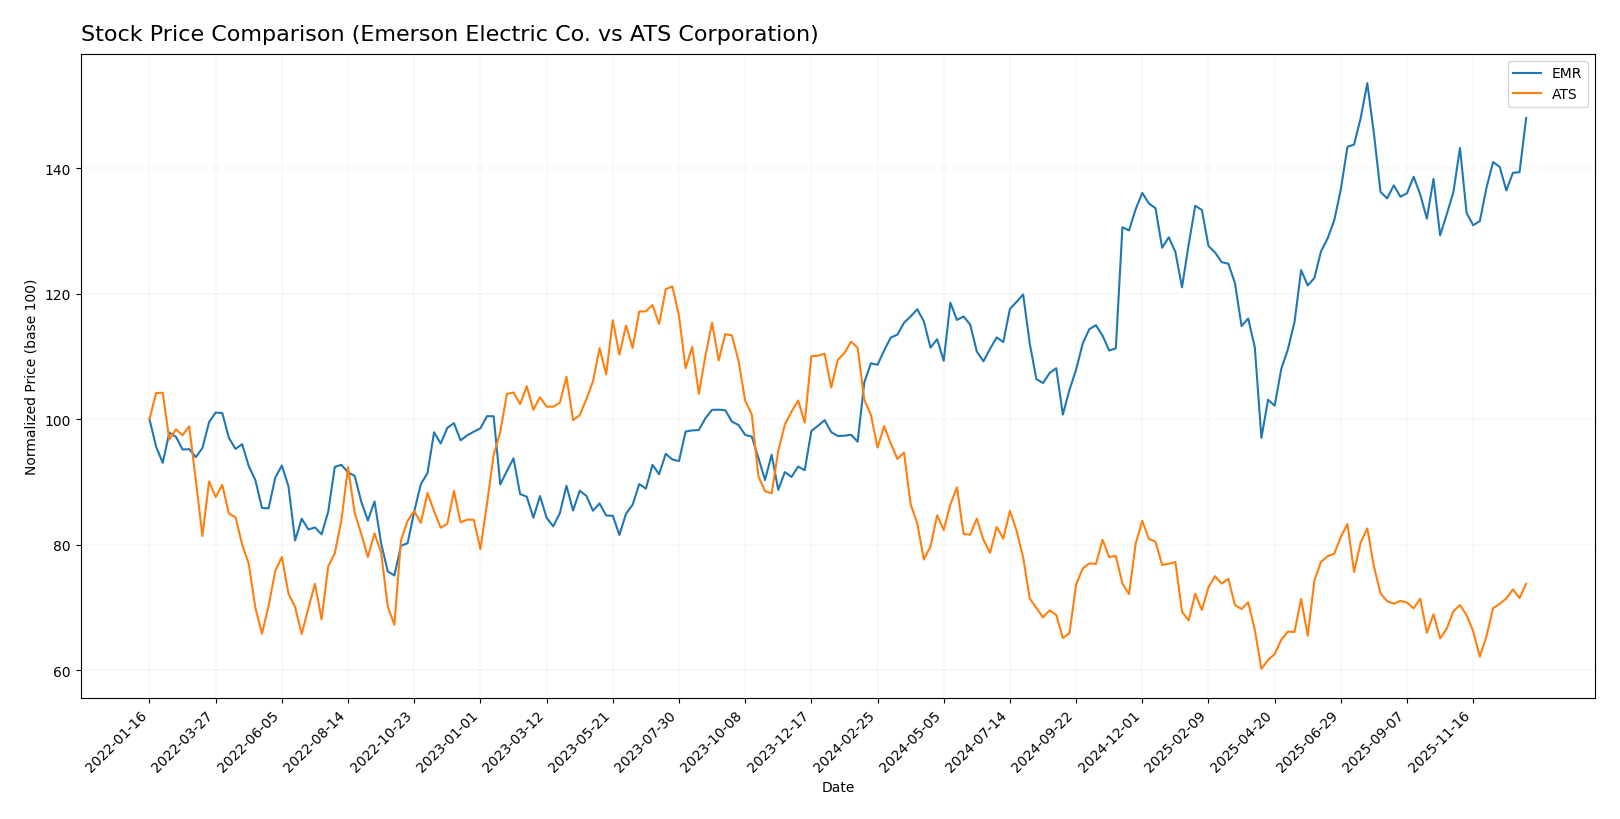
The stock price movements of Emerson Electric Co. (EMR) and ATS Corporation (ATS) over the past year reveal contrasting dynamics, with EMR showing a robust upward trajectory while ATS experiences a marked decline, both exhibiting recent signs of positive momentum.
Trend Analysis
Emerson Electric Co. (EMR) posted a strong bullish trend over the past 12 months with a 35.86% price increase, showing acceleration and notable volatility (std deviation 12.39), reaching a high of 149.63 and a low of 94.57.
ATS Corporation (ATS) faced a bearish trend over the same period, with a 26.71% price decrease, also accelerating but with lower volatility (std deviation 3.24), hitting a high of 39.27 and a low of 23.5.
Comparing these trends, EMR delivered the highest market performance with a substantial positive return, while ATS underperformed despite recent modest gains.
Target Prices
The current analyst consensus for target prices reflects moderate upside potential for both Emerson Electric Co. and ATS Corporation.
| Company | Target High | Target Low | Consensus |
|---|---|---|---|
| Emerson Electric Co. | 170 | 125 | 149.67 |
| ATS Corporation | 34 | 34 | 34 |
Emerson Electric’s target consensus at 149.67 is slightly above its current price of 144.22, indicating cautious optimism. ATS Corporation’s fixed target at 34 suggests expectations of a moderate price increase from the current 28.78.
Analyst Opinions Comparison
This section compares analysts’ ratings and grades for Emerson Electric Co. and ATS Corporation:
Rating Comparison
EMR Rating
- Rating: B, considered Very Favorable by analysts.
- Discounted Cash Flow Score: 3, moderate rating.
- ROE Score: 3, moderate efficiency in profit generation.
- ROA Score: 4, favorable asset utilization.
- Debt To Equity Score: 2, moderate financial risk.
- Overall Score: 3, moderate financial standing.
ATS Rating
- Rating: C, also considered Very Favorable.
- Discounted Cash Flow Score: 3, moderate rating.
- ROE Score: 1, very unfavorable efficiency.
- ROA Score: 1, very unfavorable asset utilization.
- Debt To Equity Score: 1, very unfavorable risk.
- Overall Score: 2, moderate financial standing.
Which one is the best rated?
Based strictly on the provided data, Emerson Electric Co. holds a higher overall rating (B vs. C) and scores better across ROE, ROA, and debt-to-equity metrics, indicating stronger financial health and efficiency compared to ATS Corporation.
Scores Comparison
Here is a comparison of the Altman Z-Score and Piotroski Score for Emerson Electric Co. (EMR) and ATS Corporation (ATS):
EMR Scores
- Altman Z-Score: 2.68, in the grey zone indicating moderate bankruptcy risk.
- Piotroski Score: 7, classified as strong financial health.
ATS Scores
- Altman Z-Score: 1.68, in the distress zone indicating high bankruptcy risk.
- Piotroski Score: 3, classified as very weak financial health.
Which company has the best scores?
Based strictly on the provided data, EMR shows stronger financial health with a grey zone Altman Z-Score and a strong Piotroski Score. ATS is in the distress zone with a very weak Piotroski Score, indicating higher financial risk.
Grades Comparison
Here is the grades comparison of Emerson Electric Co. and ATS Corporation from reliable sources:
Emerson Electric Co. Grades
The following table summarizes recent grades assigned to Emerson Electric Co. by reputable financial institutions:
| Grading Company | Action | New Grade | Date |
|---|---|---|---|
| Wells Fargo | Maintain | Equal Weight | 2026-01-07 |
| Barclays | Maintain | Equal Weight | 2026-01-07 |
| UBS | Upgrade | Buy | 2026-01-05 |
| Jefferies | Downgrade | Hold | 2025-12-10 |
| JP Morgan | Maintain | Neutral | 2025-11-10 |
| RBC Capital | Maintain | Outperform | 2025-11-06 |
| Barclays | Maintain | Equal Weight | 2025-11-06 |
| RBC Capital | Maintain | Outperform | 2025-10-16 |
| JP Morgan | Maintain | Neutral | 2025-10-15 |
| Wells Fargo | Downgrade | Equal Weight | 2025-10-06 |
Emerson Electric Co.’s grades show a mixed but generally positive trend, with several firms maintaining or upgrading to Buy or Outperform ratings.
ATS Corporation Grades
The following table summarizes recent grades assigned to ATS Corporation by reputable financial institutions:
| Grading Company | Action | New Grade | Date |
|---|---|---|---|
| JP Morgan | Maintain | Neutral | 2024-08-13 |
| Goldman Sachs | Maintain | Sell | 2024-08-13 |
| JP Morgan | Maintain | Neutral | 2024-05-24 |
ATS Corporation’s grades are limited and reflect a more cautious stance, with Neutral and Sell ratings predominating.
Which company has the best grades?
Emerson Electric Co. has received stronger and more numerous positive grades compared to ATS Corporation’s neutral to negative ratings. This disparity may influence investors by suggesting Emerson has broader analyst support and potentially lower perceived risk.
Strengths and Weaknesses
Below is a comparison table highlighting the key strengths and weaknesses of Emerson Electric Co. (EMR) and ATS Corporation (ATS) based on the most recent financial and operational data.
| Criterion | Emerson Electric Co. (EMR) | ATS Corporation (ATS) |
|---|---|---|
| Diversification | High – diverse segments including Intelligent Devices ($12.4B) and Software & Control ($5.7B) | Moderate – narrower product range, less segment data available |
| Profitability | Moderate – net margin 12.73%, ROE 11.3%, but ROIC unfavorable (4.62%) | Weak – negative net margin (-1.11%) and ROE (-1.64%), ROIC near zero (0.09%) |
| Innovation | Strong – steady growth in Automation Solutions and Software segments | Limited data; innovation impact unclear with declining profitability |
| Global presence | Strong – global operations with established market positions | Moderate – less global footprint compared to EMR |
| Market Share | Solid in automation and control markets, though facing value erosion | Smaller player, struggling to maintain market position |
Key takeaways: Emerson Electric demonstrates solid diversification and decent profitability despite some value erosion, while ATS Corporation faces profitability challenges and a shrinking economic moat. Investors should approach both cautiously, favoring EMR’s broader base but monitoring its declining ROIC trend.
Risk Analysis
The table below summarizes key risks for Emerson Electric Co. and ATS Corporation based on their latest financial and operational data from 2025-2026.
| Metric | Emerson Electric Co. (EMR) | ATS Corporation (ATS) |
|---|---|---|
| Market Risk | Moderate (Beta 1.25) | Moderate (Beta 1.27) |
| Debt Level | Moderate (D/E 0.65) | High (D/E 1.0) |
| Regulatory Risk | Moderate | Moderate |
| Operational Risk | Moderate | Moderate |
| Environmental Risk | Moderate | Moderate |
| Geopolitical Risk | Moderate (US-based global operations) | Moderate (Canada-based, global exposure) |
Emerson shows a moderate market risk and manageable debt, but its liquidity ratios are weak, warranting caution. ATS carries higher financial risk with a debt-to-equity ratio at 1.0 and poor profitability, reflected in its distress zone Altman Z-score. The most impactful risk for ATS is financial distress, while Emerson’s main concern lies in operational efficiency and valuation pressures.
Which Stock to Choose?
Emerson Electric Co. (EMR) shows favorable income statement metrics with a 12.73% net margin and improving EBIT growth (+35.34% YoY), yet its ROIC is below WACC, signaling value destruction. Financial ratios are mixed with some unfavorable liquidity metrics and a moderate rating of B.
ATS Corporation (ATS) presents an unfavorable income trend with a negative net margin (-1.11%) and declining profitability. Its financial ratios reveal weaknesses in returns and interest coverage, despite favorable liquidity ratios and a rating of C, indicating financial challenges and value erosion.
Investors prioritizing income statement strength and moderate financial stability might find EMR’s profile more aligned with their goals, while those valuing liquidity and potential turnaround scenarios might consider ATS. Both companies display very unfavorable economic moats with declining ROIC trends, suggesting cautious interpretation of growth prospects.
Disclaimer: Investment carries a risk of loss of initial capital. The past performance is not a reliable indicator of future results. Be sure to understand risks before making an investment decision.
Go Further
I encourage you to read the complete analyses of Emerson Electric Co. and ATS Corporation to enhance your investment decisions: