Home > Comparison > Industrials > ETN vs ATS
The strategic rivalry between Eaton Corporation plc and ATS Corporation shapes the industrial machinery sector’s evolution. Eaton operates as a diversified power management giant with extensive global reach. ATS specializes in automated manufacturing systems, emphasizing precision and digital integration. This head-to-head contrasts broad industrial scale against focused automation innovation. The analysis aims to identify which company’s strategy delivers superior risk-adjusted returns for diversified portfolios in today’s complex industrial landscape.
Table of contents
Companies Overview
Eaton Corporation plc and ATS Corporation both drive innovation in industrial machinery but occupy distinct niches in the global market.
Eaton Corporation plc: Power Management Leader
Eaton dominates the power management sector worldwide. It generates revenue through electrical components, aerospace systems, vehicle transmissions, and eMobility solutions. In 2026, Eaton focuses strategically on expanding its eMobility segment and enhancing power quality products, reflecting growing demand for sustainable and efficient energy solutions.
ATS Corporation: Automation Solutions Specialist
ATS leads in automation solutions for manufacturing and assembly systems globally. It earns from designing, building, and servicing automated machinery, alongside software for real-time performance analytics. In 2026, ATS emphasizes digital factory integration and process optimization to boost operational efficiency across diverse sectors like life sciences and electronics.
Strategic Collision: Similarities & Divergences
Eaton operates with a broad, diversified industrial approach, while ATS pursues specialized automation with deep digital integration. Their primary battleground is industrial efficiency—Eaton through power and mobility innovation, ATS via automation and software. Eaton offers scale and diversification; ATS provides niche focus and tech-driven growth, defining divergent investment profiles rooted in different competitive moats.
Income Statement Comparison
This data dissects the core profitability and scalability of both corporate engines to reveal who dominates the bottom line:
| Metric | Eaton Corporation plc (ETN) | ATS Corporation (ATS) |
|---|---|---|
| Revenue | 27.4B | 2.53B |
| Cost of Revenue | 17.1B | 1.89B |
| Operating Expenses | 5.08B | 637M |
| Gross Profit | 10.3B | 647M |
| EBITDA | 5.9B | 168M |
| EBIT | 5.15B | 15.3M |
| Interest Expense | 264M | 98.2M |
| Net Income | 4.09B | -28.0M |
| EPS | 10.49 | -0.29 |
| Fiscal Year | 2025 | 2025 |
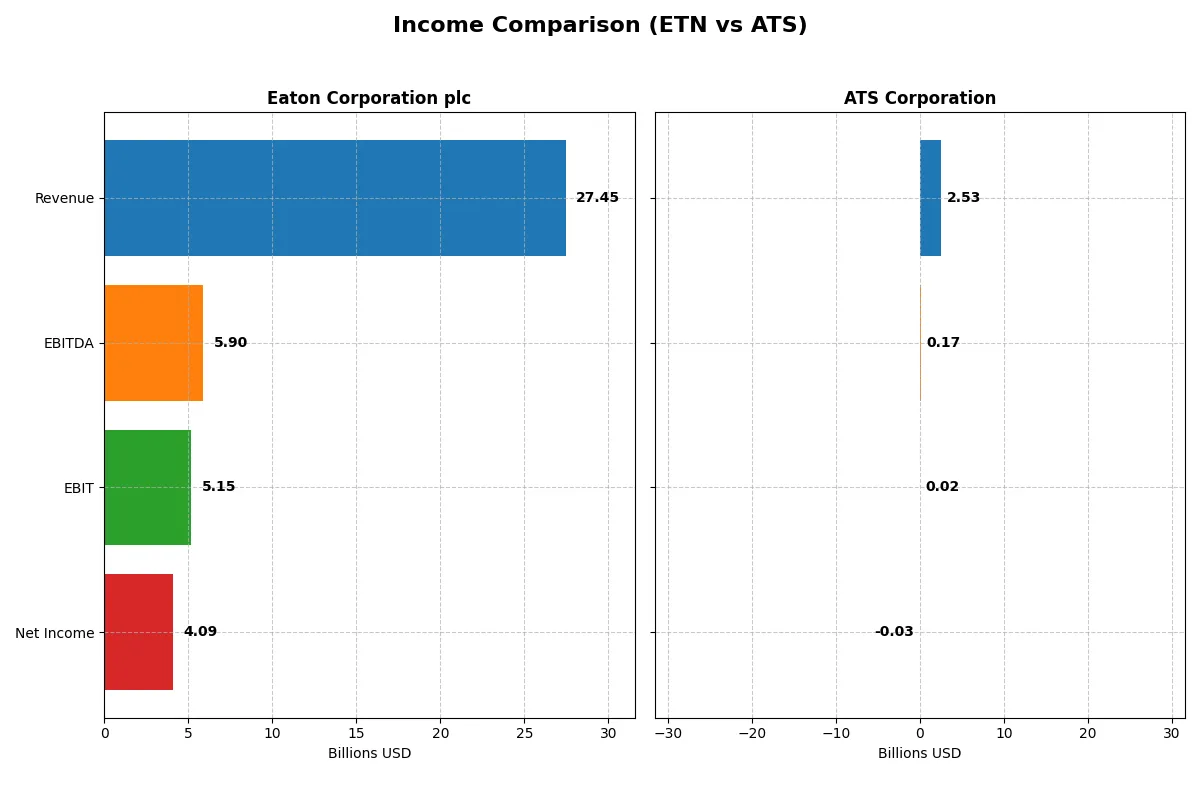
Income Statement Analysis: The Bottom-Line Duel
This income statement comparison reveals the true efficiency and profit-generating power of Eaton Corporation plc and ATS Corporation.
Eaton Corporation plc Analysis
Eaton’s revenue climbed steadily from 19.6B in 2021 to 27.4B in 2025, reflecting robust growth. Net income surged 90%, hitting 4.1B in 2025. Gross margin remains strong at 37.6%, while net margin holds near 15%, signaling operational discipline. The latest year shows solid momentum with a 10.3% revenue increase and improved EBIT margin of 18.8%.
ATS Corporation Analysis
ATS’s revenue peaked at 3.0B in 2024 but declined 16.5% to 2.5B in 2025. Net income turned negative, falling to -28M in 2025 from 194M in 2024. Gross margin slipped to 25.5%, and net margin dropped below zero, reflecting profitability challenges. The latest year highlights deteriorating operational efficiency, with EBIT margin barely above zero at 0.6%.
Margin Strength vs. Profitability Challenges
Eaton demonstrates clear fundamental superiority with consistent revenue growth, expanding margins, and strong net income gains. ATS struggles with declining revenue, shrinking margins, and net losses, undermining its financial stability. Eaton’s profile appeals more to investors seeking durable profitability and efficient capital allocation.
Financial Ratios Comparison
These vital ratios act as a diagnostic tool to expose underlying fiscal health, valuation premiums, and capital efficiency for Eaton Corporation plc and ATS Corporation:
| Ratios | Eaton Corporation plc (ETN) | ATS Corporation (ATS) |
|---|---|---|
| ROE | 21.1% | -1.6% |
| ROIC | 13.1% | 0.09% |
| P/E | 30.2 | -125.3 |
| P/B | 6.37 | 2.06 |
| Current Ratio | 1.32 | 1.69 |
| Quick Ratio | 0.81 | 1.41 |
| D/E | 0.54 | 1.00 |
| Debt-to-Assets | 25.5% | 36.8% |
| Interest Coverage | 19.8 | 0.09 |
| Asset Turnover | 0.67 | 0.55 |
| Fixed Asset Turnover | 5.40 | 5.66 |
| Payout Ratio | 39.5% | 0% |
| Dividend Yield | 1.31% | 0% |
| Fiscal Year | 2025 | 2025 |
Efficiency & Valuation Duel: The Vital Signs
Ratios act as the company’s DNA, revealing hidden risks and operational excellence that shape investment decisions and long-term value creation.
Eaton Corporation plc
Eaton delivers strong profitability with a 21% ROE and a 14.9% net margin, reflecting operational efficiency above sector norms. Its valuation appears stretched, with a P/E of 30.24 and P/B of 6.37, signaling high investor expectations. Eaton returns value through a 1.31% dividend yield, balancing shareholder income with reinvestment in R&D.
ATS Corporation
ATS struggles with negative profitability, posting a -1.64% ROE and a -1.11% net margin, highlighting operational challenges. Despite a favorable P/E ratio driven by losses, its valuation lacks strength. ATS offers no dividend and shows weak interest coverage, signaling elevated financial risk. Its capital allocation focuses on liquidity and sustaining operations rather than growth.
Premium Valuation vs. Operational Safety
Eaton’s superior profitability and consistent dividends contrast ATS’s financial distress and lack of returns. Eaton offers a better risk-reward balance with operational strength and shareholder income. ATS’s profile suits investors with high risk tolerance seeking turnaround potential rather than stable returns.
Which one offers the Superior Shareholder Reward?
I compare Eaton Corporation plc (ETN) and ATS Corporation (ATS) on dividends, buybacks, and distribution sustainability in 2026. ETN yields ~1.3% with a ~39% payout ratio, balancing steady dividends and robust buybacks. ATS pays no dividend, reinvesting heavily in growth but shows negative free cash flow and weak operating margins. ETN’s disciplined capital allocation and consistent shareholder returns make it the superior choice for total return investors seeking both income and capital appreciation in 2026.
Comparative Score Analysis: The Strategic Profile
The radar chart reveals the fundamental DNA and trade-offs of both firms, highlighting their financial strengths and vulnerabilities across key metrics:
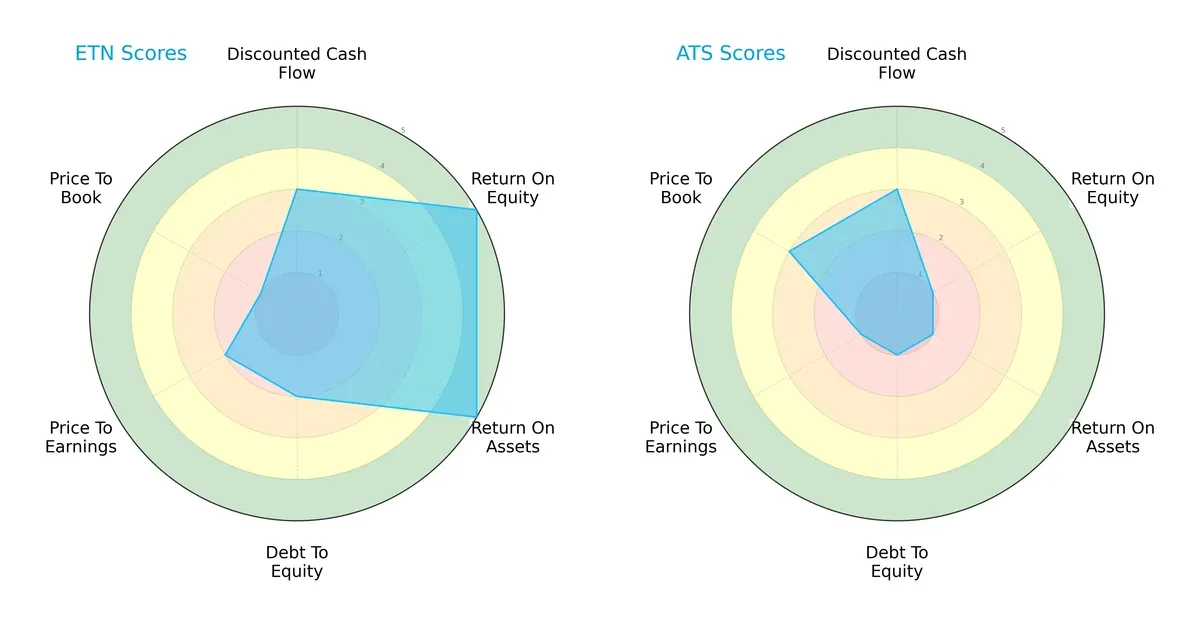
Eaton Corporation plc (ETN) shows a balanced profile with very favorable returns on equity (5) and assets (5), but carries moderate debt risk (2) and valuation concerns (P/E 2, P/B 1). ATS Corporation (ATS) relies mainly on moderate discounted cash flow (3) but scores very low in profitability (ROE 1, ROA 1) and financial leverage (debt/equity 1), signaling structural weaknesses. ETN’s diversified strengths provide a more stable platform, while ATS depends on limited valuation advantages.
Bankruptcy Risk: Solvency Showdown
The Altman Z-Score comparison underscores a stark solvency divide between the two firms:
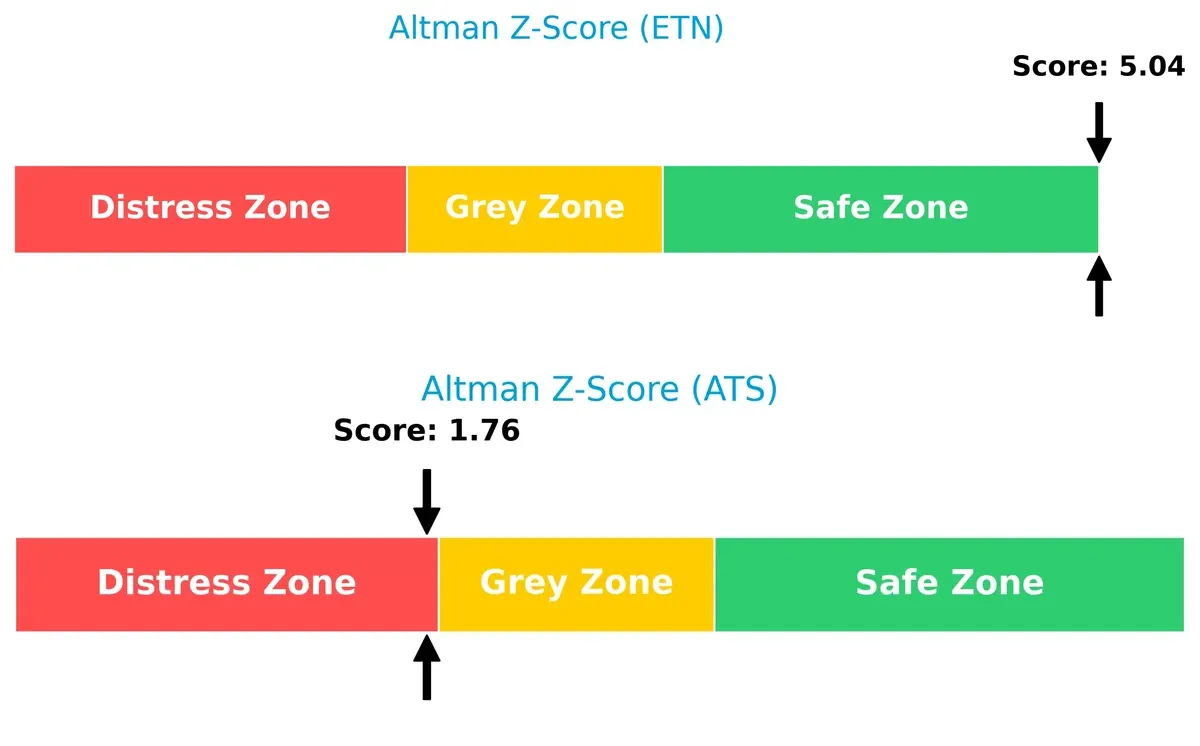
ETN scores 5.04, placing it firmly in the safe zone, indicative of strong long-term survival prospects amid economic cycles. ATS lags at 1.76, in the distress zone, signaling high bankruptcy risk if adverse conditions persist. This gap reflects ETN’s superior financial resilience and prudent capital structure.
Financial Health: Quality of Operations
Examining the Piotroski F-Score reveals insights into operational quality and financial robustness:
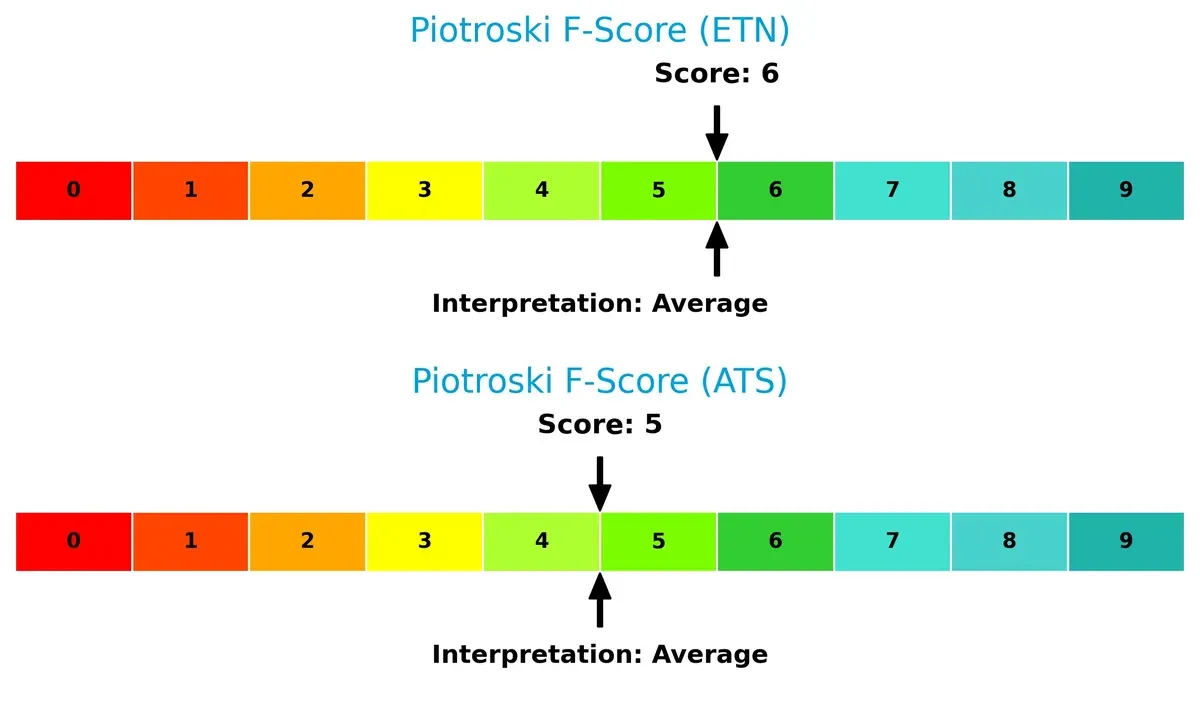
ETN’s score of 6 suggests solid internal metrics and decent financial health, while ATS at 5 indicates borderline average performance with potential red flags. Neither company achieves peak strength, but ETN’s marginally better score supports more confidence in its earnings quality and balance sheet management.
How are the two companies positioned?
This section dissects Eaton and ATS’s operational DNA by comparing revenue distribution and internal strengths and weaknesses. The goal is to confront their economic moats to identify which model offers the most resilient competitive advantage today.
Revenue Segmentation: The Strategic Mix
This visual comparison dissects how Eaton Corporation plc and ATS Corporation diversify their income streams and where their primary sector bets lie:
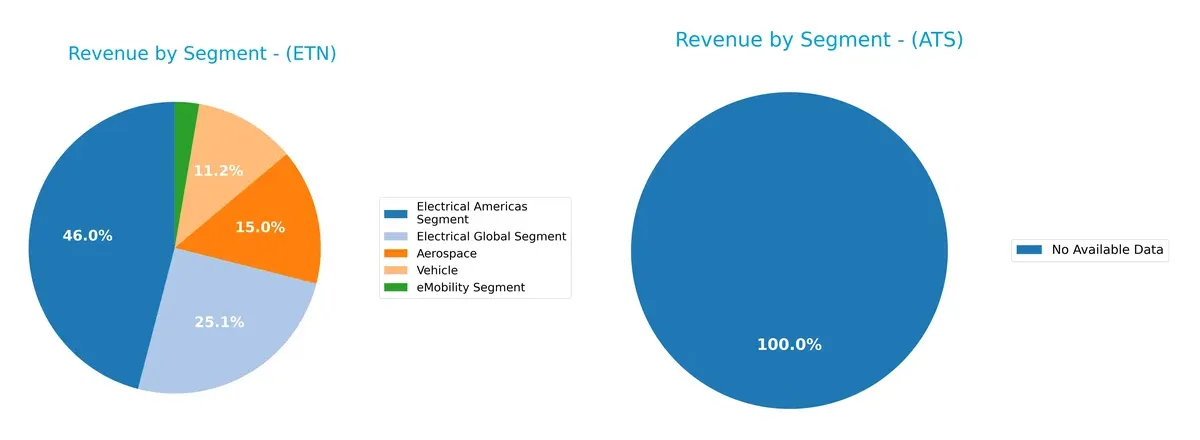
Eaton Corporation plc shows a broad revenue base, anchored by Electrical Americas at $11.4B and Electrical Global at $6.2B in 2024. Aerospace and Vehicle segments add $3.7B and $2.8B respectively, reflecting a well-spread portfolio. ATS Corporation lacks available data, so I cannot assess its diversification or concentration risks. Eaton’s mix reduces dependence on a single segment, signaling strategic resilience through infrastructure dominance.
Strengths and Weaknesses Comparison
This table compares the Strengths and Weaknesses of Eaton Corporation plc and ATS Corporation:
Eaton Corporation plc Strengths
- Diverse product segments including Aerospace, Electrical Americas, and eMobility
- Strong profitability with 14.9% net margin and 21.05% ROE
- Favorable debt-to-assets ratio at 25.53%
- Significant global presence with large US and Europe revenues
- High fixed asset turnover at 5.4
ATS Corporation Strengths
- Favorable price-to-earnings ratio despite losses
- Strong liquidity with current ratio 1.69 and quick ratio 1.41
- Favorable fixed asset turnover at 5.66
- Presence in key markets including US and Europe
- Neutral price-to-book ratio reflects moderate valuation
Eaton Corporation plc Weaknesses
- High price-to-earnings ratio at 30.24 may indicate overvaluation
- Price-to-book ratio of 6.37 is elevated
- Neutral liquidity ratios may pose short-term risk
- Asset turnover moderate at 0.67
- Dividend yield modest at 1.31%
ATS Corporation Weaknesses
- Negative net margin (-1.11%) and ROE (-1.64%) indicate unprofitability
- Very low interest coverage at 0.16 signals financial distress
- Zero dividend yield reflects no income return
- Debt-to-assets at 36.79% is relatively high
- Negative P/E suggests losses and risk
Eaton exhibits stable profitability and diversified global operations but shows valuation risks. ATS struggles with profitability and financial coverage despite some liquidity strength. These factors critically shape each company’s strategic flexibility and risk profile.
The Moat Duel: Analyzing Competitive Defensibility
A structural moat shields long-term profits from relentless competitive pressure and market disruption. Let’s dissect how Eaton and ATS defend their economic turf:
Eaton Corporation plc: Diversified Industrial Powerhouse with Capital Efficiency
Eaton’s moat stems from intangible assets and scale, delivering a robust 4.17% ROIC premium over WACC and stable 18.8% EBIT margins. In 2026, expanding eMobility and aerospace segments promise deeper market entrenchment.
ATS Corporation: Niche Automation Player Battling Profitability Headwinds
ATS relies on specialized automation solutions but suffers a steep ROIC decline, shedding value with negative margins contrasting Eaton’s strength. Its 2026 outlook hinges on digital factory integration opportunities amid fierce margin pressure.
Eaton’s Scale and Capital Efficiency vs. ATS’s Specialized Innovation Deficit
Eaton boasts a wider, sustainable moat driven by efficient capital use and diverse end markets. ATS’s declining ROIC signals a weakening moat vulnerable to margin compression. Eaton is better positioned to defend and grow market share in 2026.
Which stock offers better returns?
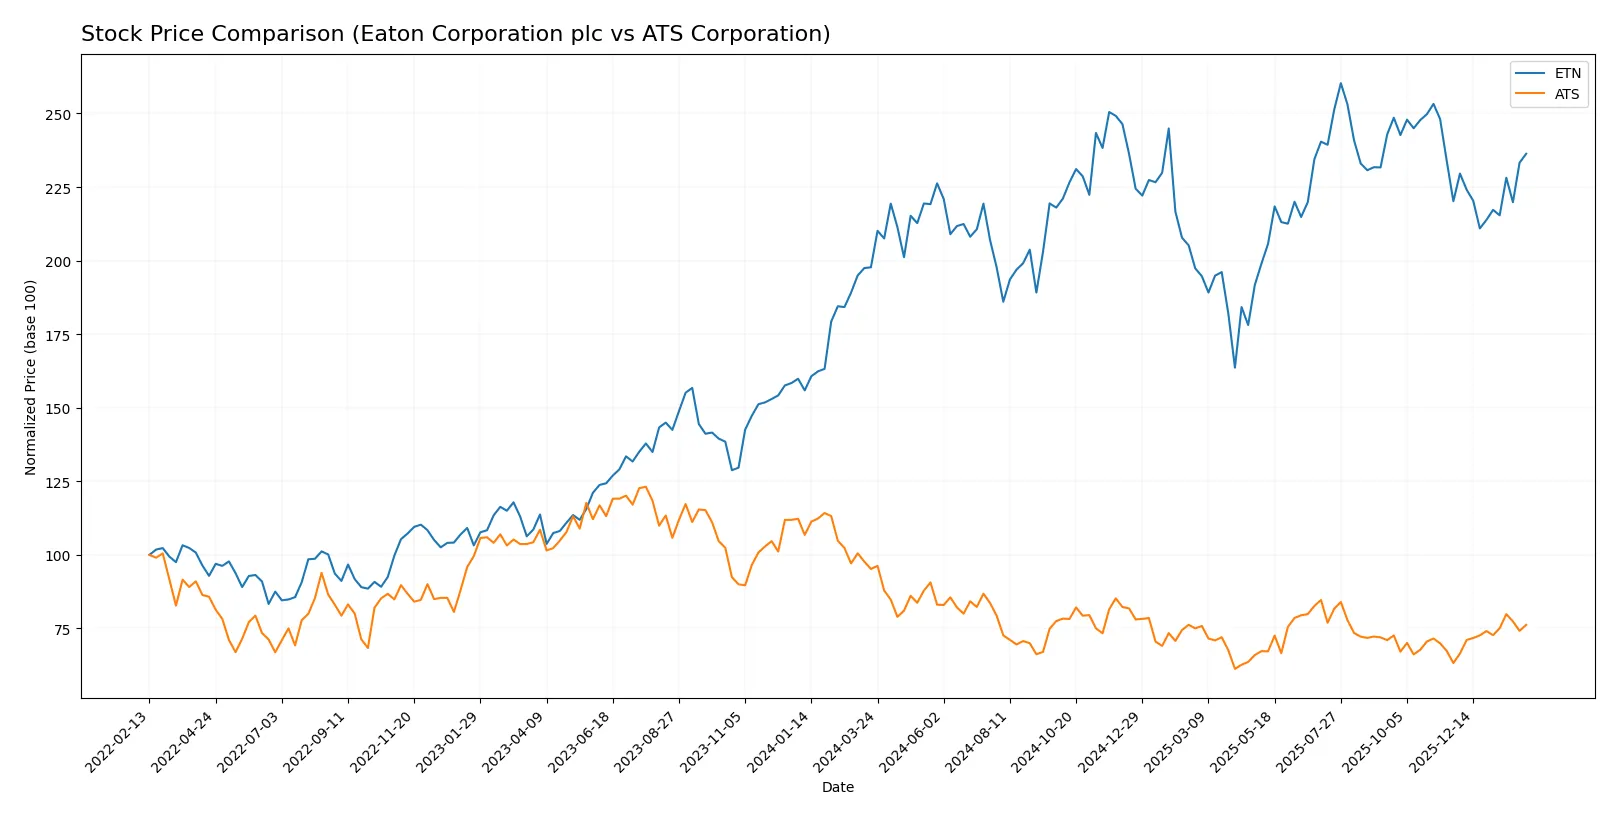
The past year shows Eaton Corporation plc’s stock climbing steadily with accelerating gains, while ATS Corporation’s price declined overall despite a strong recent rebound.
Trend Comparison
Eaton Corporation plc’s stock rose 19.52% over the past 12 months, marking a bullish trend with acceleration and notable volatility between $246.52 and $392.17.
ATS Corporation’s stock fell 19.97% over the same period, signaling a bearish trend despite accelerating recovery and lower volatility, with prices ranging from $23.50 to $36.93.
Eaton’s consistent bullish momentum outperformed ATS’s declining trend, delivering the highest market returns over the last year.
Target Prices
Analysts present a clear target consensus for Eaton Corporation plc and ATS Corporation.
| Company | Target Low | Target High | Consensus |
|---|---|---|---|
| Eaton Corporation plc | 295 | 495 | 395.42 |
| ATS Corporation | 34 | 34 | 34 |
Eaton’s consensus target of 395.42 suggests upside from the current 355.75 price, reflecting confidence in its industrial machinery segment. ATS’s target matches its current price near 29.24, indicating a neutral market outlook.

Don’t Let Luck Decide Your Entry Point
Optimize your entry points with our advanced ProRealTime indicators. You’ll get efficient buy signals with precise price targets for maximum performance. Start outperforming now!
How do institutions grade them?
Eaton Corporation plc Grades
The following table summarizes recent institutional grades for Eaton Corporation plc:
| Grading Company | Action | New Grade | Date |
|---|---|---|---|
| Wells Fargo | Maintain | Equal Weight | 2026-02-04 |
| JP Morgan | Maintain | Overweight | 2026-01-16 |
| HSBC | Upgrade | Buy | 2026-01-16 |
| Morgan Stanley | Maintain | Overweight | 2026-01-12 |
| Citigroup | Maintain | Buy | 2026-01-12 |
| Barclays | Maintain | Equal Weight | 2026-01-07 |
| UBS | Downgrade | Neutral | 2026-01-05 |
| Wells Fargo | Maintain | Equal Weight | 2025-12-18 |
| Wolfe Research | Upgrade | Outperform | 2025-12-09 |
| JP Morgan | Maintain | Overweight | 2025-11-06 |
ATS Corporation Grades
The following table summarizes recent institutional grades for ATS Corporation:
| Grading Company | Action | New Grade | Date |
|---|---|---|---|
| JP Morgan | Maintain | Neutral | 2026-01-16 |
| JP Morgan | Maintain | Neutral | 2024-08-13 |
| Goldman Sachs | Maintain | Sell | 2024-08-13 |
| JP Morgan | Maintain | Neutral | 2024-05-24 |
Which company has the best grades?
Eaton Corporation plc consistently receives higher grades, including multiple Buy and Overweight ratings. ATS Corporation’s grades are predominantly Neutral or Sell. Eaton’s stronger grades suggest better institutional confidence, potentially influencing investor sentiment positively.
Risks specific to each company
The following categories identify critical pressure points and systemic threats facing Eaton Corporation plc and ATS Corporation in the 2026 market environment:
1. Market & Competition
Eaton Corporation plc
- Operates globally with diverse segments, facing intense industrial machinery competition.
ATS Corporation
- Focused on automation solutions; niche market with strong competitors in tech-driven sectors.
2. Capital Structure & Debt
Eaton Corporation plc
- Moderate debt-to-equity ratio at 0.54, favorable debt-to-assets at 25.5%, interest coverage strong at 19.5x.
ATS Corporation
- Higher leverage with debt-to-equity around 1.0, weaker interest coverage at 0.16x signals potential financial stress.
3. Stock Volatility
Eaton Corporation plc
- Beta ~1.19 indicates moderate market sensitivity, stock price range wide but stable.
ATS Corporation
- Beta ~1.26 shows slightly higher volatility, with wider price fluctuation relative to market.
4. Regulatory & Legal
Eaton Corporation plc
- Global operations expose it to varied regulatory regimes but strong compliance history mitigates risk.
ATS Corporation
- Canadian base with expanding US presence, regulatory risks exist but less complex than Eaton’s global footprint.
5. Supply Chain & Operations
Eaton Corporation plc
- Large scale global supply chains vulnerable to geopolitical shocks but diversified sourcing reduces risk.
ATS Corporation
- Supply chain concentrated in automation tech; disruptions could impact production and service delivery significantly.
6. ESG & Climate Transition
Eaton Corporation plc
- Active in power management with increasing focus on eMobility and sustainability, aligning with climate goals.
ATS Corporation
- Automation solutions can improve manufacturing efficiency but less visibility on ESG initiatives compared to Eaton.
7. Geopolitical Exposure
Eaton Corporation plc
- Irish headquarters with global reach exposes it to currency and trade tensions, especially US-China dynamics.
ATS Corporation
- Canadian firm with North American focus, less exposed globally but sensitive to US-Canada relations and trade policies.
Which company shows a better risk-adjusted profile?
Eaton Corporation’s strongest risk lies in competitive globalization and regulatory complexity, yet its robust capital structure and liquidity cushion these risks well. ATS Corporation faces critical financial distress risks from high leverage and poor interest coverage, undermining operational resilience. Eaton’s Altman Z-Score (5.04) places it safely above distress, unlike ATS’s troubling 1.76 score. Hence, Eaton offers a superior risk-adjusted profile, justified by its stronger balance sheet and diversified market presence despite moderate market volatility.
Final Verdict: Which stock to choose?
Eaton Corporation plc (ETN) shines as a cash-generating powerhouse with a very favorable economic moat. Its ability to convert invested capital into growing profits sets it apart. A point of vigilance remains its relatively high valuation multiples. ETN suits portfolios aiming for stable, long-term growth.
ATS Corporation (ATS) offers a strategic moat in niche manufacturing but struggles with profitability and value creation. Its stronger liquidity ratios provide some safety cushion compared to ETN. ATS might fit speculative or turnaround-focused portfolios willing to tolerate elevated risk.
If you prioritize durable value creation and consistent profitability, ETN outshines with its sustainable competitive advantage and improving returns. However, if you seek a higher-risk, potentially undervalued play with liquidity strength, ATS offers an analytical scenario worth monitoring despite its current struggles.
Disclaimer: Investment carries a risk of loss of initial capital. The past performance is not a reliable indicator of future results. Be sure to understand risks before making an investment decision.
Go Further
I encourage you to read the complete analyses of Eaton Corporation plc and ATS Corporation to enhance your investment decisions: