Home > Comparison > Industrials > DOV vs ATS
The strategic rivalry between Dover Corporation and ATS Corporation shapes the Industrials sector’s machinery industry. Dover operates as a diversified industrial equipment provider with extensive aftermarket and clean energy segments. ATS specializes in automation solutions, delivering integrated manufacturing systems and digital factory management. This analysis pits Dover’s broad industrial footprint against ATS’s focused automation expertise to identify which offers superior risk-adjusted returns for diversified investors navigating this competitive landscape in 2026.
Table of contents
Companies Overview
Dover Corporation and ATS Corporation both play pivotal roles in the industrial machinery sector, shaping automation and equipment solutions globally.
Dover Corporation: Industrial Equipment Powerhouse
Dover Corporation dominates industrial machinery with a diverse portfolio spanning engineered products, clean energy, and climate tech. Its core revenue stems from equipment sales, software, and aftermarket services across aerospace, waste handling, and fuel transport. In 2026, Dover sharpened its focus on sustainability and digital integration, driving growth through innovation in clean energy and refrigeration technologies.
ATS Corporation: Automation Specialist
ATS Corporation excels in automation solutions, delivering end-to-end manufacturing and assembly systems globally. Its revenue engine centers on automation product sales, engineering services, and connected factory floor software, serving life sciences, transportation, and consumer goods markets. ATS prioritized expanding its digital offerings and lifecycle support services in 2026, aiming to enhance operational efficiency and reduce production downtime.
Strategic Collision: Similarities & Divergences
Both companies leverage industrial machinery expertise but diverge strategically: Dover emphasizes a broad product ecosystem including clean energy, while ATS concentrates on automation system integration and software. Their primary battleground lies in manufacturing efficiency solutions. Dover’s scale offers diversified stability; ATS’s niche focus promises agility. The contrast defines their distinct investment profiles amidst evolving industrial demands.
Income Statement Comparison
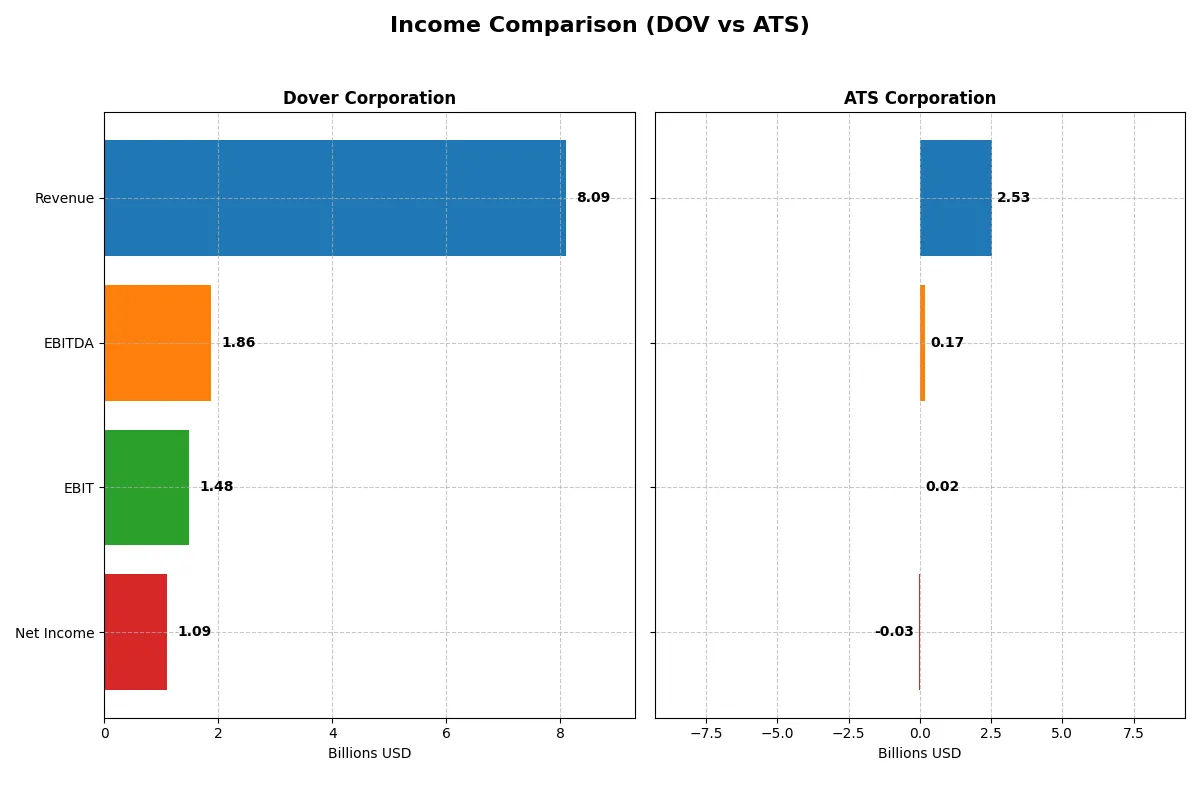
This data dissects the core profitability and scalability of both corporate engines to reveal who dominates the bottom line:
| Metric | Dover Corporation (DOV) | ATS Corporation (ATS) |
|---|---|---|
| Revenue | 8.1B | 2.5B |
| Cost of Revenue | 4.9B | 1.9B |
| Operating Expenses | 1.8B | 637M |
| Gross Profit | 3.2B | 647M |
| EBITDA | 1.9B | 168M |
| EBIT | 1.5B | 15M |
| Interest Expense | 110M | 98M |
| Net Income | 1.1B | -28M |
| EPS | 7.97 | -0.29 |
| Fiscal Year | 2025 | 2025 |
Income Statement Analysis: The Bottom-Line Duel
This income statement comparison reveals which company runs a more efficient and profitable corporate engine through recent financial performance.
Dover Corporation Analysis
Dover’s revenue steadily grew from 7.9B in 2021 to 8.1B in 2025, maintaining a gross margin near 40%. Net income peaked at 2.7B in 2024 but fell sharply to 1.1B in 2025. Despite a solid 18.3% EBIT margin in 2025, net margin contraction and falling EPS highlight efficiency challenges and profit volatility in the latest year.
ATS Corporation Analysis
ATS’s revenue surged 77% over five years, hitting 2.5B CAD in 2025 but dropped 16.5% from 2024 to 2025. Gross margin weakened to 25.5%, while net margin turned negative at -1.1%. EBIT plunged 95% last year, dragging net income into a 28M CAD loss. The recent steep margin erosion signals operational stress and worsening profitability.
Margin Resilience vs. Growth Volatility
Dover demonstrates stronger margin resilience and higher absolute profits despite recent setbacks. ATS shows robust revenue growth long-term but suffers from collapsing margins and net losses recently. Dover’s profile appeals more to investors valuing steady profitability, while ATS’s volatile earnings reflect higher risk and operational instability.
Financial Ratios Comparison
These vital ratios act as a diagnostic tool to expose the underlying fiscal health, valuation premiums, and capital efficiency of the companies compared below:
| Ratios | Dover Corporation (DOV) | ATS Corporation (ATS) |
|---|---|---|
| ROE | 38.8% (2024) | -1.6% (2025) |
| ROIC | 8.9% (2024) | 0.09% (2025) |
| P/E | 9.6x (2024) | -125.3x (2025) |
| P/B | 3.7x (2024) | 2.1x (2025) |
| Current Ratio | 2.04 (2024) | 1.69 (2025) |
| Quick Ratio | 1.52 (2024) | 1.41 (2025) |
| D/E (Debt-to-Equity) | 0.45 (2024) | 1.00 (2025) |
| Debt-to-Assets | 25.2% (2024) | 36.8% (2025) |
| Interest Coverage | 9.2x (2024) | 0.09x (2025) |
| Asset Turnover | 0.62 (2024) | 0.55 (2025) |
| Fixed Asset Turnover | 7.84 (2024) | 5.66 (2025) |
| Payout Ratio | 26% (2024) | 0% (2025) |
| Dividend Yield | 1.10% (2024) | 0% (2025) |
| Fiscal Year | 2024 | 2025 |
Efficiency & Valuation Duel: The Vital Signs
Financial ratios serve as a company’s DNA, exposing hidden risks and operational strengths that shape investment decisions.
Dover Corporation
Dover shows strong net margins at 13.52%, signaling solid profitability. Its P/E of 24.49 suggests a fairly valued stock. However, zero reported ROE and ROIC raise concerns about capital efficiency. Dover offers a modest 1.06% dividend yield, indicating steady shareholder returns with some income focus.
ATS Corporation
ATS struggles with a negative net margin of -1.11% and a deeply unfavorable ROE of -1.64%, reflecting operational challenges. The P/E ratio is negative, complicating valuation. ATS maintains no dividend, likely reinvesting in growth or restructuring, but high debt and poor interest coverage increase financial risk.
Profitability Strength vs. Operational Strain
Dover balances profitability and valuation with modest shareholder returns, while ATS shows operational strain and financial risk. Investors seeking stability may prefer Dover; those willing to endure risk for potential turnaround might consider ATS’s profile.
Which one offers the Superior Shareholder Reward?
I find Dover Corporation (DOV) offers superior shareholder rewards compared to ATS Corporation (ATS). DOV maintains a 1.06% dividend yield with a conservative 26% payout ratio, fully covered by strong free cash flow of $8.1B. It also executes consistent buybacks, enhancing total returns sustainably. ATS pays no dividends and suffers negative free cash flow (-$0.53B), reflecting reinvestment struggles amid weak profitability and minimal buyback activity. Historically, steady dividends plus disciplined buybacks at DOV outperform ATS’s riskier growth approach. For 2026 investors prioritizing balanced returns, DOV’s distribution model promises more dependable value creation.
Comparative Score Analysis: The Strategic Profile
The radar chart reveals the fundamental DNA and trade-offs of Dover Corporation and ATS Corporation:
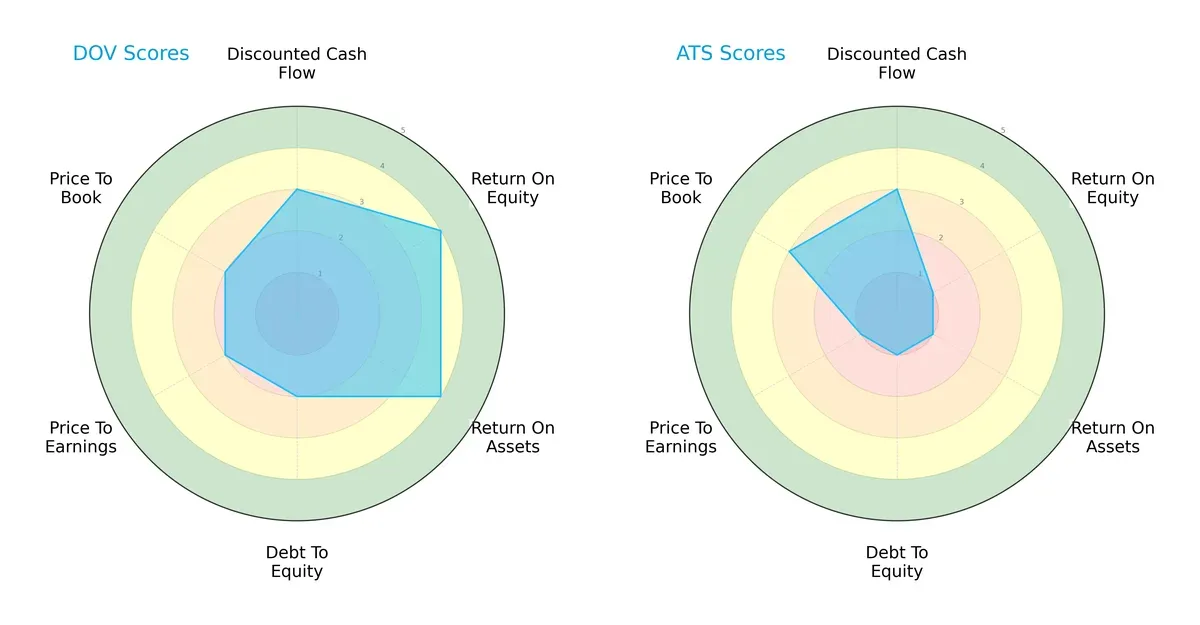
Dover shows a balanced profile with strong returns (ROE 4, ROA 4) and moderate valuation (PE 2, PB 2). ATS relies on a weaker profitability base (ROE 1, ROA 1) and carries higher financial risk (Debt/Equity 1). Dover’s moderate debt score signals prudent leverage, while ATS’s valuation metrics suggest significant market skepticism. Overall, Dover dominates with a more stable and diversified financial foundation.
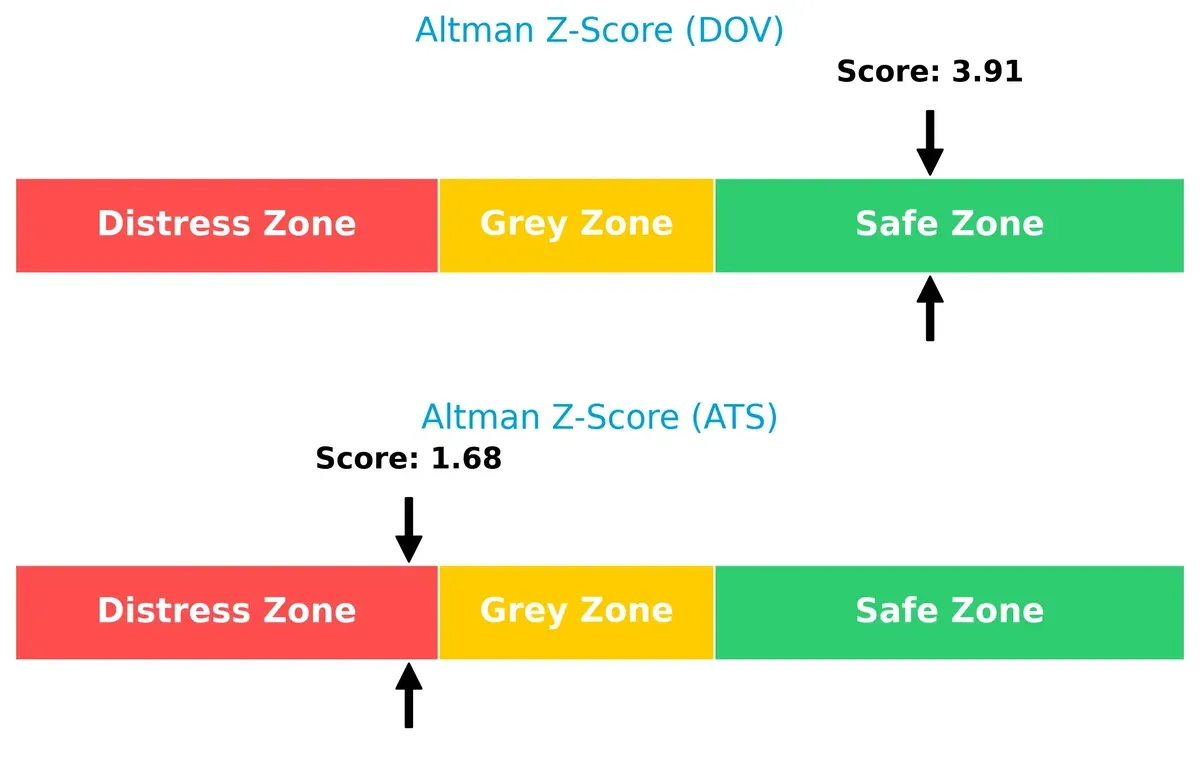
Bankruptcy Risk: Solvency Showdown
Dover’s Altman Z-Score of 3.91 places it safely above bankruptcy risk, while ATS at 1.68 teeters in distress territory, signaling long-term survival concerns:
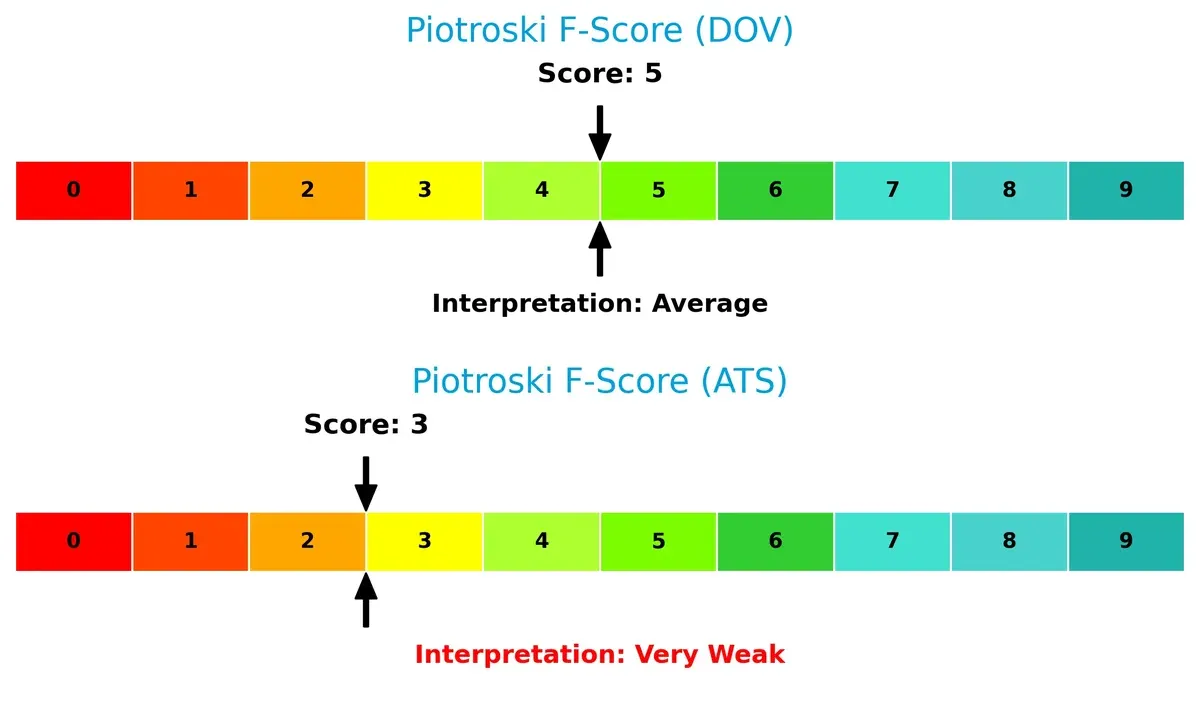
Financial Health: Quality of Operations
Dover’s Piotroski F-Score of 5 indicates average financial health, outperforming ATS’s weak score of 3, which signals red flags in operational efficiency and balance sheet quality:
How are the two companies positioned?
This section dissects DOV and ATS’s operational DNA by comparing their revenue distribution and internal dynamics. The goal is to confront their economic moats to reveal which model offers the most resilient, sustainable advantage today.
Revenue Segmentation: The Strategic Mix
This comparison dissects how Dover Corporation and ATS Corporation diversify their income streams and where their primary sector bets lie:
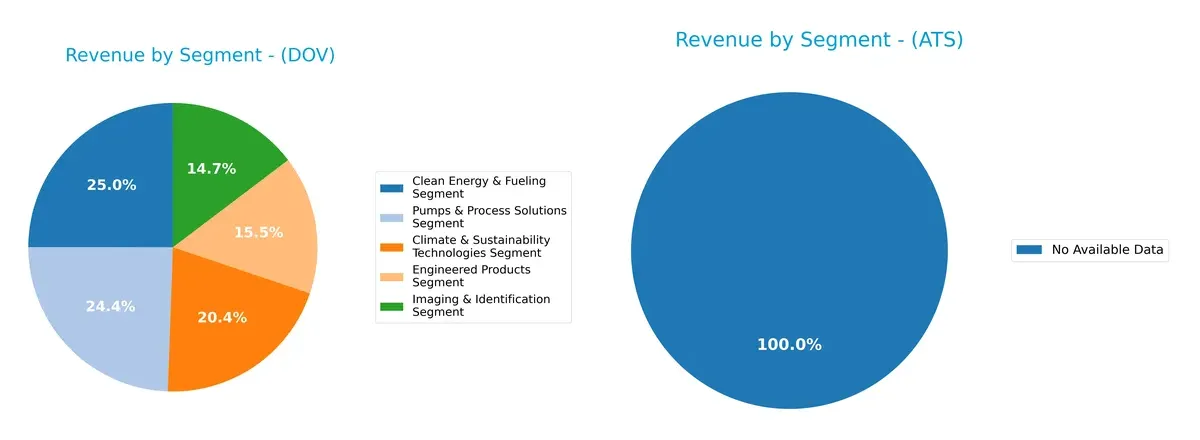
Dover Corporation displays a balanced revenue mix across five meaningful segments, with Clean Energy & Fueling at $1.94B and Pumps & Process Solutions close behind at $1.89B. This diversification reduces concentration risk and anchors Dover in multiple industrial ecosystems. ATS Corporation lacks available revenue segmentation data, preventing a direct comparison. Dover’s strategy leverages infrastructure dominance and sustainability trends, positioning it for resilience against sector downturns.
Strengths and Weaknesses Comparison
This table compares the Strengths and Weaknesses of Dover Corporation and ATS Corporation:
Dover Corporation Strengths
- Diversified revenue across multiple industrial segments
- Strong net margin of 13.52% indicates profitability
- Favorable debt-to-equity and interest coverage ratios
- Significant global presence including US, Europe, Asia
- Consistent product and geographic diversification
ATS Corporation Strengths
- Favorable current and quick ratios reflect liquidity strength
- Positive fixed asset turnover suggests efficient asset use
- Neutral price-to-book ratio supports valuation stability
- Geographic presence includes US and key European markets
Dover Corporation Weaknesses
- Unfavorable ROE and ROIC suggest weak capital efficiency
- Zero current and quick ratios indicate liquidity concerns
- Unavailable WACC limits cost of capital assessment
- Low asset and fixed asset turnover ratios reduce operational efficiency
ATS Corporation Weaknesses
- Negative net margin and ROE highlight profitability challenges
- Low interest coverage ratio signals financial risk
- Negative dividend yield reflects absence of shareholder returns
- Mixed debt-to-assets and leverage ratios pose moderate risk
Dover’s strengths lie in its broad industrial diversification and solid profitability, but liquidity and capital efficiency are weaknesses. ATS shows liquidity and asset efficiency strengths but struggles with profitability and interest coverage. These contrasts impact each firm’s strategic focus on financial health and growth.
The Moat Duel: Analyzing Competitive Defensibility
A structural moat is the sole fortress defending long-term profits from relentless competition erosion. Let’s examine how Dover Corporation and ATS Corporation stand:
Dover Corporation: Intangible Assets and Diversification Moat
Dover’s moat stems from diverse engineered products and software solutions, reflected in stable 18% EBIT margins. However, declining ROIC signals rising moat vulnerability in 2026.
ATS Corporation: Specialized Automation Expertise Moat
ATS relies on automation system integration and connected factory software. Despite a niche moat, it suffers from negative ROIC and margin erosion, undermining competitive strength compared to Dover.
Verdict: Diversification Depth vs. Specialized Expertise Fragility
Dover’s broader product scope and stronger margins create a wider moat than ATS’s specialized but financially strained niche. Dover is better positioned to defend market share amidst intensifying competition.
Which stock offers better returns?
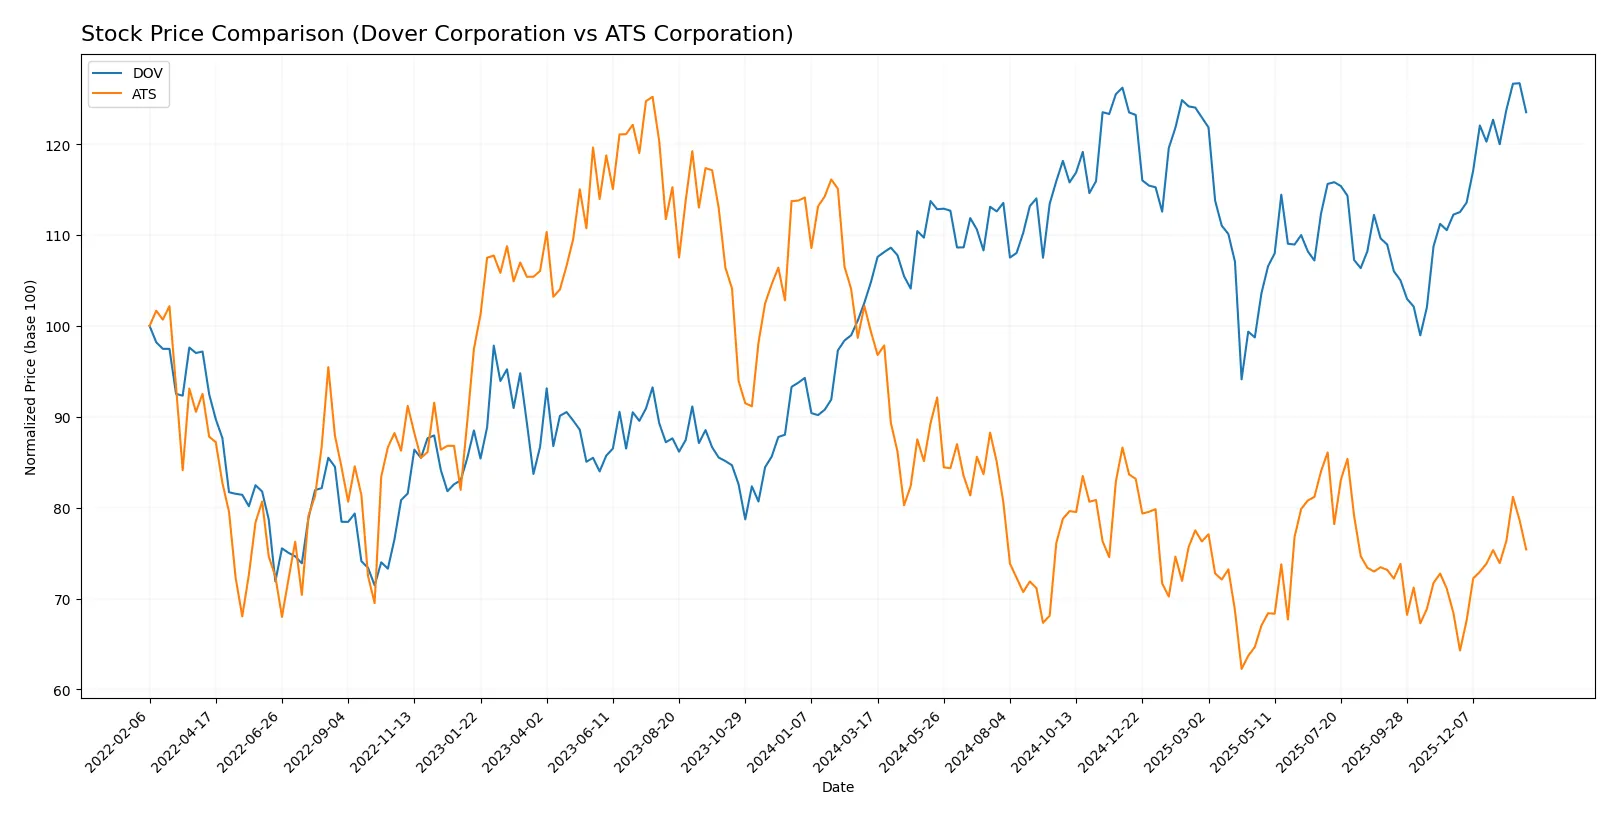
The past year reveals contrasting price dynamics: Dover Corporation advances sharply with accelerating momentum, while ATS Corporation faces a steep decline despite recent modest gains.
Trend Comparison
Dover Corporation’s stock climbed 17.81% over the last 12 months, showing a bullish trend with accelerating gains and a high volatility level (std dev 11.33). The price ranged from 153.55 to 206.71.
ATS Corporation’s stock declined 24.09% over the same period, marking a bearish trend with accelerating losses and lower volatility (std dev 2.83). The price fluctuated between 23.5 and 37.49.
Comparing both, Dover Corporation clearly delivered the highest market performance, outperforming ATS Corporation’s bearish trend by a wide margin.
Target Prices
Analysts present a cautiously optimistic target consensus for Dover Corporation and ATS Corporation.
| Company | Target Low | Target High | Consensus |
|---|---|---|---|
| Dover Corporation | 195 | 256 | 221.38 |
| ATS Corporation | 34 | 34 | 34 |
Dover’s target consensus of 221.38 suggests modest upside from the current 201.49 price. ATS’s fixed target at 34 indicates expected appreciation from 28.46.

Don’t Let Luck Decide Your Entry Point
Optimize your entry points with our advanced ProRealTime indicators. You’ll get efficient buy signals with precise price targets for maximum performance. Start outperforming now!
How do institutions grade them?
Dover Corporation Grades
Here are the latest institutional grades for Dover Corporation from leading firms:
| Grading Company | Action | New Grade | Date |
|---|---|---|---|
| RBC Capital | Maintain | Sector Perform | 2026-01-30 |
| JP Morgan | Maintain | Overweight | 2026-01-30 |
| Wells Fargo | Maintain | Equal Weight | 2026-01-30 |
| Oppenheimer | Maintain | Outperform | 2026-01-26 |
| JP Morgan | Maintain | Overweight | 2026-01-16 |
| Barclays | Maintain | Equal Weight | 2026-01-07 |
| Wells Fargo | Maintain | Equal Weight | 2026-01-07 |
| UBS | Upgrade | Buy | 2026-01-05 |
| Wells Fargo | Maintain | Equal Weight | 2025-12-15 |
| Oppenheimer | Maintain | Outperform | 2025-11-14 |
ATS Corporation Grades
The following table summarizes ATS Corporation’s recent institutional grades:
| Grading Company | Action | New Grade | Date |
|---|---|---|---|
| JP Morgan | Maintain | Neutral | 2026-01-16 |
| JP Morgan | Maintain | Neutral | 2024-08-13 |
| Goldman Sachs | Maintain | Sell | 2024-08-13 |
| JP Morgan | Maintain | Neutral | 2024-05-24 |
Which company has the best grades?
Dover Corporation has consistently received higher grades, including “Buy” and “Outperform,” while ATS Corporation’s grades remain mostly “Neutral” or “Sell.” This suggests Dover is viewed more favorably by analysts, potentially attracting more investor interest.
Risks specific to each company
The following categories identify the critical pressure points and systemic threats facing both firms in the 2026 market environment:
1. Market & Competition
Dover Corporation
- Strong industrial machinery presence with diversified segments; faces intense competition in automation and clean energy markets.
ATS Corporation
- Focused on automation solutions; competes aggressively in niche markets with pressure from innovation and client demands.
2. Capital Structure & Debt
Dover Corporation
- Favorable debt-to-equity and debt-to-assets ratios indicate financial prudence and manageable leverage.
ATS Corporation
- Neutral debt levels but low interest coverage ratio (0.16) raise concerns about servicing debt amid operational challenges.
3. Stock Volatility
Dover Corporation
- Beta of 1.305 suggests moderate sensitivity to market swings, typical for industrial machinery sector.
ATS Corporation
- Beta of 1.268 shows similar market sensitivity; however, recent price declines imply higher short-term volatility risk.
4. Regulatory & Legal
Dover Corporation
- Operates globally with exposure to evolving environmental and safety regulations, especially in clean energy segments.
ATS Corporation
- Faces regulatory scrutiny in automation and manufacturing services; compliance costs may rise with expanding global footprint.
5. Supply Chain & Operations
Dover Corporation
- Complex global supply chain supporting diverse product lines; risks from raw material price fluctuations and logistics disruptions.
ATS Corporation
- Relies heavily on supplier integration and just-in-time manufacturing; vulnerable to component shortages and operational delays.
6. ESG & Climate Transition
Dover Corporation
- Active in climate & sustainability technologies; transition risks balanced by growth opportunities in clean energy solutions.
ATS Corporation
- ESG initiatives less pronounced; potential lag in adapting to climate-related regulations and investor expectations.
7. Geopolitical Exposure
Dover Corporation
- US-based with global operations; subject to trade policies, tariffs, and geopolitical tensions impacting supply chains.
ATS Corporation
- Canadian headquarters with international clients; geopolitical shifts in North America and Asia could impact contracts and costs.
Which company shows a better risk-adjusted profile?
Dover Corporation’s strongest risk is operational complexity and supply chain exposure, yet it benefits from solid capital structure and higher financial stability. ATS Corporation struggles with profitability and debt servicing, reflected in distress-level Altman Z-score and weak Piotroski score. Dover’s diversified segments and safer financial footing offer a better risk-adjusted profile in 2026. Notably, ATS’s interest coverage ratio near 0.16 signals urgent liquidity risk, justifying heightened investor caution.
Final Verdict: Which stock to choose?
Dover Corporation’s superpower lies in its robust operational cash flow and efficient capital allocation, despite signs of margin pressure and declining ROIC. Its resilience fits well with portfolios aiming for steady industrial exposure and moderate growth, yet vigilance is needed on profitability trends.
ATS Corporation’s strategic moat centers on niche manufacturing capabilities and improving capital deployment, though it currently wrestles with profitability challenges and elevated debt levels. It offers a speculative edge suitable for investors seeking turnaround potential and higher risk tolerance.
If you prioritize operational stability and a proven cash generation engine, Dover outshines ATS due to its stronger income quality and safer financial footing. However, if you seek exposure to a potential recovery story with a higher risk-reward profile, ATS could offer compelling upside despite its current weaknesses.
Disclaimer: Investment carries a risk of loss of initial capital. The past performance is not a reliable indicator of future results. Be sure to understand risks before making an investment decision.
Go Further
I encourage you to read the complete analyses of Dover Corporation and ATS Corporation to enhance your investment decisions: