Home > Comparison > Industrials > CMI vs ATS
The strategic rivalry between Cummins Inc. and ATS Corporation shapes the evolution of the industrial machinery sector. Cummins operates as a capital-intensive global engine and power systems manufacturer. ATS, by contrast, specializes in automation solutions and engineering services, emphasizing innovation and digital integration. This analysis contrasts their operational models to identify which corporate trajectory yields superior risk-adjusted returns for diversified portfolios navigating industrial sector dynamics.
Table of contents
Companies Overview
Cummins Inc. and ATS Corporation are key industrial players shaping global machinery and automation markets.
Cummins Inc.: Global Powertrain and Engine Leader
Cummins Inc. dominates the industrial machinery sector by designing and manufacturing diesel, natural gas engines, and electrified powertrains. Its diversified revenue stems from five segments, including engine manufacturing and power systems. In 2026, Cummins focuses on expanding its new power technologies, including battery and hydrogen fuel cells, to drive sustainable growth.
ATS Corporation: Automation Solutions Expert
ATS Corporation specializes in automation technology, delivering custom manufacturing and assembly systems worldwide. It generates revenue through automation design, commissioning, and post-sale services across industries like life sciences and electronics. ATS’s 2026 strategy centers on digital and connected factory floor solutions to enhance operational efficiency and reduce downtime for its clients.
Strategic Collision: Similarities & Divergences
Both companies operate in advanced industrial markets but differ sharply in focus. Cummins emphasizes powertrain innovation and emission solutions, while ATS leads in automation and digital factory systems. Their competitive battleground lies in industrial efficiency, with Cummins powering machines and ATS optimizing production lines. Investors face distinct profiles: Cummins offers scale and legacy power, ATS delivers nimble, tech-driven automation growth.
Income Statement Comparison
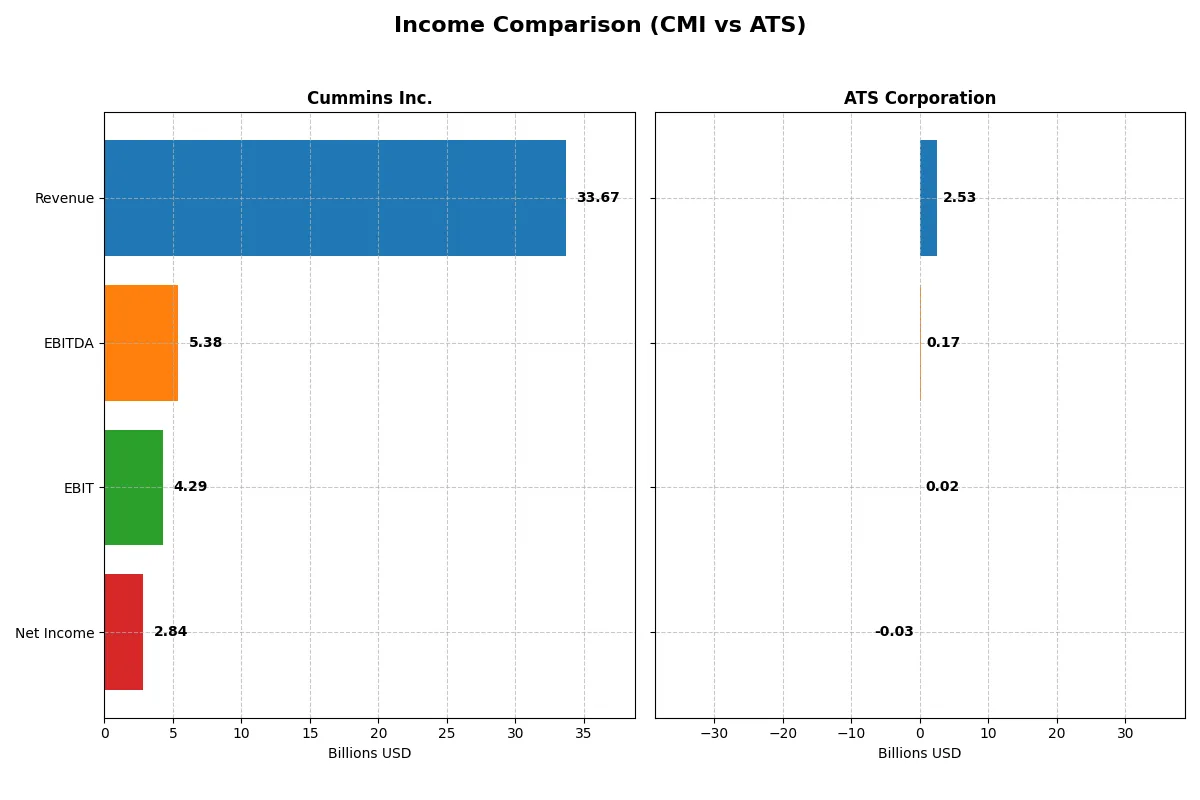
This data dissects the core profitability and scalability of both corporate engines to reveal who dominates the bottom line:
| Metric | Cummins Inc. (CMI) | ATS Corporation (ATS) |
|---|---|---|
| Revenue | 33.7B | 2.53B |
| Cost of Revenue | 25.2B | 1.89B |
| Operating Expenses | 4.52B | 637M |
| Gross Profit | 8.52B | 647M |
| EBITDA | 5.39B | 168M |
| EBIT | 4.29B | 15.3M |
| Interest Expense | 329M | 98.2M |
| Net Income | 2.84B | -28M |
| EPS | 20.62 | -0.29 |
| Fiscal Year | 2025 | 2025 |
Income Statement Analysis: The Bottom-Line Duel
This income statement comparison exposes which company runs a more efficient and profitable business engine through recent fiscal performance.
Cummins Inc. Analysis
Cummins Inc. posted steady revenue growth from 24B in 2021 to 34B in 2024 but faced a slight dip to 33.7B in 2025. Net income rose sharply over five years, peaking at 3.95B in 2024 before retreating to 2.84B in 2025. Gross margins hold firm around 25%, and net margins remain healthy near 8.4%. The latest year signals cautious momentum with declining profitability despite cost control.
ATS Corporation Analysis
ATS Corporation grew revenue from 1.43B CAD in 2021 to 3.03B CAD in 2024, then dropped 16.5% to 2.53B CAD in 2025. Net income has been volatile, turning negative to -28M CAD in 2025 after a peak of 194M CAD in 2024. Gross margin stays around 25.5%, but net margin slipped into negative territory at -1.1%. The latest year reflects deteriorating earnings and weak operational efficiency.
Margin Strength vs. Earnings Stability
Cummins leads with consistent profitability and favorable margins despite a minor recent earnings setback. ATS shows impressive revenue growth overall but suffers from unstable bottom-line results and negative net margins. Cummins’ stable earnings profile offers more reliability for investors focused on margin strength and earnings quality.
Financial Ratios Comparison
These vital ratios act as a diagnostic tool to expose the underlying fiscal health, valuation premiums, and capital efficiency of the companies compared below:
| Ratios | Cummins Inc. (CMI) | ATS Corporation (ATS) |
|---|---|---|
| ROE | 23.0% | -1.6% |
| ROIC | 12.0% | 0.1% |
| P/E | 24.8 | -125.3 |
| P/B | 5.7 | 2.1 |
| Current Ratio | 1.76 | 1.69 |
| Quick Ratio | 1.16 | 1.41 |
| D/E | 0.59 | 1.00 |
| Debt-to-Assets | 21.3% | 36.8% |
| Interest Coverage | 12.1 | 0.09 |
| Asset Turnover | 0.99 | 0.55 |
| Fixed Asset Turnover | 4.84 | 5.66 |
| Payout Ratio | 37.1% | 0% |
| Dividend Yield | 1.50% | 0% |
| Fiscal Year | 2025 | 2025 |
Efficiency & Valuation Duel: The Vital Signs
Financial ratios serve as a company’s DNA, uncovering operational strengths and hidden risks critical to investment decisions.
Cummins Inc.
Cummins shows strong profitability with a 23% ROE and a solid 8.44% net margin, reflecting operational efficiency. Its P/E at 24.76 suggests a fairly valued stock, though the elevated P/B of 5.7 signals some premium pricing. A 1.5% dividend yield provides steady shareholder returns, balancing growth and income.
ATS Corporation
ATS struggles with negative net margin and ROE, indicating operational challenges and weak profitability. Despite a favorable P/E, the negative earnings distort valuation clarity. The absence of dividends and a negative free cash flow yield reveal a reinvestment focus, potentially in growth or restructuring, but signal elevated risk.
Balanced Strength vs. Recovery Challenge
Cummins offers a better blend of profitability and valuation stability, backed by consistent shareholder returns. ATS’s metrics reflect financial strain and uncertainty, fitting a higher-risk profile. Investors seeking steady cash flow may prefer Cummins, while those tolerating volatility might consider ATS’s turnaround potential.
Which one offers the Superior Shareholder Reward?
I observe Cummins Inc. (CMI) delivers shareholder rewards through a balanced distribution model. It pays a 1.5% dividend yield, supported by a 37% payout ratio and strong free cash flow coverage (1.58x). Cummins also actively repurchases shares, enhancing total returns sustainably. ATS Corporation (ATS) pays no dividends and reports negative free cash flow, relying on reinvestment for growth. Its weak operating cash flow (0.02 ratio) and limited buyback activity raise concerns about near-term shareholder returns. Historically, firms with solid dividend coverage and buybacks outperform peers during market cycles. I judge Cummins offers a more attractive total return profile in 2026, combining income and capital appreciation with prudent capital allocation.
Comparative Score Analysis: The Strategic Profile
The radar chart reveals the fundamental DNA and trade-offs of Cummins Inc. and ATS Corporation, highlighting their financial strengths and valuation nuances:
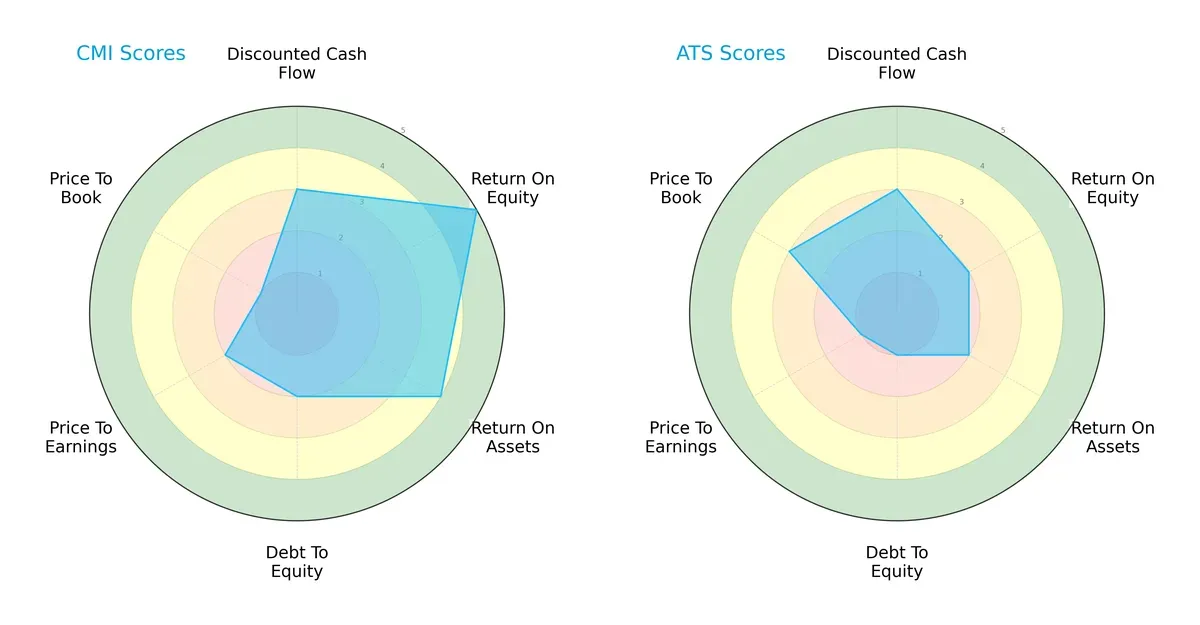
Cummins Inc. excels in profitability with strong ROE (5) and ROA (4) scores, but shows weaknesses in leverage and valuation with low Debt/Equity (2) and P/B (1) scores. ATS Corporation presents a less balanced profile, with uniformly low profitability scores and a weaker debt position (1), though it offers a slightly better Price-to-Book score (3). Cummins demonstrates a more diversified competitive edge, while ATS relies primarily on valuation appeal.
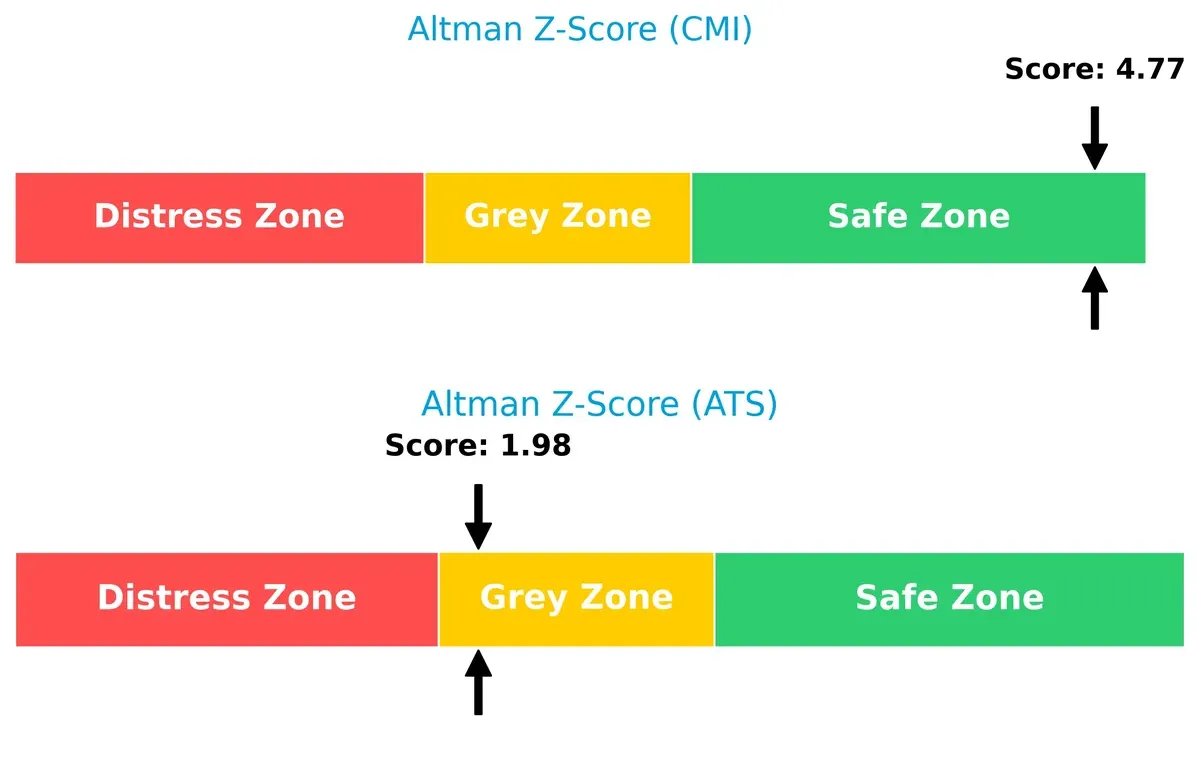
Bankruptcy Risk: Solvency Showdown
Cummins’ Altman Z-Score of 4.77 places it firmly in the safe zone, signaling robust long-term solvency. ATS, with a 1.98 score, sits in the grey zone, implying moderate bankruptcy risk under current economic pressures:
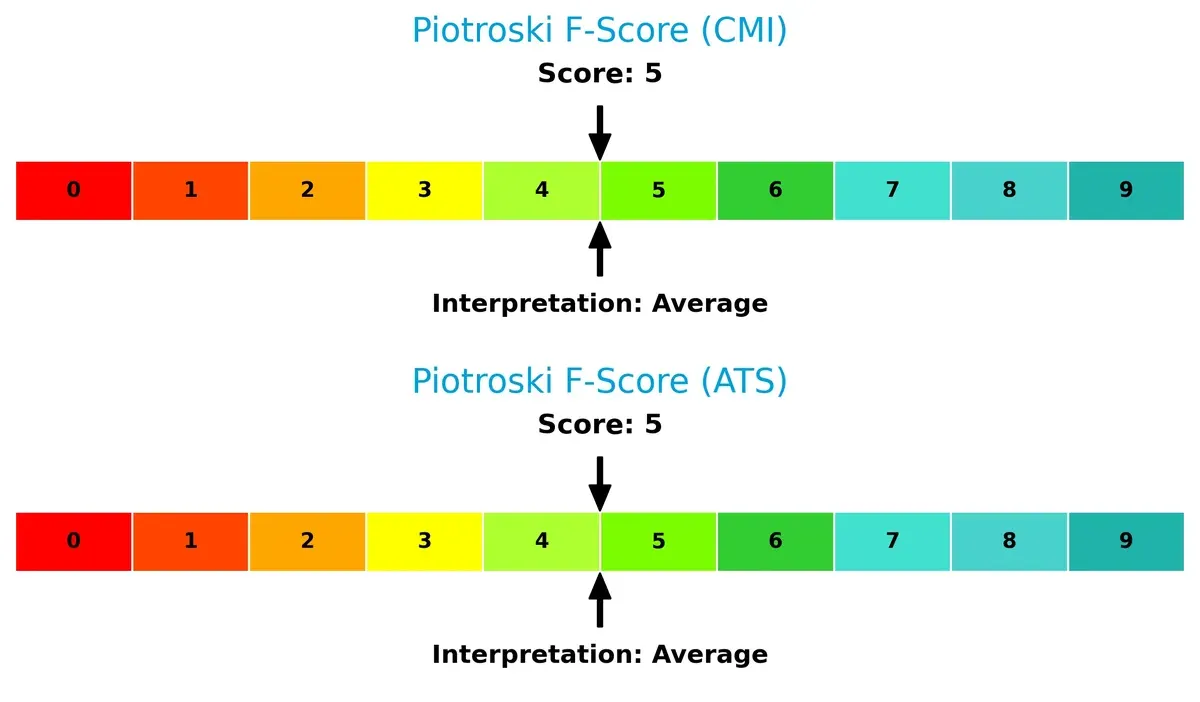
Financial Health: Quality of Operations
Both companies share an average Piotroski F-Score of 5, indicating moderate operational quality. Neither firm shows critical red flags, but neither achieves peak financial health either:
How are the two companies positioned?
This section dissects the operational DNA of Cummins and ATS by comparing their revenue distribution and internal dynamics, including strengths and weaknesses. The goal is to confront their economic moats and identify which model offers the most resilient, sustainable advantage today.
Revenue Segmentation: The Strategic Mix
This visual comparison dissects how Cummins Inc. and ATS Corporation diversify their income streams and where their primary sector bets lie:
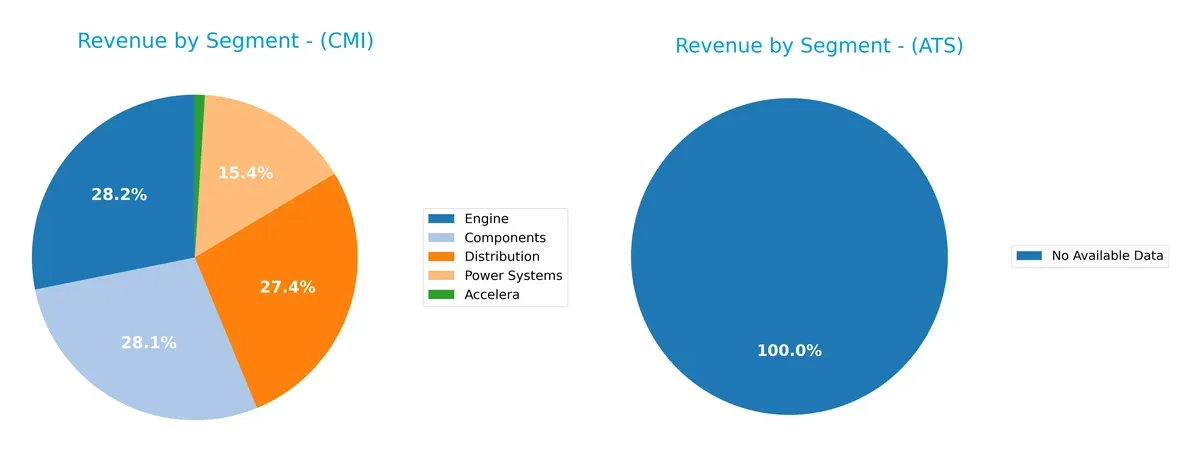
Cummins Inc. shows a well-distributed revenue base anchored by Components at $11.7B and Engine at $11.7B in 2024. Distribution follows closely with $11.4B, while Power Systems contributes $6.4B. In contrast, ATS Corporation lacks available data, preventing segmentation analysis. Cummins’ diversified mix reduces concentration risk and supports ecosystem lock-in through multiple industrial segments. This strategy contrasts sharply with single-segment reliance, which heightens vulnerability to sector downturns.
Strengths and Weaknesses Comparison
This table compares the Strengths and Weaknesses of Cummins Inc. and ATS Corporation:
Cummins Inc. Strengths
- Diverse product segments including Engines, Components, and Power Systems
- Strong profitability with 23% ROE and 12% ROIC
- Solid liquidity ratios above 1.1
- Established global presence with nearly $20B US revenue and significant China and India sales
- Favorable fixed asset turnover at 4.84
ATS Corporation Strengths
- Favorable weighted average cost of capital (7.7%)
- Positive price-to-earnings valuation despite losses
- Reasonable liquidity with current ratio near 1.7 and quick ratio above 1.4
- Favorable fixed asset turnover at 5.66
- Geographic diversification across US, Germany, Italy, and Europe
Cummins Inc. Weaknesses
- Elevated price-to-book ratio at 5.7 indicating potential overvaluation
- Moderate net margin at 8.44% with neutral status
- Debt-to-equity ratio of 0.59 is neutral but worth monitoring
- Neutral asset turnover at 0.99 limits efficiency gains
ATS Corporation Weaknesses
- Negative net margin (-1.11%) and ROE (-1.64%) indicate profitability struggles
- Very low ROIC (0.09%) below WACC signals poor capital returns
- Interest coverage ratio at 0.16 raises solvency concerns
- Debt-to-assets at 36.8% is higher than Cummins
- Zero dividend yield reduces income appeal
Cummins Inc. demonstrates strong profitability, liquidity, and global scale, supporting its diversified industrial strategy. ATS Corporation faces profitability and solvency challenges despite operational efficiency and geographic reach, which may constrain capital allocation and growth.
The Moat Duel: Analyzing Competitive Defensibility
A structural moat is the only barrier protecting long-term profits from relentless competition and market pressure. Here’s how two industrial machinery giants compare:
Cummins Inc.: Durable Cost Advantage and Intangible Assets
Cummins leverages a mix of cost advantage and proprietary engine technologies, reflected in its solid 25% gross margin and 8.4% net margin. Despite a recent dip in profitability, its diversified engine portfolio and expansion in electrified power deepen this moat heading into 2026.
ATS Corporation: Specialized Automation with Narrow Defensive Moat
ATS’s moat centers on specialized automation solutions and engineering services. However, its slim 0.6% EBIT margin and negative net margin highlight weak capital efficiency compared to Cummins. Growth opportunities exist in digital factory solutions, but profitability erosion clouds its competitive durability.
Cost Leadership vs. Specialized Automation: The Battle for Industrial Supremacy
Cummins maintains a wider and deeper moat through consistent value creation and scale economies. ATS’s declining ROIC and profitability signal a fragile moat. I see Cummins as far better positioned to defend and grow its market share in the evolving industrial landscape.
Which stock offers better returns?
The past year saw Cummins Inc. surge with strong gains and accelerating momentum, while ATS Corporation endured a pronounced decline before a modest recent rebound.
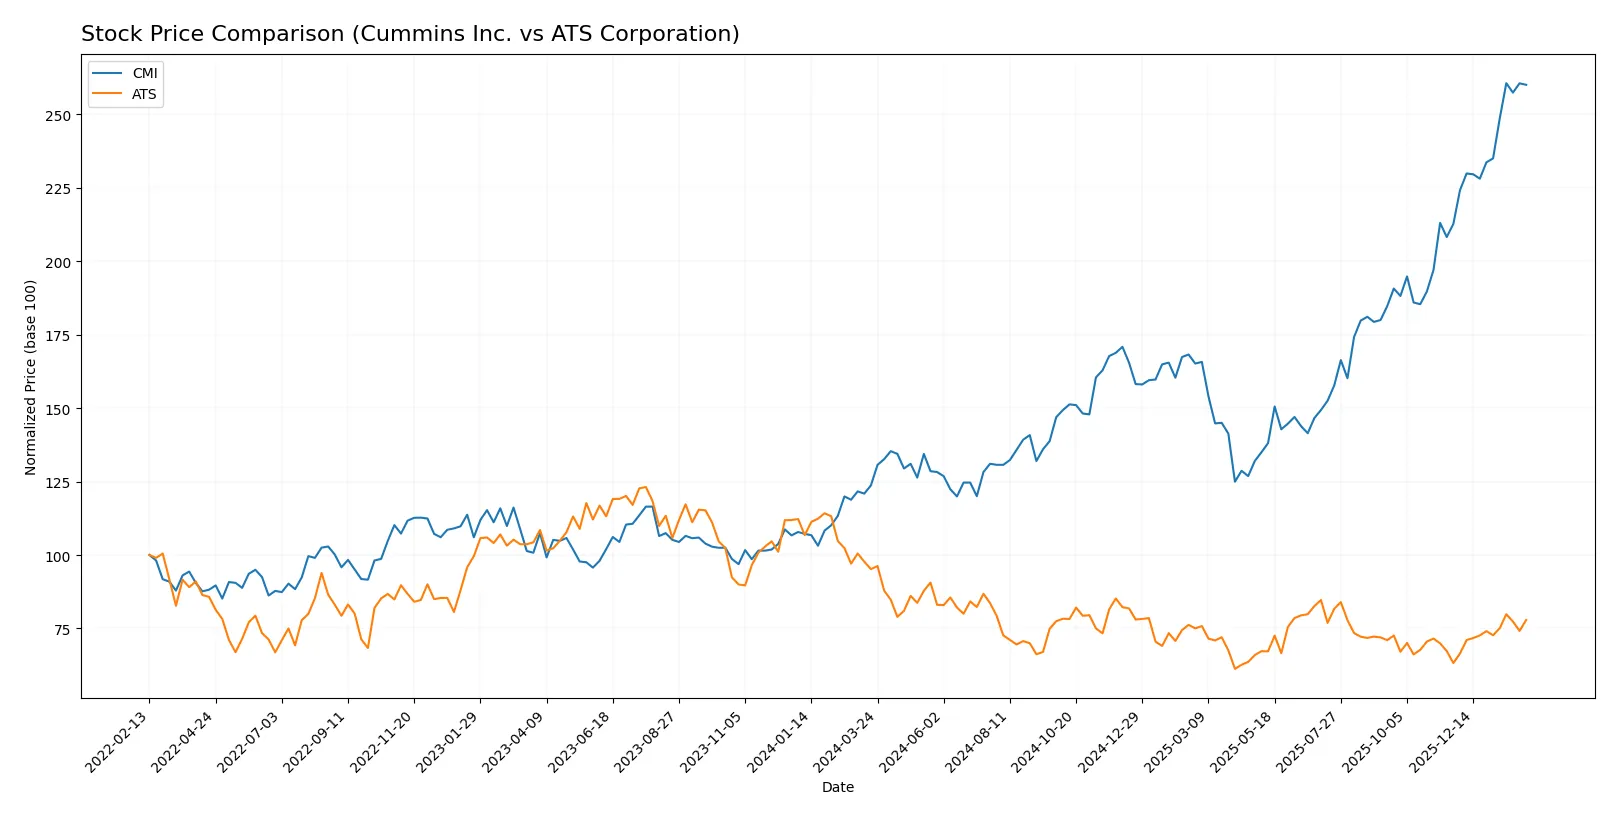
Trend Comparison
Cummins Inc. shows a 110.21% price rise over 12 months, marking a bullish trend with accelerating gains and high volatility indicated by a 79.49 standard deviation.
ATS Corporation records an 18.2% price drop over the same period, reflecting a bearish trend despite recent acceleration and a slight recovery of 23.17% since late 2025.
Cummins clearly outperforms ATS, delivering the highest market returns with a sustained and accelerating upward trend over the last year.
Target Prices
Analysts present a clear target consensus for both Cummins Inc. and ATS Corporation, reflecting varied growth expectations.
| Company | Target Low | Target High | Consensus |
|---|---|---|---|
| Cummins Inc. | 540 | 703 | 606.1 |
| ATS Corporation | 34 | 34 | 34 |
Cummins’ consensus target of 606.1 suggests modest upside from its current price of 577.73, while ATS’s flat target at 34 indicates limited near-term price appreciation.

Don’t Let Luck Decide Your Entry Point
Optimize your entry points with our advanced ProRealTime indicators. You’ll get efficient buy signals with precise price targets for maximum performance. Start outperforming now!
How do institutions grade them?
The following grades summarize recent institutional assessments for Cummins Inc. and ATS Corporation:
Cummins Inc. Grades
The table below shows the latest grades from reputable grading companies for Cummins Inc.:
| Grading Company | Action | New Grade | Date |
|---|---|---|---|
| Truist Securities | Maintain | Buy | 2026-02-06 |
| Wolfe Research | Downgrade | Peer Perform | 2026-01-26 |
| Wells Fargo | Maintain | Overweight | 2026-01-23 |
| Barclays | Maintain | Overweight | 2026-01-23 |
| JP Morgan | Maintain | Neutral | 2026-01-14 |
| Citigroup | Maintain | Buy | 2026-01-13 |
| Raymond James | Upgrade | Outperform | 2025-12-22 |
| Barclays | Upgrade | Overweight | 2025-12-19 |
| Truist Securities | Maintain | Buy | 2025-12-18 |
| Citigroup | Maintain | Buy | 2025-12-11 |
ATS Corporation Grades
The table below shows the latest grades from reputable grading companies for ATS Corporation:
| Grading Company | Action | New Grade | Date |
|---|---|---|---|
| JP Morgan | Maintain | Neutral | 2026-01-16 |
| JP Morgan | Maintain | Neutral | 2024-08-13 |
| Goldman Sachs | Maintain | Sell | 2024-08-13 |
| JP Morgan | Maintain | Neutral | 2024-05-24 |
Which company has the best grades?
Cummins Inc. holds predominantly positive grades, including multiple Buy and Overweight ratings. ATS Corporation mostly receives Neutral and Sell ratings. Investors might interpret Cummins’ stronger grades as a signal of comparatively higher institutional confidence.
Risks specific to each company
In 2026’s volatile market, these categories reveal the critical pressure points and systemic threats facing Cummins Inc. and ATS Corporation:
1. Market & Competition
Cummins Inc.
- Dominates heavy- and medium-duty engine markets with diversified segments.
ATS Corporation
- Faces intense competition in automation solutions across multiple industries.
2. Capital Structure & Debt
Cummins Inc.
- Maintains moderate leverage (D/E 0.59) with strong interest coverage (13.05x).
ATS Corporation
- High leverage (D/E 1.0) and poor interest coverage (0.16x) raise solvency concerns.
3. Stock Volatility
Cummins Inc.
- Beta at 1.12 signals moderate market sensitivity.
ATS Corporation
- Slightly higher beta of 1.16 indicates more pronounced price swings.
4. Regulatory & Legal
Cummins Inc.
- Exposure to emissions regulations due to diesel engine production.
ATS Corporation
- Compliance risks in highly regulated automation sectors, including life sciences.
5. Supply Chain & Operations
Cummins Inc.
- Complex global supply chains with broad aftermarket service network.
ATS Corporation
- Operational risks from integration of software and hardware in automation systems.
6. ESG & Climate Transition
Cummins Inc.
- Transitioning to electrified power and hydrogen tech to reduce emissions.
ATS Corporation
- ESG integration more challenging due to diversification in energy and transportation sectors.
7. Geopolitical Exposure
Cummins Inc.
- Large US base with global operations; sensitive to trade tensions.
ATS Corporation
- Canadian HQ with exposure to US and global markets, vulnerable to cross-border policies.
Which company shows a better risk-adjusted profile?
Cummins Inc. carries the most impactful risk in regulatory pressures from emission standards but benefits from robust capital structure and diversified operations. ATS Corporation’s critical risk stems from its fragile financial health and weak interest coverage, posing solvency challenges. Cummins’ strong Altman Z-Score (4.77, safe zone) and favorable ROE (23%) signal better risk management. ATS’s borderline Altman Z-Score (1.98, grey zone) and negative profitability metrics highlight significant financial distress. Thus, Cummins presents a superior risk-adjusted profile grounded in financial stability and strategic ESG transition efforts.
Final Verdict: Which stock to choose?
Cummins Inc. stands out for its robust capital efficiency and consistent value creation, powered by a solid economic moat and strong returns on equity. Its main point of vigilance is a relatively high price-to-book ratio, which suggests investors pay a premium. It suits portfolios focused on resilient industrial growth.
ATS Corporation’s strategic moat lies in its specialized automation niche, though its financials reveal value erosion and weaker profitability. Compared to Cummins, ATS presents a riskier profile but could appeal to investors seeking turnaround stories or contrarian plays in technology-driven manufacturing.
If you prioritize stable value creation and proven profitability, Cummins outshines ATS with better financial health and market momentum. However, if you seek speculative growth with potential upside from operational improvements, ATS offers a higher-risk, higher-reward scenario. Both require careful risk management aligned with your investment horizon.
Disclaimer: Investment carries a risk of loss of initial capital. The past performance is not a reliable indicator of future results. Be sure to understand risks before making an investment decision.
Go Further
I encourage you to read the complete analyses of Cummins Inc. and ATS Corporation to enhance your investment decisions: