In the dynamic world of industrial machinery, ATS Corporation and Columbus McKinnon Corporation stand out with distinct yet overlapping market footprints. ATS specializes in advanced automation solutions, while Columbus McKinnon focuses on intelligent motion and material handling systems. Both companies emphasize innovation to improve operational efficiency across various sectors. This article will analyze their strengths and challenges to help you identify which company offers the most compelling investment opportunity in 2026.
Table of contents
Companies Overview
I will begin the comparison between ATS Corporation and Columbus McKinnon Corporation by providing an overview of these two companies and their main differences.
ATS Overview
ATS Corporation specializes in automation solutions, offering a comprehensive range of services including designing, building, and servicing automated manufacturing systems worldwide. The company serves diverse sectors such as life sciences, transportation, and energy, focusing on enhancing operational efficiency and sustainable production. Founded in 1978 and headquartered in Cambridge, Canada, ATS employs approximately 7,500 people and trades on the NYSE.
CMCO Overview
Columbus McKinnon Corporation designs and markets intelligent motion solutions for material handling, including hoists, cranes, and power technology products. Serving various markets from industrial automation to e-commerce, the company provides products directly and through distributors. Founded in 1875 and based in Buffalo, New York, CMCO has around 3,515 employees and is listed on NASDAQ.
Key similarities and differences
Both ATS and CMCO operate in the industrial sector, focusing on machinery and automation solutions with global reach. ATS emphasizes automated manufacturing and digital factory management, while CMCO specializes in material handling and motion control equipment. ATS is larger by market cap and workforce, whereas CMCO offers a broader range of power and motion technology products, reflecting differing business models within related industries.
Income Statement Comparison
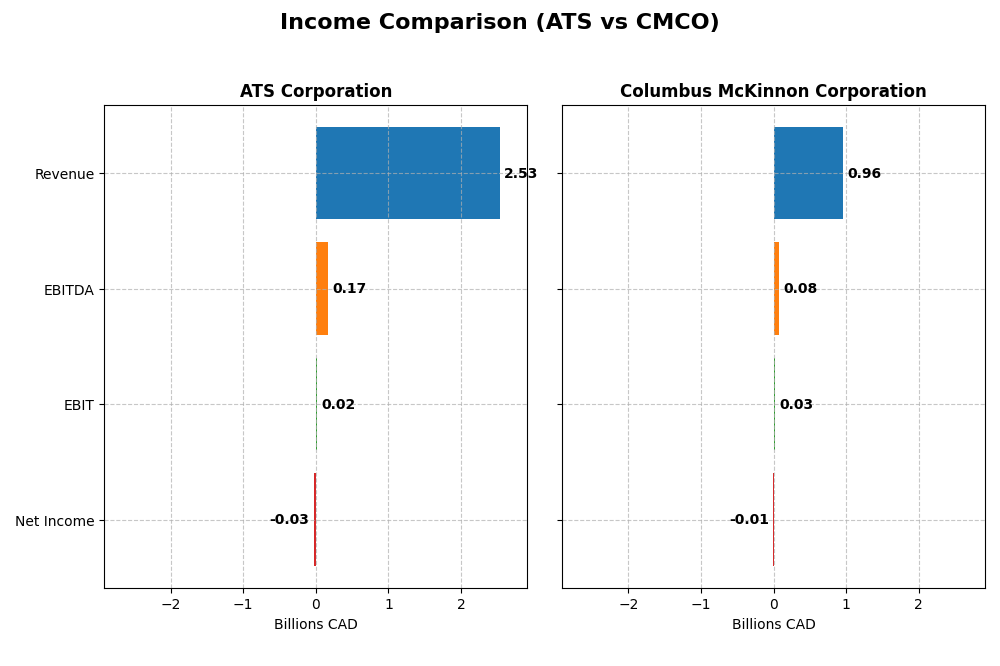
This table compares key income statement metrics for ATS Corporation and Columbus McKinnon Corporation for their most recent fiscal year reported.
| Metric | ATS Corporation (2025) | Columbus McKinnon Corporation (2024) |
|---|---|---|
| Market Cap | 2.73B CAD | 494M USD |
| Revenue | 2.53B CAD | 963M USD |
| EBITDA | 168M CAD | 75M USD |
| EBIT | 15.3M CAD | 27M USD |
| Net Income | -28M CAD | -5.1M USD |
| EPS | -0.29 CAD | -0.18 USD |
| Fiscal Year | 2025 | 2024 |
Income Statement Interpretations
ATS Corporation
Over 2021-2025, ATS Corporation showed a 77.15% revenue growth but suffered a 143.76% decline in net income, reflecting volatile profitability. Gross margins remained favorable at 25.53%, yet net margins turned unfavorable at -1.11% in 2025, evidencing a sharp drop. The latest year saw revenue decline by 16.47% and net income swing to a loss of CAD 28M, signaling margin pressures and operational challenges.
Columbus McKinnon Corporation
Columbus McKinnon’s revenue increased 48.24% from 2020 to 2024 but net income decreased by 156.42%, illustrating weakened bottom-line results. The company maintained a strong gross margin of 33.82%, while net margin turned negative at -0.53% in 2024. The most recent fiscal year showed a 4.98% revenue decline and a net loss of USD 5.1M, highlighting margin compression and reduced profitability.
Which one has the stronger fundamentals?
Both ATS and Columbus McKinnon experienced revenue growth over their respective periods but faced significant net income deterioration and negative net margins recently. Each maintains favorable gross margins and neutral EBIT margins, yet both show unfavorable net margin trends and earnings declines in the latest year. Fundamentally, neither company currently demonstrates strong income statement stability or growth.
Financial Ratios Comparison
The table below compares the most recent financial ratios for ATS Corporation and Columbus McKinnon Corporation, reflecting their fiscal year 2025 (ATS) and 2024 (CMCO) performances.
| Ratios | ATS Corporation (2025) | Columbus McKinnon Corporation (2024) |
|---|---|---|
| ROE | -1.64% | -0.58% |
| ROIC | 0.09% | 3.30% |
| P/E | -125.3 | -94.7 |
| P/B | 2.06 | 0.55 |
| Current Ratio | 1.69 | 1.81 |
| Quick Ratio | 1.41 | 1.04 |
| D/E (Debt-to-Equity) | 1.00 | 0.61 |
| Debt-to-Assets | 36.8% | 31.1% |
| Interest Coverage | 0.09 | 1.68 |
| Asset Turnover | 0.55 | 0.55 |
| Fixed Asset Turnover | 5.66 | 9.07 |
| Payout Ratio | 0 | -156.5% |
| Dividend Yield | 0 | 1.65% |
Interpretation of the Ratios
ATS Corporation
ATS shows a mixed ratio profile with 35.7% favorable and 35.7% unfavorable ratings, resulting in a neutral overall opinion. Weaknesses include negative net margin (-1.11%) and return on equity (-1.64%), alongside poor interest coverage (0.16). The company does not pay dividends, reflecting a possible reinvestment strategy or financial constraints given its negative earnings and cash flow challenges.
Columbus McKinnon Corporation
Columbus McKinnon presents a slightly favorable ratio profile with 42.9% favorable and 28.6% unfavorable scores. It has a better current ratio (1.81) and fixed asset turnover (9.07), but still reports a negative net margin (-0.53%) and return on equity (-0.58%). The company pays dividends with a modest 1.65% yield, suggesting some shareholder returns despite profit pressures.
Which one has the best ratios?
Columbus McKinnon edges ahead with a higher percentage of favorable ratios and a slightly better overall evaluation, supported by dividend payments and stronger asset turnover. ATS displays more significant profitability struggles and no dividend distribution, leading to a balanced but neutral stance in ratio assessment.
Strategic Positioning
This section compares the strategic positioning of ATS Corporation and Columbus McKinnon Corporation, focusing on market position, key segments, and exposure to technological disruption:
ATS Corporation
- Operates globally in automation solutions with broad industrial machinery focus; faces competitive pressure from diversified automation providers.
- Key segments include automation systems, engineering design, software, and post-automation services across diverse industries including life sciences and energy.
- Exposure to technological disruption through integration of connected factory floor management and digital solutions enhancing automation efficiency.
Columbus McKinnon Corporation
- Serves agricultural machinery sector with specialized intelligent motion solutions; encounters competition in material handling and lifting equipment.
- Revenue driven by hoists, conveyors, digital power control, and crane systems, serving multiple industrial and infrastructure markets.
- Faces technological changes in power and motion technology with evolving automation and diagnostic products.
ATS vs CMCO Positioning
ATS exhibits a diversified approach focused on full automation lifecycle and software, spanning multiple sectors. CMCO concentrates on material handling and motion solutions with a product-driven segmentation, offering specialized industrial equipment. ATS’s breadth contrasts with CMCO’s focused product expertise.
Which has the best competitive advantage?
Both companies are currently shedding value as ROIC is below WACC; however, CMCO shows an improving ROIC trend, suggesting increasing profitability, while ATS’s ROIC is declining, indicating a weaker competitive moat.
Stock Comparison
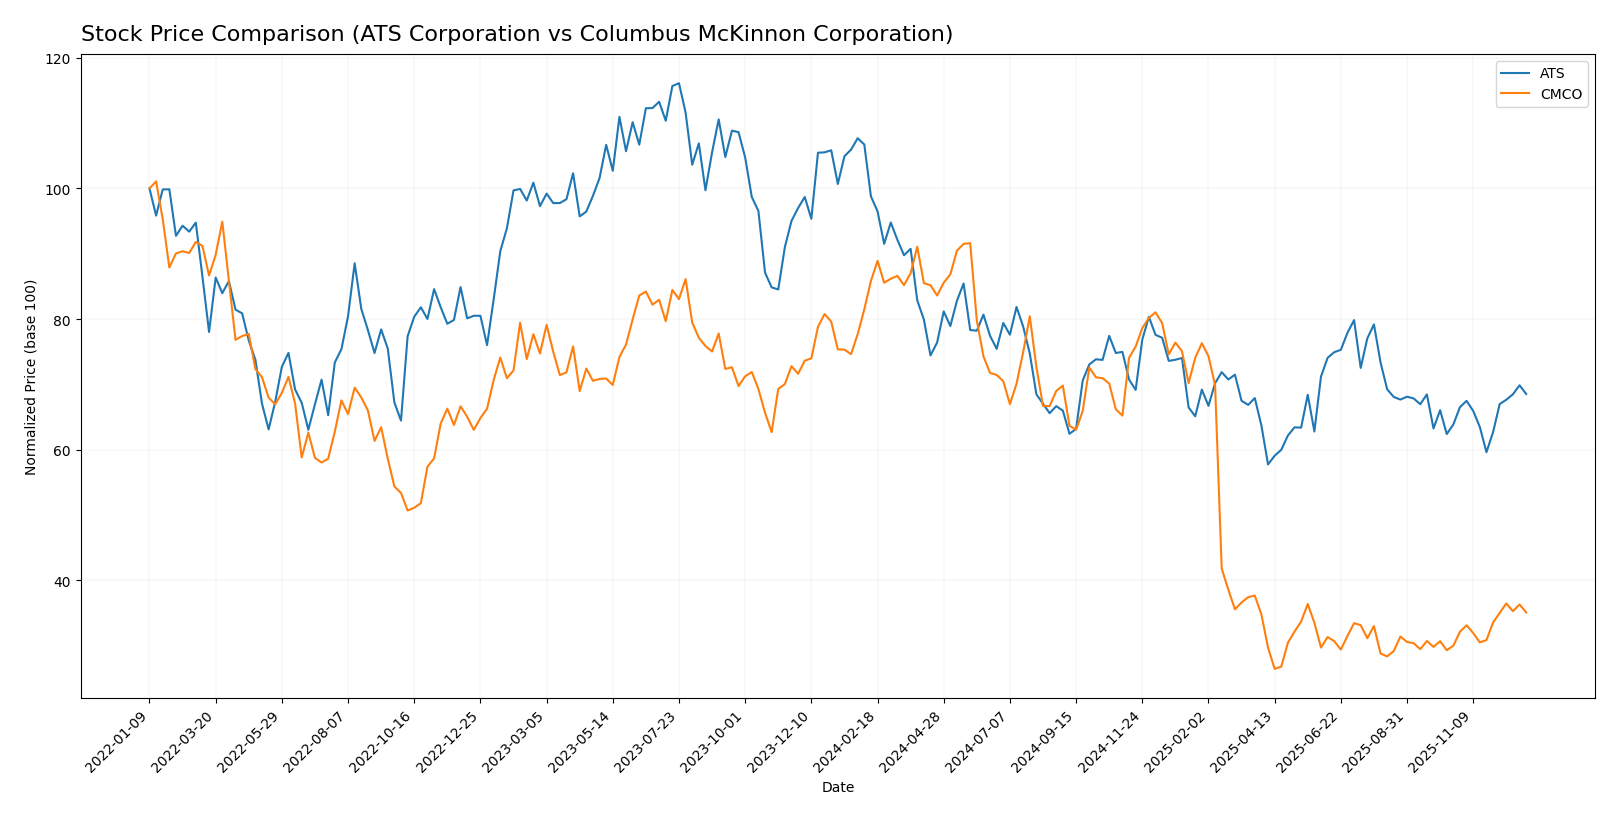
The stock prices of ATS Corporation and Columbus McKinnon Corporation have shown significant bearish trends over the past 12 months, with recent periods indicating a rebound and increased buyer dominance in trading activity.
Trend Analysis
ATS Corporation’s stock price declined by 30.62% over the past year, showing a bearish trend with acceleration. The price fluctuated between a high of 40.2 and a low of 23.5, with recent gains of 7.31% indicating a mild recovery.
Columbus McKinnon Corporation experienced a 59.11% drop over the same period, also bearish with accelerating decline and higher volatility. Recent price growth of 17.01% suggests a stronger short-term rebound than ATS.
Comparing the two, Columbus McKinnon had the steeper overall loss but the highest recent recovery, delivering greater volatility and a stronger rebound than ATS in the latest quarter.
Target Prices
Analysts present clear target price consensus for ATS Corporation and Columbus McKinnon Corporation.
| Company | Target High | Target Low | Consensus |
|---|---|---|---|
| ATS Corporation | 34 | 34 | 34 |
| Columbus McKinnon Corporation | 50 | 48 | 49 |
The consensus target prices indicate upside potential for both ATS (current price $27.89) and Columbus McKinnon (current price $17.20), signaling positive analyst expectations relative to current valuations.
Analyst Opinions Comparison
This section compares analysts’ ratings and grades for ATS Corporation and Columbus McKinnon Corporation:
Rating Comparison
ATS Rating
- Rating: C, considered very favorable overall.
- Discounted Cash Flow Score: 3, moderate valuation perspective.
- ROE Score: 1, very unfavorable efficiency in generating profit from equity.
- ROA Score: 1, very unfavorable asset utilization to generate earnings.
- Debt To Equity Score: 1, very unfavorable financial risk due to debt level.
- Overall Score: 2, moderate overall financial standing.
CMCO Rating
- Rating: B, considered very favorable overall.
- Discounted Cash Flow Score: 5, very favorable valuation perspective.
- ROE Score: 1, very unfavorable efficiency in generating profit from equity.
- ROA Score: 2, moderate asset utilization efficiency.
- Debt To Equity Score: 2, moderate financial risk from debt levels.
- Overall Score: 3, moderate overall financial standing.
Which one is the best rated?
Based strictly on the provided data, CMCO is better rated overall with a B rating and higher scores in discounted cash flow, return on assets, debt to equity, and overall score compared to ATS’s C rating and generally lower scores.
Scores Comparison
Here is a comparison of the Altman Z-Score and Piotroski Score for ATS Corporation and Columbus McKinnon Corporation:
ATS Scores
- Altman Z-Score: 1.65, indicating financial distress risk.
- Piotroski Score: 3, classified as very weak financial strength.
CMCO Scores
- Altman Z-Score: 1.40, also indicating financial distress risk.
- Piotroski Score: 8, classified as very strong financial strength.
Which company has the best scores?
Based on the data, CMCO has a lower Altman Z-Score indicating distress similar to ATS, but a much stronger Piotroski Score (8 vs. 3), suggesting better financial health overall.
Grades Comparison
Here is a comparison of the recent grades assigned to ATS Corporation and Columbus McKinnon Corporation by established grading companies:
ATS Corporation Grades
The following table shows recent grades for ATS Corporation from recognized financial institutions:
| Grading Company | Action | New Grade | Date |
|---|---|---|---|
| JP Morgan | Maintain | Neutral | 2024-08-13 |
| Goldman Sachs | Maintain | Sell | 2024-08-13 |
| JP Morgan | Maintain | Neutral | 2024-05-24 |
The grades for ATS Corporation have remained mostly neutral with Goldman Sachs maintaining a sell rating, indicating cautious sentiment.
Columbus McKinnon Corporation Grades
The following table lists recent grades for Columbus McKinnon Corporation by credible analysts:
| Grading Company | Action | New Grade | Date |
|---|---|---|---|
| DA Davidson | Downgrade | Neutral | 2025-02-11 |
| DA Davidson | Maintain | Buy | 2024-02-05 |
| DA Davidson | Maintain | Buy | 2022-10-04 |
| DA Davidson | Maintain | Buy | 2022-10-03 |
| Barrington Research | Maintain | Outperform | 2022-07-29 |
| Barrington Research | Maintain | Outperform | 2022-07-28 |
| JP Morgan | Downgrade | Neutral | 2022-05-26 |
| Barrington Research | Maintain | Outperform | 2022-05-26 |
| Barrington Research | Maintain | Outperform | 2022-05-25 |
| JP Morgan | Downgrade | Neutral | 2022-05-25 |
Columbus McKinnon Corporation’s grades show a shift from previous buy and outperform ratings to more recent neutral downgrades, reflecting a more cautious outlook.
Which company has the best grades?
Columbus McKinnon has historically received stronger buy and outperform grades compared to ATS Corporation’s neutral and sell ratings. This suggests that investors might have seen more growth potential previously in Columbus McKinnon, though its recent downgrades indicate increased caution relative to ATS’s stable neutral stance.
Strengths and Weaknesses
Below is a comparison table highlighting the key strengths and weaknesses of ATS Corporation and Columbus McKinnon Corporation based on the latest financial and operational data.
| Criterion | ATS Corporation | Columbus McKinnon Corporation |
|---|---|---|
| Diversification | Limited product segmentation — mainly focused | Broad product range including hoists, conveyors, cranes, and digital control systems |
| Profitability | Negative net margin (-1.11%), ROIC slightly positive but below WACC; value destroying | Negative net margin (-0.53%), ROIC positive but below WACC; improving profitability trend |
| Innovation | No specific data on innovation; declining ROIC trend suggests challenges | Growing ROIC trend indicates improving operational efficiency and potential innovation impact |
| Global presence | Not prominently diversified globally | Likely broader global footprint due to diversified product lines and industrial applications |
| Market Share | Data limited; appears challenged by declining profitability | Strong position in hoists and conveyor systems, representing significant market share in niche industrial equipment |
Key takeaways: ATS Corporation faces significant profitability challenges and is currently destroying value with a declining return on invested capital, indicating caution. Columbus McKinnon shows signs of recovery with improving profitability and a well-diversified product portfolio supporting its market position.
Risk Analysis
Below is a comparative table of key risks for ATS Corporation and Columbus McKinnon Corporation based on the most recent data from 2025 and 2024 respectively:
| Metric | ATS Corporation | Columbus McKinnon Corporation |
|---|---|---|
| Market Risk | Beta 1.27, moderate volatility | Beta 1.29, moderate volatility |
| Debt level | Debt to Assets 36.8%, neutral | Debt to Assets 31.1%, neutral |
| Regulatory Risk | Moderate, global industrial | Moderate, US industrial sector |
| Operational Risk | Unfavorable interest coverage | Unfavorable interest coverage |
| Environmental Risk | Industry exposure, moderate | Industry exposure, moderate |
| Geopolitical Risk | Canadian base, global markets | US base, global markets |
The most impactful risks are operational, highlighted by very low interest coverage ratios for both companies, indicating difficulty covering interest expenses. Both firms operate in industrial sectors with moderate market and regulatory risks. ATS shows weaker profitability and financial health, increasing its vulnerability. Columbus McKinnon’s higher Piotroski score suggests stronger financial resilience despite similar market risks.
Which Stock to Choose?
ATS Corporation shows a declining income trend with a 16.47% revenue drop last year and unfavorable net margin and profitability ratios, including a negative ROE of -1.64%. Its debt levels are neutral, but the overall rating is moderate with some very unfavorable financial scores.
Columbus McKinnon Corporation exhibits a smaller revenue decline of 4.98% last year and also records negative net margin and ROE, though its profitability ratios are slightly better than ATS. Debt metrics are neutral, and the overall rating is moderate but slightly more favorable than ATS.
Investors seeking potential value creation might find CMCO’s improving ROIC trend and slightly favorable ratios more appealing, while those more cautious could see ATS’s neutral ratio evaluation and very unfavorable profitability as a risk signal. The choice could depend on whether an investor prioritizes improving profitability or stable financial ratios.
Disclaimer: Investment carries a risk of loss of initial capital. The past performance is not a reliable indicator of future results. Be sure to understand risks before making an investment decision.
Go Further
I encourage you to read the complete analyses of ATS Corporation and Columbus McKinnon Corporation to enhance your investment decisions: