In the evolving landscape of regulated gas utilities, Atmos Energy Corporation (ATO) and NiSource Inc. (NI) stand out as prominent players with significant market presence. Both companies serve millions of customers across multiple states, combining traditional gas distribution with strategic innovation in energy management. This comparison explores their strengths and growth prospects to help you identify which company offers the most compelling investment opportunity in 2026. Let’s dive into their profiles and potential.
Table of contents
Companies Overview
I will begin the comparison between Atmos Energy Corporation and NiSource Inc. by providing an overview of these two companies and their main differences.
Atmos Energy Corporation Overview
Atmos Energy Corporation operates in the regulated gas industry, focusing on natural gas distribution, pipeline, and storage businesses in the US. The company serves around three million customers across eight states, managing nearly 72,000 miles of underground distribution and transmission mains. Atmos’ pipeline segment supports third-party gas transport and storage, with 5,699 miles of transmission lines and five storage reservoirs in Texas.
NiSource Inc. Overview
NiSource Inc. is an energy holding company that provides regulated natural gas and electric utility services in the US. It distributes gas to over 3.2 million customers across multiple states and operates more than 54,600 miles of distribution mains. NiSource also generates and distributes electricity to approximately 483,000 customers, owning diverse generating assets including coal, natural gas, hydro, and wind power facilities with varying capacities.
Key similarities and differences
Both companies operate primarily in the regulated gas sector, distributing natural gas to millions of customers within the United States. However, NiSource also operates an electric utility segment with substantial power generation assets, unlike Atmos, which focuses solely on gas distribution, pipeline, and storage. Additionally, NiSource has a larger employee base and a broader geographic footprint in terms of services offered.
Income Statement Comparison
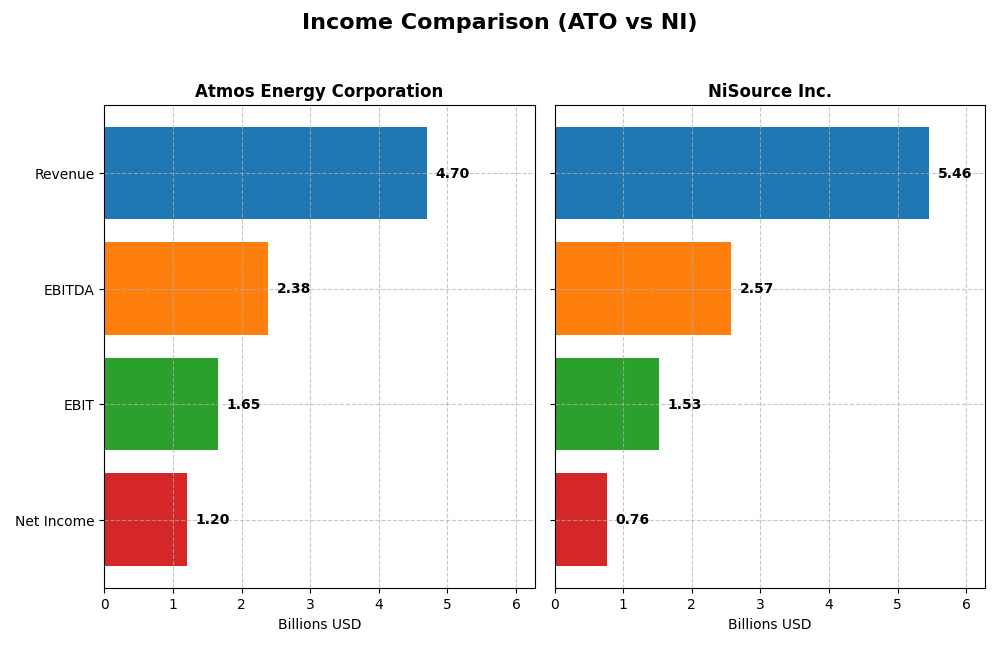
This table compares the key income statement metrics for Atmos Energy Corporation and NiSource Inc. based on the most recent fiscal year data available.
| Metric | Atmos Energy Corporation (ATO) | NiSource Inc. (NI) |
|---|---|---|
| Market Cap | 27B | 19.8B |
| Revenue | 4.7B | 5.5B |
| EBITDA | 2.38B | 2.57B |
| EBIT | 1.65B | 1.53B |
| Net Income | 1.2B | 760M |
| EPS | 7.54 | 1.63 |
| Fiscal Year | 2025 | 2024 |
Income Statement Interpretations
Atmos Energy Corporation
Atmos Energy Corporation’s revenue grew steadily from $3.41B in 2021 to $4.70B in 2025, with net income increasing from $665M to $1.20B over the same period. Margins improved notably, with a 25.49% net margin in 2025 and a favorable EBIT margin of 35.08%. The recent year showed strong revenue growth of 12.91% and a 15.65% rise in EBIT, indicating accelerating profitability.
NiSource Inc.
NiSource Inc. experienced moderate revenue growth overall, rising from $4.69B in 2020 to $5.46B in 2024, though revenue declined slightly by 0.91% in the latest year. Net income increased significantly, from a loss in 2020 to $760M in 2024, supported by improving margins. The net margin stood at 13.94% in 2024, up 7.44% year-over-year, reflecting better operational efficiency despite higher interest expenses.
Which one has the stronger fundamentals?
Atmos Energy exhibits stronger fundamentals with higher and improving margins, consistent revenue growth, and substantial net income gains. NiSource shows solid net income growth and margin improvements but faces pressure from declining recent revenue and neutral interest expense impact. Overall, Atmos Energy’s favorable margin expansion and revenue acceleration suggest more robust income statement fundamentals.
Financial Ratios Comparison
The table below presents a side-by-side comparison of key financial ratios for Atmos Energy Corporation (ATO) and NiSource Inc. (NI) based on their most recent fiscal year data.
| Ratios | Atmos Energy Corporation (2025) | NiSource Inc. (2024) |
|---|---|---|
| ROE | 8.84% | 8.76% |
| ROIC | 4.58% | 4.15% |
| P/E | 22.64 | 21.96 |
| P/B | 2.00 | 1.92 |
| Current Ratio | 0.67 | 0.51 |
| Quick Ratio | 0.53 | 0.41 |
| D/E (Debt-to-Equity) | 0.69 | 1.61 |
| Debt-to-Assets | 32.19% | 43.92% |
| Interest Coverage | 9.09 | 2.81 |
| Asset Turnover | 0.16 | 0.17 |
| Fixed Asset Turnover | 0.18 | 0.21 |
| Payout Ratio | 46.19% | 64.33% |
| Dividend Yield | 2.04% | 2.93% |
Interpretation of the Ratios
Atmos Energy Corporation
Atmos Energy shows mixed financial ratios, with favorable net margin (25.49%) and interest coverage (9.61), but weaker return on equity (8.84%) and return on invested capital (4.58%). Liquidity ratios are below 1, indicating potential short-term risk. The company offers a dividend yield of 2.04%, supported by a stable payout, though cash flow coverage appears strained.
NiSource Inc.
NiSource has a lower net margin (13.94%) and interest coverage (2.95), with debt-to-equity at 1.61, considered unfavorable. Return on equity (8.76%) and return on invested capital (4.15%) are also weak. Liquidity ratios are low, signaling short-term challenges. Its dividend yield is higher at 2.93%, but debt levels and coverage raise concerns about sustainability.
Which one has the best ratios?
Both companies have slightly unfavorable overall ratios, with Atmos Energy showing stronger profitability and interest coverage but weaker liquidity, while NiSource carries higher debt and weaker coverage despite a higher dividend yield. Each exhibits trade-offs, making neither clearly superior based solely on these ratios.
Strategic Positioning
This section compares the strategic positioning of Atmos Energy Corporation and NiSource Inc. across Market position, Key segments, and Exposure to technological disruption:
Atmos Energy Corporation
- Established regulated gas distributor with 3M customers in 8 states; faces typical utility competition.
- Focuses on natural gas distribution and pipeline/storage; two main segments drive revenue.
- Operates underground pipelines and storage reservoirs; no explicit data on technology disruption risk.
NiSource Inc.
- Regulated natural gas and electric utility serving ~3.25M gas and 483K electric customers across several states.
- Operates gas distribution and electric operations; diversified energy offerings including coal, gas, hydro, and wind generation.
- Involved in multiple generation technologies; no direct indication of disruption exposure in data provided.
Atmos Energy Corporation vs NiSource Inc. Positioning
Atmos Energy concentrates on regulated gas distribution and pipeline operations, serving fewer states and customers. NiSource is more diversified with both gas and electric segments, including various generation assets, offering broader but more complex operations.
Which has the best competitive advantage?
Both companies are shedding value with ROIC below WACC but show growing profitability trends. Their economic moats are slightly unfavorable, indicating limited sustainable competitive advantage based on current capital efficiency.
Stock Comparison
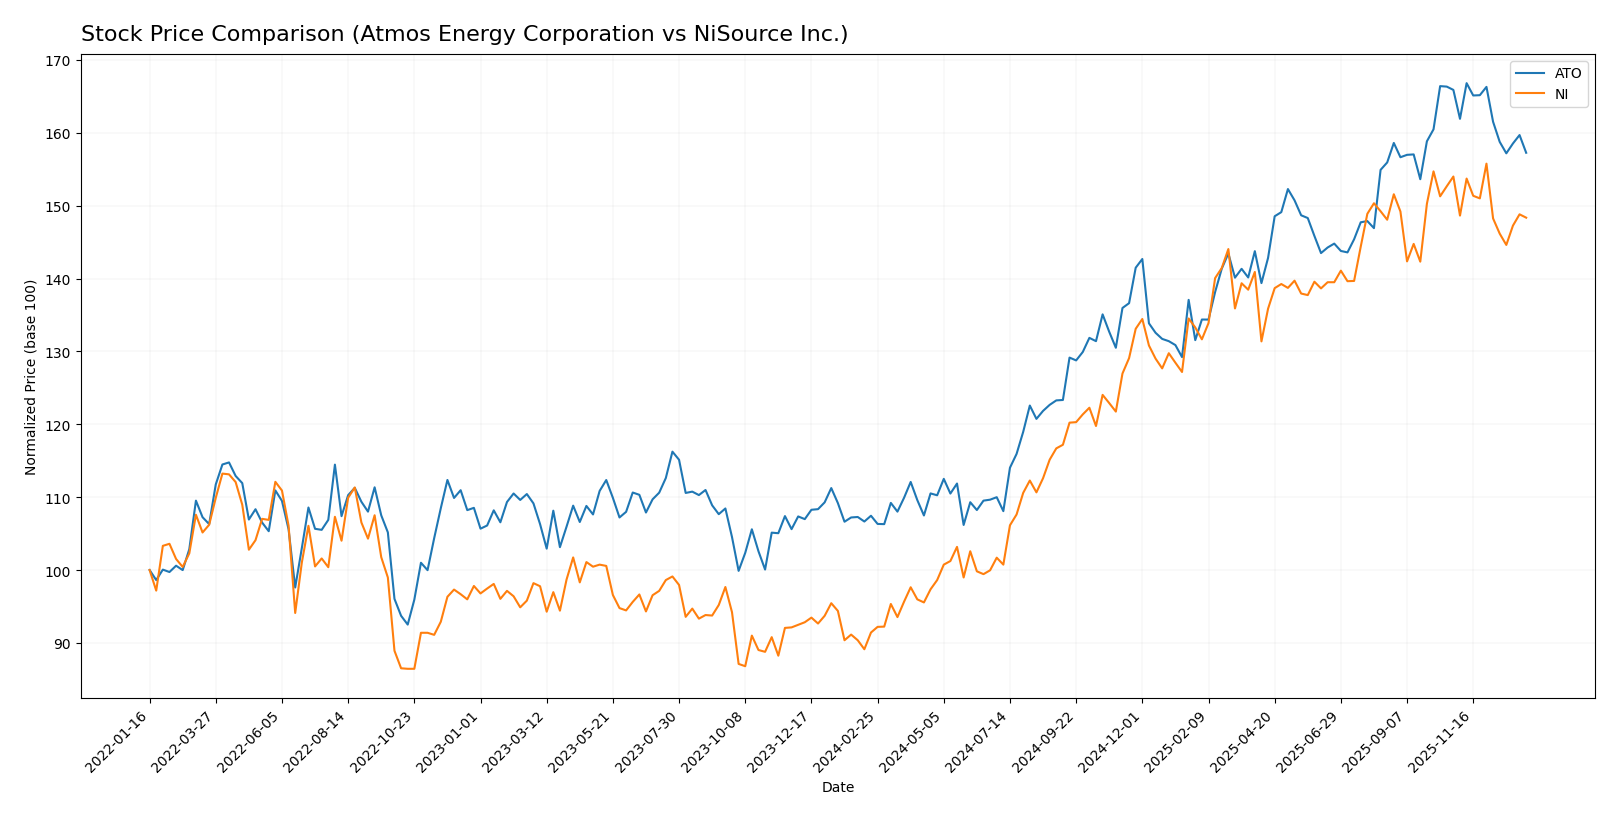
The stock price movements of Atmos Energy Corporation and NiSource Inc. over the past year reveal strong bullish trends with recent decelerations and slight downward corrections in the last quarter, reflecting dynamic trading behaviors and shifting buyer-seller dominance.
Trend Analysis
Atmos Energy Corporation (ATO) exhibited a bullish trend over the past 12 months with a 46.36% price increase, accompanied by high volatility (std deviation 19.65) and decelerating momentum, followed by a recent 5.2% decline signaling short-term weakness.
NiSource Inc. (NI) showed a stronger bullish trend with a 62.28% price gain over the year, lower volatility (std deviation 5.45), and decelerating acceleration; a recent 3.67% price drop reflects a mild correction phase.
Comparing the two, NiSource Inc. delivered the highest market performance with a larger overall price increase of 62.28%, outperforming Atmos Energy’s 46.36% gain over the past 12 months.
Target Prices
Analysts present a confident target price consensus for Atmos Energy Corporation and NiSource Inc.
| Company | Target High | Target Low | Consensus |
|---|---|---|---|
| Atmos Energy Corporation | 180 | 172 | 174 |
| NiSource Inc. | 50 | 45 | 47 |
The consensus target prices for both companies exceed their current stock prices, suggesting moderate upside potential and positive analyst sentiment in the regulated gas sector. Atmos Energy’s consensus at 174 compares to a current price near 167, while NiSource’s 47 target exceeds its current price of 42.
Analyst Opinions Comparison
This section compares analysts’ ratings and grades for Atmos Energy Corporation and NiSource Inc.:
Rating Comparison
ATO Rating
- Rating: B+, indicating a very favorable overall evaluation.
- Discounted Cash Flow Score: 4, a favorable score showing good cash flow value.
- ROE Score: 3, moderate efficiency in generating profit from equity.
- ROA Score: 4, favorable use of assets to generate earnings.
- Debt To Equity Score: 3, moderate financial risk with balanced debt levels.
NI Rating
- Rating: C+, also noted as very favorable overall evaluation.
- Discounted Cash Flow Score: 1, very unfavorable, indicating poor valuation.
- ROE Score: 3, moderate efficiency in profit generation from equity.
- ROA Score: 3, moderate asset utilization to generate earnings.
- Debt To Equity Score: 2, moderate financial risk with somewhat higher debt.
Which one is the best rated?
Based strictly on the provided data, Atmos Energy (ATO) holds a better rating with a B+ and stronger discounted cash flow and ROA scores, while NiSource (NI) has a lower C+ rating and a notably weak discounted cash flow score.
Scores Comparison
Here is a comparison of the Altman Z-Score and Piotroski Score for Atmos Energy Corporation and NiSource Inc.:
ATO Scores
- Altman Z-Score: 1.63, placing ATO in the distress zone indicating higher bankruptcy risk.
- Piotroski Score: 5, categorized as average financial strength.
NI Scores
- Altman Z-Score: 0.78, placing NI in the distress zone with elevated bankruptcy risk.
- Piotroski Score: 7, indicating strong financial health.
Which company has the best scores?
NiSource shows a lower Altman Z-Score but a higher Piotroski Score than Atmos Energy, indicating comparatively stronger financial health based on these metrics.
Grades Comparison
Here is a comparison of the most recent grades assigned by reputable grading companies for both Atmos Energy Corporation and NiSource Inc.:
Atmos Energy Corporation Grades
This table summarizes recent grades and rating actions from major financial institutions for Atmos Energy Corporation.
| Grading Company | Action | New Grade | Date |
|---|---|---|---|
| UBS | Maintain | Neutral | 2025-12-17 |
| Morgan Stanley | Downgrade | Equal Weight | 2025-12-16 |
| Mizuho | Maintain | Neutral | 2025-12-02 |
| Morgan Stanley | Maintain | Overweight | 2025-10-22 |
| B of A Securities | Downgrade | Neutral | 2025-10-16 |
| Mizuho | Maintain | Neutral | 2025-09-26 |
| Morgan Stanley | Maintain | Overweight | 2025-09-25 |
| Ladenburg Thalmann | Downgrade | Neutral | 2025-08-08 |
| UBS | Maintain | Neutral | 2025-07-30 |
| Barclays | Maintain | Equal Weight | 2025-07-10 |
Overall, Atmos Energy Corporation’s grades show a general trend toward neutral and equal weight ratings, with several downgrades from buy or overweight to neutral in recent months.
NiSource Inc. Grades
Below is a summary of recent grades and rating changes from established grading firms for NiSource Inc.
| Grading Company | Action | New Grade | Date |
|---|---|---|---|
| UBS | Maintain | Buy | 2025-12-17 |
| Mizuho | Maintain | Outperform | 2025-12-04 |
| Jefferies | Upgrade | Buy | 2025-10-31 |
| Evercore ISI Group | Maintain | In Line | 2025-10-30 |
| Barclays | Maintain | Overweight | 2025-10-21 |
| Evercore ISI Group | Maintain | In Line | 2025-10-20 |
| BMO Capital | Maintain | Outperform | 2025-09-29 |
| Jefferies | Downgrade | Hold | 2025-09-05 |
| Barclays | Maintain | Overweight | 2025-08-04 |
| Guggenheim | Maintain | Buy | 2025-05-08 |
NiSource Inc. maintains mostly buy, outperform, and overweight ratings, with only one recent downgrade from buy to hold, indicating a generally positive sentiment.
Which company has the best grades?
NiSource Inc. has received stronger and more consistent buy and outperform ratings compared to Atmos Energy Corporation’s neutral and equal weight consensus. This may reflect a more favorable outlook among analysts, potentially influencing investor confidence and portfolio positioning.
Strengths and Weaknesses
Below is a comparative overview of key strengths and weaknesses for Atmos Energy Corporation (ATO) and NiSource Inc. (NI) based on the most recent data available.
| Criterion | Atmos Energy Corporation (ATO) | NiSource Inc. (NI) |
|---|---|---|
| Diversification | Primarily focused on natural gas distribution and pipeline/storage segments, limited diversification. | More diversified with electric and gas distribution operations. |
| Profitability | Net margin strong at 25.49%, but ROIC (4.58%) below WACC (6.27%), indicating value destruction despite growth. | Lower net margin at 13.94%, ROIC (4.15%) also below WACC (5.17%), value destruction but improving profitability. |
| Innovation | Limited data on innovation; asset turnover low (0.16), suggesting operational efficiency challenges. | Similar low asset turnover (0.17), indicating potential operational inefficiencies. |
| Global presence | Primarily US-focused energy distribution, no significant global footprint. | Also primarily focused in the US market with no global operations. |
| Market Share | Strong in natural gas distribution within its regions, stable revenue growth in distribution segment. | Significant market share in both gas and electric operations, with higher revenue in gas distribution. |
Key takeaways: Both companies show improving profitability but are currently destroying value as ROIC remains below WACC. NiSource benefits from better diversification with electric operations, while Atmos Energy maintains stronger net margins. Operational efficiency and global presence are limited for both, requiring cautious investment consideration.
Risk Analysis
Below is a comparative table summarizing key risks for Atmos Energy Corporation (ATO) and NiSource Inc. (NI) based on the latest available data from 2025 and 2024 respectively.
| Metric | Atmos Energy Corporation (ATO) | NiSource Inc. (NI) |
|---|---|---|
| Market Risk | Moderate beta (0.76), stable natural gas demand | Lower beta (0.65), diversified energy (gas & electric) exposure |
| Debt level | Moderate debt-to-equity (0.69), interest coverage strong (9.61x) | Higher debt-to-equity (1.61), weaker interest coverage (2.95x) |
| Regulatory Risk | Regulated gas utilities in 8 states, sensitive to policy changes | Regulated gas and electric utilities across multiple states, complex regulatory environment |
| Operational Risk | Extensive pipeline network (77,620 miles), maintenance critical | Large pipeline and generation assets, including coal and gas plants, risk of outages |
| Environmental Risk | Moderate, natural gas focus with some pipeline emissions concerns | Higher, coal-fired generation impacts and transition risks to cleaner energy |
| Geopolitical Risk | Low; US-focused operations | Low; US-focused operations but with broader state footprint |
In synthesis, NiSource exhibits higher financial risk due to elevated debt and lower interest coverage, alongside environmental risks linked to coal assets. Atmos Energy’s risks are more operational and regulatory but with stronger financial stability. The most impactful risk for both remains regulatory changes affecting utility rates and infrastructure investments. NiSource’s financial leverage warrants cautious monitoring.
Which Stock to Choose?
Atmos Energy Corporation (ATO) shows a favorable income evolution with 12.91% revenue growth in 2025 and strong profitability metrics, including a 25.49% net margin. Its financial ratios reveal a slightly unfavorable global stance due to moderate debt and liquidity concerns, but it carries a very favorable B+ rating.
NiSource Inc. (NI) presents a favorable income statement overall, despite a slight revenue decline of 0.91% in 2024. Profitability remains solid with a 13.94% net margin. Its financial ratios are slightly less favorable than ATO’s, with higher leverage and moderate coverage, reflected in a C+ rating.
For investors, ATO might appear more suitable for those prioritizing stable income growth and stronger ratings, while NI could be considered by those tolerant of higher leverage but attracted by its improving profitability trend. Both companies exhibit slightly unfavorable moats, indicating value destruction despite increasing ROIC.
Disclaimer: Investment carries a risk of loss of initial capital. The past performance is not a reliable indicator of future results. Be sure to understand risks before making an investment decision.
Go Further
I encourage you to read the complete analyses of Atmos Energy Corporation and NiSource Inc. to enhance your investment decisions: