In the fast-evolving world of enterprise software, Workday, Inc. and Atlassian Corporation stand out as influential players shaping how businesses operate and innovate. Both companies offer cloud-based application solutions targeting overlapping markets in technology and business management, yet they pursue distinct innovation strategies. This article will analyze their strengths and risks to help you decide which stock fits best in your investment portfolio.
Table of contents
Companies Overview
I will begin the comparison between Workday, Inc. and Atlassian Corporation by providing an overview of these two companies and their main differences.
Workday Overview
Workday, Inc. offers enterprise cloud applications primarily focused on financial management, human capital management, and analytics. Its solutions help organizations plan, execute, and analyze business operations with real-time insights. Headquartered in Pleasanton, California, Workday serves diverse sectors including healthcare, education, and financial services, positioning itself as a comprehensive provider of cloud-based business management software.
Atlassian Overview
Atlassian Corporation, based in Sydney, Australia, develops software products designed to improve team collaboration and project management. Its portfolio includes Jira, Confluence, Trello, and other tools that connect technical and business teams. Atlassian’s products focus on agility, security, and developer experience, catering to enterprises worldwide seeking enhanced productivity and streamlined workflows through cloud and on-premises solutions.
Key similarities and differences
Both companies operate in the software application industry with cloud-based offerings targeting enterprise customers. While Workday emphasizes financial and human capital management, Atlassian focuses on team collaboration and project management software. Workday’s solutions are geared towards operational efficiency and financial insights, whereas Atlassian prioritizes agile workflows and developer tools, reflecting complementary but distinct business models within the technology sector.
Income Statement Comparison
This table compares key income statement metrics for Workday, Inc. and Atlassian Corporation for their most recent fiscal years.
| Metric | Workday, Inc. (WDAY) | Atlassian Corporation (TEAM) |
|---|---|---|
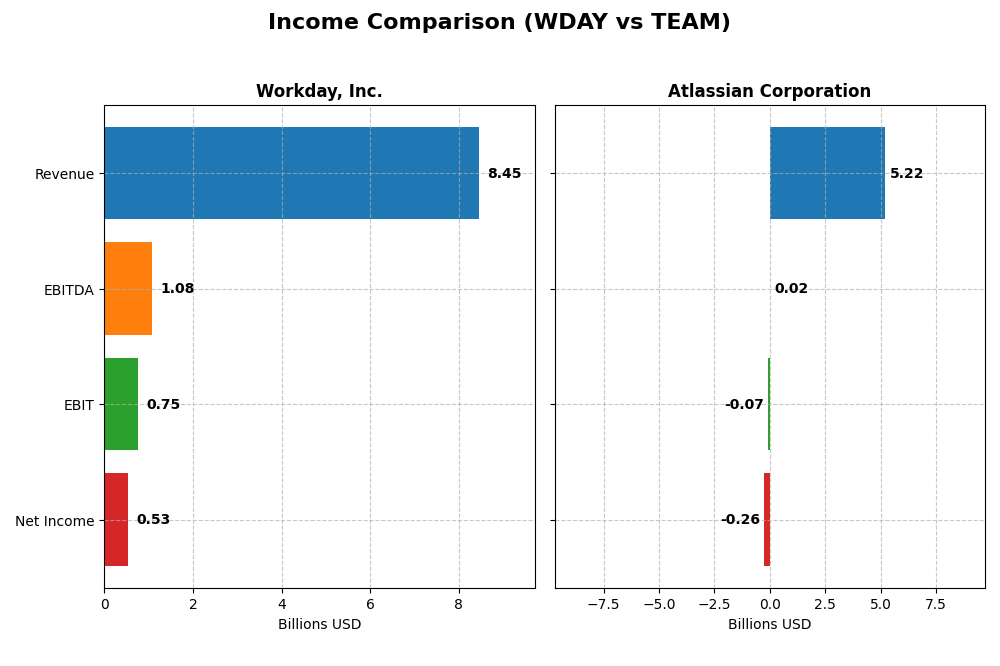
| Market Cap | 49.9B | 31.1B |
| Revenue | 8.45B (2025) | 5.22B (2025) |
| EBITDA | 1.08B (2025) | 24.0M (2025) |
| EBIT | 752M (2025) | -68.3M (2025) |
| Net Income | 526M (2025) | -257M (2025) |
| EPS | 1.98 (2025) | -0.98 (2025) |
| Fiscal Year | 2025 | 2025 |
Income Statement Interpretations
Workday, Inc.
Workday’s revenue nearly doubled from 4.3B in 2021 to 8.4B in 2025, with net income recovering from losses in 2021 to 526M in 2025. Gross margin remained strong at 75.5%, and EBIT margin stabilized around 8.9%. Despite a 16.4% revenue growth in 2025, net margin declined by 67.3%, signaling margin pressure in the latest year.
Atlassian Corporation
Atlassian’s revenue rose significantly from 2.1B in 2021 to 5.2B in 2025, with net losses narrowing from -579M to -257M. Gross margin improved to 82.8%, but EBIT margin stayed negative at -1.3%. The 2025 year saw a 19.7% revenue increase coupled with a 28.6% net margin improvement, showing progress despite ongoing profitability challenges.
Which one has the stronger fundamentals?
Workday demonstrates stronger fundamentals with higher profitability margins and substantial net income growth over the period, despite recent net margin contraction. Atlassian exhibits impressive revenue growth and margin improvement but continues to operate at a net loss with a negative EBIT margin. Both companies show favorable overall income statement trends, yet Workday’s positive net income and margins suggest more robust financial fundamentals.
Financial Ratios Comparison
The table below presents a side-by-side comparison of key financial ratios for Workday, Inc. and Atlassian Corporation, based on their most recent fiscal year data to aid in evaluating their financial performance metrics.
| Ratios | Workday, Inc. (WDAY) | Atlassian Corporation (TEAM) |
|---|---|---|
| ROE | 5.82% | -19.08% |
| ROIC | 2.73% | -4.48% |
| P/E | 132.15 | -207.13 |
| P/B | 7.69 | 39.51 |
| Current Ratio | 1.85 | 1.22 |
| Quick Ratio | 1.85 | 1.22 |
| D/E | 0.37 | 0.92 |
| Debt-to-Assets | 18.70% | 20.51% |
| Interest Coverage | 3.64 | -4.27 |
| Asset Turnover | 0.47 | 0.86 |
| Fixed Asset Turnover | 5.36 | 19.02 |
| Payout ratio | 0 | 0 |
| Dividend yield | 0 | 0 |
Interpretation of the Ratios
Workday, Inc.
Workday shows a mixed ratio profile with favorable liquidity (current and quick ratios at 1.85) and debt management (debt-to-equity 0.37, interest coverage 6.6), but unfavorable profitability metrics such as ROE at 5.82% and ROIC at 2.73%. Valuation ratios like P/E (132.15) and P/B (7.69) are also concerning. The company does not pay dividends, likely reflecting a reinvestment strategy or growth focus.
Atlassian Corporation
Atlassian’s ratios reveal unfavorable profitability with negative net margin (-4.92%), ROE (-19.08%), and ROIC (-4.48%), while liquidity is neutral to favorable (current ratio 1.22, quick ratio 1.22). The debt-to-assets ratio (20.51%) and fixed asset turnover (19.02) are positive, but interest coverage is negative (-2.24). Like Workday, Atlassian pays no dividends, possibly due to ongoing expansion and reinvestment priorities.
Which one has the best ratios?
Workday’s financial ratios present a more balanced outlook with stronger liquidity and debt coverage, despite weak profitability and high valuation multiples. Atlassian shows weaker profitability and interest coverage, though it benefits from better asset turnover and moderate liquidity. Overall, Workday’s ratios are judged neutral, whereas Atlassian’s are slightly unfavorable, reflecting differing financial strengths and concerns.
Strategic Positioning
This section compares the strategic positioning of Workday, Inc. and Atlassian Corporation, focusing on Market position, Key segments, and Exposure to technological disruption:
Workday, Inc.
- Large market cap near $50B with moderate competitive pressure in enterprise cloud applications.
- Revenue driven mainly by subscription services ($7.7B FY2025) and professional services ($728M FY2025).
- Offers cloud-based financial management, HCM, analytics with machine learning, focusing on enterprise efficiency.
Atlassian Corporation
- Mid-sized market cap around $31B, faces competitive pressure in software collaboration tools.
- Revenue from licenses and services ($4.9B FY2025), plus other product and maintenance offerings.
- Provides project management, collaboration, and developer tools, focusing on team productivity software.
Workday vs Atlassian Positioning
Workday pursues a diversified approach with broad enterprise applications including finance and HR, generating most revenue from subscription services. Atlassian concentrates on collaborative and developer tools, relying heavily on license and service revenues. Workday targets large enterprises; Atlassian serves cross-functional teams.
Which has the best competitive advantage?
Both companies are currently shedding value relative to cost of capital. Workday shows improving profitability with growing ROIC, while Atlassian experiences declining ROIC. Workday’s slightly unfavorable moat indicates a more resilient competitive advantage than Atlassian’s very unfavorable position.
Stock Comparison
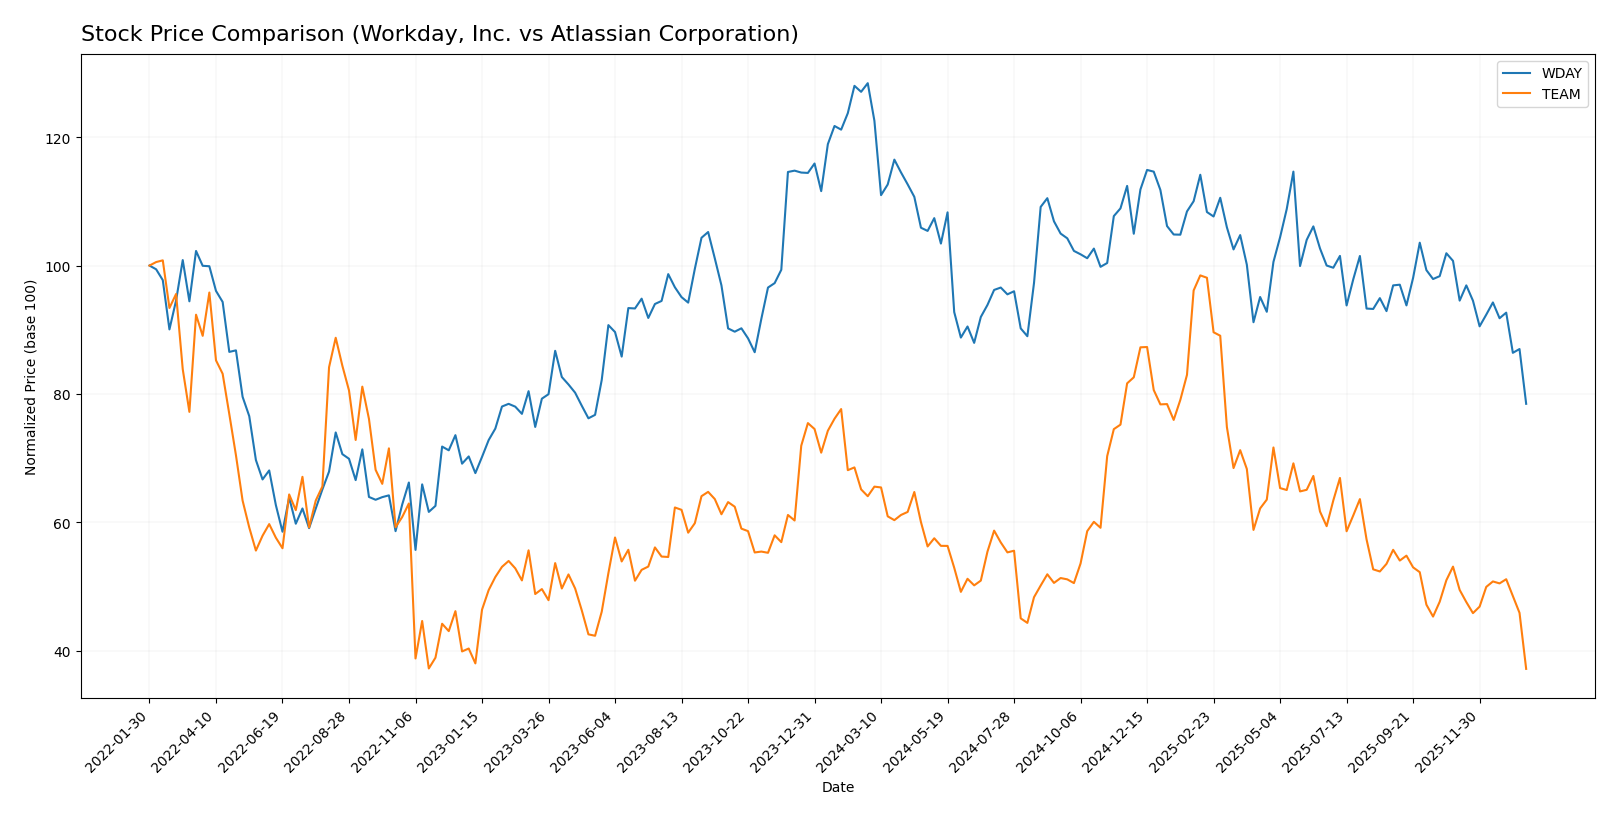
The stock price movements of Workday, Inc. and Atlassian Corporation over the past 12 months reveal notable bearish trends marked by significant declines and deceleration in price changes.
Trend Analysis
Workday, Inc. (WDAY) has experienced a bearish trend over the past year with a 38.91% price decline and decelerating downward momentum. Price volatility measured by a 20.22 std deviation reflects moderate fluctuations between a high of 305.88 and a low of 186.86.
Atlassian Corporation (TEAM) shows a steeper bearish trend with a 42.01% price drop and deceleration. Its higher volatility, indicated by a 41.22 std deviation, corresponds to larger price swings between 314.28 and 118.55.
Comparing both stocks, Atlassian’s steeper decline resulted in lower market performance than Workday over the analyzed period. Both exhibit persistent selling pressure and recent volume dominance by sellers.
Target Prices
The current analyst consensus suggests a positive outlook for both Workday, Inc. and Atlassian Corporation, with substantial upside potential from their current stock prices.
| Company | Target High | Target Low | Consensus |
|---|---|---|---|
| Workday, Inc. | 320 | 235 | 274.47 |
| Atlassian Corporation | 290 | 185 | 234.14 |
Analysts expect Workday’s stock to trade well above its current price of $186.86, indicating strong growth prospects. Atlassian’s consensus target of $234.14 also suggests significant upside from its current $118.55 price.
Analyst Opinions Comparison
This section compares analysts’ ratings and grades for Workday, Inc. (WDAY) and Atlassian Corporation (TEAM):
Rating Comparison
WDAY Rating
- Rating: B- indicating a very favorable overall rating.
- Discounted Cash Flow Score: 4, favorable valuation.
- ROE Score: 3, moderate efficiency in generating profit.
- ROA Score: 3, moderate asset utilization.
- Debt To Equity Score: 2, moderate financial risk.
TEAM Rating
- Rating: C indicating a very favorable overall rating.
- Discounted Cash Flow Score: 5, very favorable valuation.
- ROE Score: 1, very unfavorable profit generation.
- ROA Score: 1, very unfavorable asset utilization.
- Debt To Equity Score: 1, very unfavorable financial risk.
Which one is the best rated?
Based strictly on the data, WDAY holds a higher rating (B-) compared to TEAM’s (C). TEAM has a stronger discounted cash flow score but weaker scores in ROE, ROA, and debt to equity, affecting its overall rating.
Scores Comparison
Here is a comparison of the financial health scores of Workday, Inc. and Atlassian Corporation:
WDAY Scores
- Altman Z-Score: 4.41, indicating a safe zone with low bankruptcy risk.
- Piotroski Score: 6, representing average financial strength.
TEAM Scores
- Altman Z-Score: 4.70, indicating a safe zone with low bankruptcy risk.
- Piotroski Score: 5, representing average financial strength.
Which company has the best scores?
Both companies are in the safe zone for Altman Z-Score, with TEAM slightly higher at 4.70 versus WDAY’s 4.41. WDAY has a marginally better Piotroski Score of 6 compared to TEAM’s 5, indicating slightly stronger financial health.
Grades Comparison
The following is a comparison of recent grades assigned to Workday, Inc. and Atlassian Corporation by several reputable grading companies:
Workday, Inc. Grades
This table summarizes the latest grades assigned to Workday, Inc. by major financial institutions.
| Grading Company | Action | New Grade | Date |
|---|---|---|---|
| Barclays | Maintain | Overweight | 2026-01-12 |
| RBC Capital | Maintain | Outperform | 2026-01-05 |
| TD Cowen | Maintain | Buy | 2025-11-26 |
| DA Davidson | Maintain | Neutral | 2025-11-26 |
| Wells Fargo | Maintain | Overweight | 2025-11-26 |
| Barclays | Maintain | Overweight | 2025-11-26 |
| Keybanc | Maintain | Overweight | 2025-11-26 |
| Citigroup | Maintain | Neutral | 2025-11-26 |
| JP Morgan | Maintain | Overweight | 2025-11-26 |
| UBS | Maintain | Neutral | 2025-11-26 |
Workday’s grades consistently reflect a generally positive outlook, with a majority of overweight and buy ratings and several neutral assessments.
Atlassian Corporation Grades
Here is a summary of recent grades provided to Atlassian Corporation by recognized grading firms.
| Grading Company | Action | New Grade | Date |
|---|---|---|---|
| BTIG | Maintain | Buy | 2026-01-13 |
| Piper Sandler | Maintain | Overweight | 2026-01-05 |
| Bernstein | Maintain | Outperform | 2025-11-18 |
| Macquarie | Maintain | Outperform | 2025-11-03 |
| Mizuho | Maintain | Outperform | 2025-10-31 |
| Bernstein | Maintain | Outperform | 2025-10-31 |
| TD Cowen | Maintain | Hold | 2025-10-27 |
| BMO Capital | Maintain | Outperform | 2025-10-24 |
| UBS | Maintain | Neutral | 2025-10-24 |
| Keybanc | Maintain | Overweight | 2025-10-23 |
Atlassian’s grades predominantly show outperform and buy ratings, indicating a strong positive consensus among analysts.
Which company has the best grades?
Both Workday and Atlassian have positive consensus ratings classified as “Buy.” However, Atlassian displays a higher frequency of “Outperform” ratings, suggesting a stronger confidence from analysts. This could impact investors by indicating potentially higher expected performance or growth prospects for Atlassian relative to Workday.
Strengths and Weaknesses
Below is a comparative overview of key strengths and weaknesses for Workday, Inc. (WDAY) and Atlassian Corporation (TEAM) based on their latest financial and operational data.
| Criterion | Workday, Inc. (WDAY) | Atlassian Corporation (TEAM) |
|---|---|---|
| Diversification | Strong focus on subscription services (7.7B in 2025) and professional services (728M), showing steady growth and a clear revenue model. | Revenue mainly from license and service (4.9B in 2025) with smaller segments; less diversified product lines. |
| Profitability | Moderate net margin (6.23%) but ROIC (2.73%) below WACC (8.86%), indicating value destruction despite growing profitability. | Negative net margin (-4.92%) and declining ROIC (-4.48%), showing ongoing losses and value erosion. |
| Innovation | Invests heavily in subscription services, demonstrating innovation in cloud solutions; ROIC trend is positive (+161.9%). | Innovation challenged by declining ROIC (-132.5%) and value destruction, indicating operational difficulties. |
| Global presence | Well-established global footprint with a solid balance sheet (current ratio 1.85) and manageable debt (D/E 0.37). | Global reach maintained but weaker liquidity (current ratio 1.22) and higher leverage (D/E 0.92) pose risks. |
| Market Share | Leading in enterprise cloud applications with increasing subscription revenues; high valuation multiples (PE 132.15). | Focused on collaborative software with high valuation but negative earnings; market share pressure visible. |
In summary, Workday demonstrates steady growth with improving profitability trends despite current value destruction, supported by strong subscription revenues and solid financial health. Atlassian faces more significant challenges with declining profitability and value, requiring cautious investment consideration.
Risk Analysis
The table below summarizes key risk factors for Workday, Inc. (WDAY) and Atlassian Corporation (TEAM) based on the latest 2025 financial data and market conditions:
| Metric | Workday, Inc. (WDAY) | Atlassian Corporation (TEAM) |
|---|---|---|
| Market Risk | Beta 1.14, moderate volatility | Beta 0.89, lower volatility |
| Debt level | Low debt-to-equity 0.37 (favorable) | Moderate debt-to-equity 0.92 (neutral) |
| Regulatory Risk | Moderate; US-centric regulations | Moderate; exposed to US & Australia |
| Operational Risk | Medium; large employee base (20.5K) | Medium; smaller workforce (12.2K) |
| Environmental Risk | Low; software sector with limited direct impact | Low; similar sector exposure |
| Geopolitical Risk | Moderate; primarily US operations | Elevated; headquartered in Australia, global sales |
Workday shows stronger financial stability with lower leverage and a safe Altman Z-Score, but faces moderate market risk due to higher beta. Atlassian’s higher debt and weaker profitability metrics heighten financial risk, despite a lower beta; geopolitical exposure is also more pronounced given its Australian base and global footprint. Investors should weigh Atlassian’s operational risks and financial weaknesses against Workday’s valuation concerns and market sensitivity.
Which Stock to Choose?
Workday, Inc. (WDAY) has shown a favorable income evolution with a 16.35% revenue growth in 2025 and strong overall income statement ratings. Despite a neutral to unfavorable stance on profitability ratios such as ROE (5.82%) and ROIC (2.73%), it maintains a solid debt position and a very favorable rating of B-. Its MOAT status is slightly unfavorable due to ROIC below WACC, but improving.
Atlassian Corporation (TEAM) presents favorable revenue growth of 19.66% in 2025 and a generally favorable income statement, yet profitability ratios remain negative with ROE at -19.08% and ROIC at -4.48%. Its financial ratios suggest a slightly unfavorable position, and it holds a very favorable rating of C. The MOAT evaluation is very unfavorable, reflecting value destruction and declining profitability.
Investors prioritizing overall income strength and improving profitability might view Workday as more favorable, while those accepting higher risk and focusing on growth potential might find Atlassian’s profile relevant despite its challenges. The choice could depend on the investor’s risk tolerance and strategy preferences.
Disclaimer: Investment carries a risk of loss of initial capital. The past performance is not a reliable indicator of future results. Be sure to understand risks before making an investment decision.
Go Further
I encourage you to read the complete analyses of Workday, Inc. and Atlassian Corporation to enhance your investment decisions: