Atlassian Corporation and Unity Software Inc. are two influential players in the software application industry, each driving innovation in collaboration tools and interactive content platforms. Atlassian excels in project management and team collaboration software, while Unity leads in real-time 3D content creation across multiple devices. Given their overlapping markets and distinctive innovation strategies, this article will help you determine which company presents the most compelling investment opportunity in 2026.
Table of contents
Companies Overview
I will begin the comparison between Atlassian Corporation and Unity Software Inc. by providing an overview of these two companies and their main differences.
Atlassian Corporation Overview
Atlassian Corporation, headquartered in Sydney, Australia, develops and licenses software products aimed at improving team collaboration and project management. Its offerings include Jira Software for project tracking, Confluence for team knowledge organization, and Trello for work collaboration. The company targets both technical and business teams globally, focusing on enhancing productivity through its diverse software portfolio.
Unity Software Inc. Overview
Unity Software Inc., based in San Francisco, California, provides a platform for creating and monetizing interactive real-time 2D and 3D content. Its solutions serve developers, artists, and designers across numerous devices including mobile phones, PCs, and virtual reality systems. Unity’s global presence and its focus on enabling interactive content creation position it as a key player in real-time 3D software.
Key similarities and differences
Both Atlassian and Unity operate in the software application industry with a focus on digital tools that enhance user productivity and creativity. Atlassian emphasizes team collaboration and project management solutions, while Unity specializes in real-time 3D content creation and monetization. Atlassian’s product suite targets business teams, whereas Unity caters to content creators and developers working with interactive media.
Income Statement Comparison
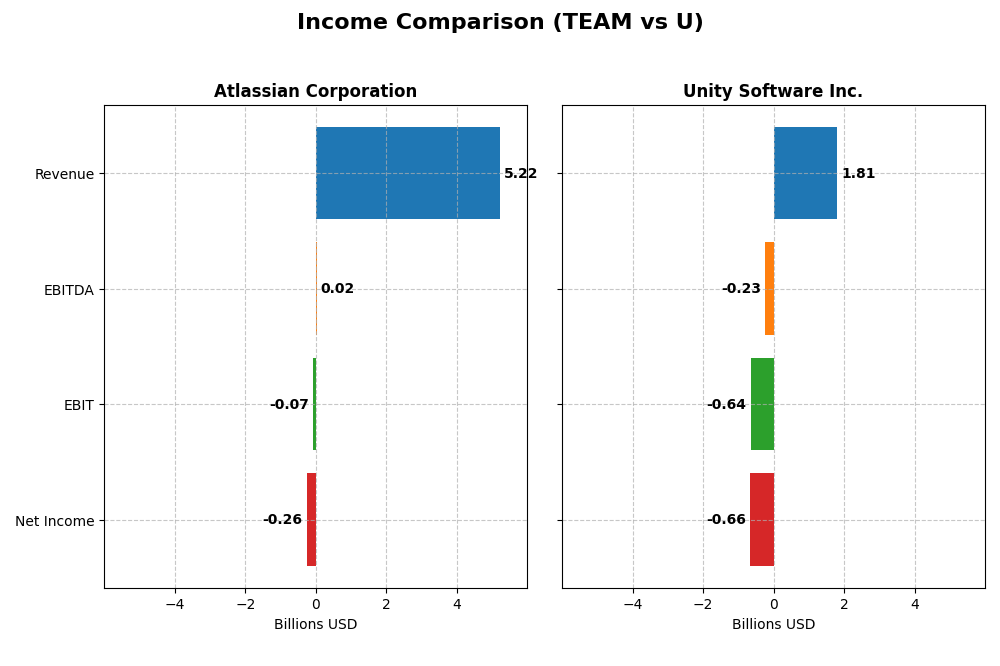
The table below presents a side-by-side comparison of key income statement metrics for Atlassian Corporation and Unity Software Inc. for their most recent fiscal years.
| Metric | Atlassian Corporation (2025) | Unity Software Inc. (2024) |
|---|---|---|
| Market Cap | 31.1B | 17.5B |
| Revenue | 5.22B | 1.81B |
| EBITDA | 24M | -235M |
| EBIT | -68M | -644M |
| Net Income | -257M | -664M |
| EPS | -0.98 | -1.68 |
| Fiscal Year | 2025 | 2024 |
Income Statement Interpretations
Atlassian Corporation
Atlassian has shown strong revenue growth from 2.1B in 2021 to 5.2B in 2025, with net income losses narrowing from -579M to -257M. Gross margins remain robust around 83%, but EBIT and net margins are negative, though improving. The 2025 fiscal year saw a 19.7% revenue rise and a 28.6% net margin improvement, despite higher operating expenses impacting EBIT.
Unity Software Inc.
Unity’s revenue grew from 772M in 2020 to a peak of 2.2B in 2023 before declining 17.1% to 1.8B in 2024. Net losses deepened overall, reaching -664M in 2024, with gross margin steady at 73.5%. EBIT margin remains deeply negative at -35.5%. The latest year saw revenue and gross profit contraction, though EBIT improved 16.8% and EPS growth was favorable at 22.2%.
Which one has the stronger fundamentals?
Atlassian demonstrates stronger fundamentals with consistent revenue growth, improved net margin, and high gross margin, supported by a favorable overall income statement evaluation. Unity faces declining revenue and widening net losses, with unfavorable long-term income growth and margin trends. Atlassian’s metrics indicate more stable profitability prospects despite current losses.
Financial Ratios Comparison
Below is a comparison of key financial ratios for Atlassian Corporation (TEAM) and Unity Software Inc. (U) based on the most recent fiscal year data available.
| Ratios | Atlassian Corporation (TEAM) FY 2025 | Unity Software Inc. (U) FY 2024 |
|---|---|---|
| ROE | -19.1% | -20.8% |
| ROIC | -4.5% | -12.8% |
| P/E | -207.1 | -13.4 |
| P/B | 39.5 | 2.79 |
| Current Ratio | 1.22 | 2.50 |
| Quick Ratio | 1.22 | 2.50 |
| D/E | 0.92 | 0.74 |
| Debt-to-Assets | 20.5% | 34.9% |
| Interest Coverage | -4.27 | -32.1 |
| Asset Turnover | 0.86 | 0.27 |
| Fixed Asset Turnover | 19.0 | 18.3 |
| Payout ratio | 0 | 0 |
| Dividend yield | 0 | 0 |
Interpretation of the Ratios
Atlassian Corporation
Atlassian’s ratios show a mixed picture with several unfavorable metrics, including a negative net margin (-4.92%) and return on equity (-19.08%), indicating profitability challenges. However, favorable factors like a low debt-to-assets ratio (20.51%) and strong quick ratio (1.22) suggest decent liquidity and manageable leverage. The company does not pay dividends, reflecting a focus on reinvestment and growth.
Unity Software Inc.
Unity’s financial ratios are mostly unfavorable, highlighted by a steep negative net margin (-36.63%) and return on invested capital (-12.78%), pointing to operational inefficiencies and losses. Despite a strong current ratio (2.5) and quick ratio (2.5) indicating solid liquidity, its high weighted average cost of capital (12.26%) raises concerns. Unity also pays no dividends, consistent with its growth and reinvestment strategy.
Which one has the best ratios?
Both Atlassian and Unity exhibit slightly unfavorable overall ratios, but Atlassian holds a modest edge with a higher percentage of favorable metrics (35.71%) compared to Unity’s (28.57%). Atlassian’s lower leverage and better asset turnover contrast with Unity’s stronger liquidity but weaker profitability and higher capital costs, making their ratio profiles comparably cautious for investors.
Strategic Positioning
This section compares the strategic positioning of Atlassian Corporation and Unity Software Inc., including Market position, Key segments, and Exposure to technological disruption:
Atlassian Corporation
- Market position and competitive pressure
- Key segments and business drivers
- Exposure to technological disruption
Unity Software Inc.
- Market cap $31B, steady NASDAQ software player with moderate beta 0.89
- Diverse software tools for project management, collaboration, and developer services
- Established cloud and collaboration software with broad enterprise adoption
Atlassian Corporation vs Unity Software Inc. Positioning
Atlassian pursues a diversified software portfolio targeting multiple business functions, enhancing cross-team collaboration. Unity concentrates on interactive real-time content creation, serving niche markets in gaming and AR/VR. Both face distinct competitive dynamics and technological challenges based on their market focus.
Which has the best competitive advantage?
Both companies show very unfavorable MOAT evaluations with declining ROIC trends and value destruction, indicating neither currently maintains a sustainable competitive advantage based on capital efficiency.
Stock Comparison
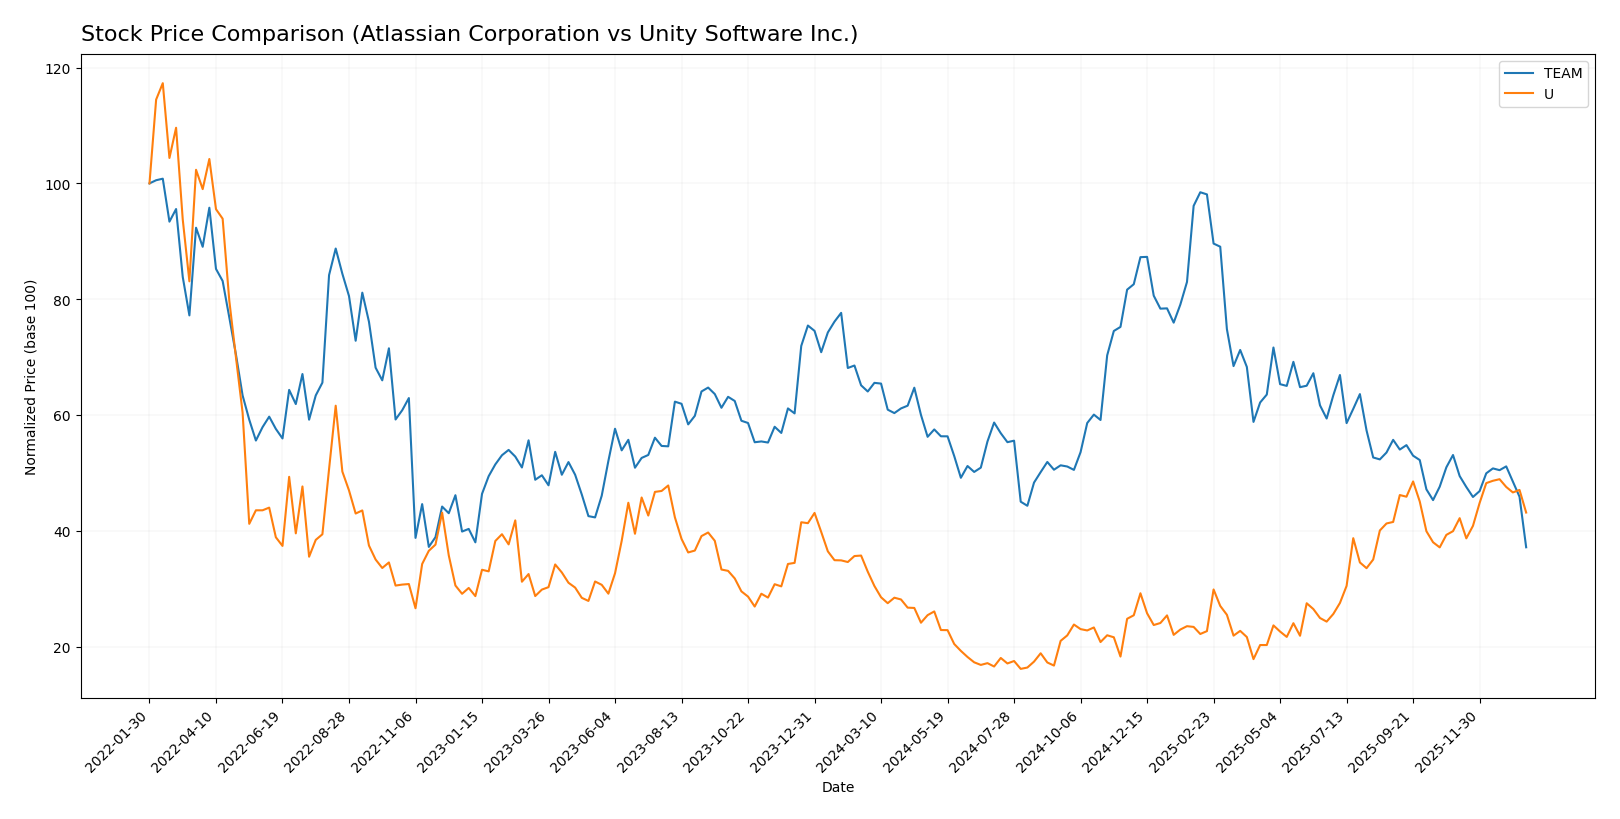
The stock prices of Atlassian Corporation and Unity Software Inc. have shown contrasting dynamics over the past year, with Atlassian experiencing a significant decline and Unity demonstrating robust growth and accelerating momentum.
Trend Analysis
Atlassian Corporation’s stock declined by 42.01% over the past 12 months, indicating a bearish trend with deceleration. The price ranged from a high of 314.28 to a low of 118.55, reflecting high volatility with a standard deviation of 41.22.
Unity Software Inc. posted a 31.0% gain over the same period, marking a bullish trend with acceleration. The stock price fluctuated between 15.32 and 46.42, showing moderate volatility with a standard deviation of 9.04.
Comparing the two, Unity Software Inc. outperformed Atlassian Corporation in market performance, delivering positive growth while Atlassian’s stock faced a pronounced decline.
Target Prices
The current analyst consensus reflects a moderately bullish outlook for Atlassian Corporation and Unity Software Inc.
| Company | Target High | Target Low | Consensus |
|---|---|---|---|
| Atlassian Corporation | 290 | 185 | 234.14 |
| Unity Software Inc. | 60 | 39 | 50.98 |
Analysts expect Atlassian’s stock to more than double from its current price of 118.55 USD, while Unity’s consensus target suggests a moderate upside from 40.95 USD. Both imply potential growth but require monitoring volatility and market conditions closely.
Analyst Opinions Comparison
This section compares analysts’ ratings and grades for Atlassian Corporation and Unity Software Inc.:
Rating Comparison
Atlassian Corporation Rating
- Rating: C, assessed as Very Favorable
- Discounted Cash Flow Score: 5, indicating Very Favorable DCF
- ROE Score: 1, indicating Very Unfavorable ROE
- ROA Score: 1, indicating Very Unfavorable ROA
- Debt To Equity Score: 1, indicating Very Unfavorable Debt
- Overall Score: 2, indicating Moderate overall performance
Unity Software Inc. Rating
- Rating: D+, assessed as Very Favorable
- Discounted Cash Flow Score: 1, indicating Very Unfavorable DCF
- ROE Score: 1, indicating Very Unfavorable ROE
- ROA Score: 1, indicating Very Unfavorable ROA
- Debt To Equity Score: 1, indicating Very Unfavorable Debt
- Overall Score: 1, indicating Very Unfavorable overall performance
Which one is the best rated?
Atlassian holds a higher overall score and a very favorable discounted cash flow rating compared to Unity, which has uniformly very unfavorable scores except for a moderate price-to-book score. Thus, Atlassian is better rated based strictly on these provided metrics.
Scores Comparison
Here is a comparison of the Altman Z-Score and Piotroski Score for Atlassian Corporation and Unity Software Inc.:
Atlassian Corporation Scores
- Altman Z-Score: 4.70, indicating a safe zone, low risk of bankruptcy.
- Piotroski Score: 5, classified as average financial strength.
Unity Software Inc. Scores
- Altman Z-Score: 2.93, indicating a grey zone, moderate risk of bankruptcy.
- Piotroski Score: 4, classified as average financial strength.
Which company has the best scores?
Atlassian shows a stronger Altman Z-Score with a safe zone rating, while both companies have similar average Piotroski Scores. Based on these scores, Atlassian demonstrates better financial stability.
Grades Comparison
Here is a comparison of the recent grades assigned to Atlassian Corporation and Unity Software Inc.:
Atlassian Corporation Grades
The following table summarizes recent grades assigned by reputable grading companies for Atlassian Corporation:
| Grading Company | Action | New Grade | Date |
|---|---|---|---|
| BTIG | Maintain | Buy | 2026-01-13 |
| Piper Sandler | Maintain | Overweight | 2026-01-05 |
| Bernstein | Maintain | Outperform | 2025-11-18 |
| Macquarie | Maintain | Outperform | 2025-11-03 |
| Mizuho | Maintain | Outperform | 2025-10-31 |
| Bernstein | Maintain | Outperform | 2025-10-31 |
| TD Cowen | Maintain | Hold | 2025-10-27 |
| BMO Capital | Maintain | Outperform | 2025-10-24 |
| UBS | Maintain | Neutral | 2025-10-24 |
| Keybanc | Maintain | Overweight | 2025-10-23 |
Atlassian’s grades predominantly indicate positive ratings, with multiple “Outperform” and “Overweight” assessments and no downgrades.
Unity Software Inc. Grades
The following table shows recent grades assigned by recognized grading companies for Unity Software Inc.:
| Grading Company | Action | New Grade | Date |
|---|---|---|---|
| Morgan Stanley | Maintain | Overweight | 2026-01-13 |
| Goldman Sachs | Maintain | Neutral | 2026-01-13 |
| Wells Fargo | Maintain | Overweight | 2026-01-08 |
| Jefferies | Maintain | Buy | 2026-01-05 |
| Piper Sandler | Upgrade | Overweight | 2025-12-11 |
| BTIG | Upgrade | Buy | 2025-12-11 |
| Wells Fargo | Upgrade | Overweight | 2025-12-05 |
| Arete Research | Upgrade | Buy | 2025-12-01 |
| Citigroup | Maintain | Buy | 2025-11-11 |
| Wells Fargo | Maintain | Equal Weight | 2025-11-07 |
Unity Software’s grades show several upgrades and predominantly positive ratings, including multiple “Buy” and “Overweight” recommendations.
Which company has the best grades?
Both companies have received a consensus “Buy” rating, but Atlassian displays a more consistent pattern of “Outperform” and “Overweight” grades, while Unity exhibits recent upgrades and a mix of “Buy” and “Overweight” ratings. This suggests different trajectories in analyst confidence that investors might consider in portfolio decisions.
Strengths and Weaknesses
Below is a comparison table highlighting the key strengths and weaknesses of Atlassian Corporation (TEAM) and Unity Software Inc. (U) based on their recent financial performance and market position.
| Criterion | Atlassian Corporation (TEAM) | Unity Software Inc. (U) |
|---|---|---|
| Diversification | Moderate product segmentation with License and Service revenues at $4.93B, plus smaller streams from other services. | Balanced revenue from Create Solutions ($614M) and Operate Solutions ($1.2B), showing diversification in software offerings. |
| Profitability | Negative net margin (-4.92%) and ROIC (-4.48%), indicating unprofitable operations and value destruction. | Significantly negative net margin (-36.63%) and ROIC (-12.78%), reflecting deeper losses and value erosion. |
| Innovation | Strong product and service innovation, but declining ROIC (-132.5% trend) signals challenges in capital efficiency. | Innovation visible in diversified software solutions, but declining ROIC (-2.0% trend) and high losses weigh on outlook. |
| Global presence | Established global footprint with steady revenue growth in License & Service segments. | Growing global presence, especially in Operate Solutions, but profitability concerns limit scale advantages. |
| Market Share | Solid market share in collaboration and development tools, though currently facing profitability pressure. | Expanding market share in real-time 3D and gaming software, but financials suggest operational hurdles. |
Key takeaways: Both Atlassian and Unity demonstrate strong diversification and innovation capabilities, yet suffer from declining profitability and value destruction. Atlassian’s losses are less severe, while Unity faces larger profitability challenges, warranting cautious investment consideration.
Risk Analysis
Below is a comparative table of key risks for Atlassian Corporation (TEAM) and Unity Software Inc. (U) based on their latest financial and operational data:
| Metric | Atlassian Corporation (TEAM) | Unity Software Inc. (U) |
|---|---|---|
| Market Risk | Moderate (Beta 0.89, range 118-326 USD) | High (Beta 2.05, range 15-52 USD) |
| Debt level | Moderate (Debt/Equity 0.92, Debt to Assets 20.5%) | Moderate (Debt/Equity 0.74, Debt to Assets 34.9%) |
| Regulatory Risk | Low (Australian HQ, stable tech regulations) | Medium (US-based, exposed to evolving software and data laws) |
| Operational Risk | Moderate (negative net margin -4.92%, ROE -19%) | High (significant losses with net margin -36.6%, ROE -20.8%) |
| Environmental Risk | Low (software sector, limited direct impact) | Low (software sector, limited direct impact) |
| Geopolitical Risk | Medium (HQ in Australia, global operations) | Medium (US HQ, global presence with exposure to multiple regions) |
The most impactful and likely risks are operational and market risks. Unity’s high beta and steep losses point to greater volatility and financial strain. Atlassian shows better financial stability but faces pressure from negative profitability and valuation concerns. Both companies have manageable debt levels but must navigate evolving regulatory landscapes and geopolitical uncertainties.
Which Stock to Choose?
Atlassian Corporation (TEAM) shows favorable income growth with a 19.66% revenue increase in 2025 and a strong gross margin of 82.84%, despite a negative net margin of -4.92%. Its financial ratios are slightly unfavorable overall, with key weaknesses in profitability (ROE -19.08%) and interest coverage, but it maintains a moderate debt level and a very favorable rating. The company’s MOAT is very unfavorable, reflecting declining ROIC and value destruction.
Unity Software Inc. (U) experienced an unfavorable income trend, with a 17.1% revenue decline in 2024 and a low gross margin of 73.48%. Its financial ratios are also slightly unfavorable, marked by poor profitability (ROE -20.81%) and weak asset turnover, yet it benefits from a strong current ratio and a very favorable rating status. The MOAT is also very unfavorable, showing declining ROIC and value destruction.
For investors, TEAM might appear more suitable for those prioritizing revenue growth and stable gross margins despite profitability challenges, whereas U could be seen as more aligned with risk-tolerant profiles attracted by recent stock price acceleration and potential turnaround signs. The overall unfavorable MOAT and financial ratios for both companies suggest that cautious evaluation is warranted depending on investment strategy and risk tolerance.
Disclaimer: Investment carries a risk of loss of initial capital. The past performance is not a reliable indicator of future results. Be sure to understand risks before making an investment decision.
Go Further
I encourage you to read the complete analyses of Atlassian Corporation and Unity Software Inc. to enhance your investment decisions: