In today’s fast-evolving technology landscape, Uber Technologies, Inc. and Atlassian Corporation stand out as leaders in software application innovation. Uber revolutionizes mobility, delivery, and freight logistics, while Atlassian drives collaboration and project management solutions for businesses worldwide. Both companies operate at the intersection of technology and productivity, making their comparison crucial for investors seeking growth and innovation exposure. Join me as we explore which company offers the most compelling investment opportunity in 2026.

Table of contents
Companies Overview
I will begin the comparison between Uber Technologies, Inc. and Atlassian Corporation by providing an overview of these two companies and their main differences.
Uber Overview
Uber Technologies, Inc. develops and operates proprietary technology applications globally, connecting consumers with independent providers for ridesharing, delivery, and freight services. Its business spans Mobility, Delivery, and Freight segments, offering diverse transportation and logistics solutions. Founded in 2009 and headquartered in San Francisco, Uber is positioned as a leading player in the software application industry with a market cap of $176B.
Atlassian Overview
Atlassian Corporation designs, develops, and licenses software products focused on team collaboration, project management, and IT service management. Its portfolio includes Jira, Confluence, Trello, and other enterprise tools that support software development and business operations. Founded in 2002 and based in Sydney, Atlassian holds a $31B market cap and targets global customers in technology and business sectors.
Key similarities and differences
Both companies operate in the software application industry but serve distinct markets: Uber focuses on transportation and logistics services via its technology platform, while Atlassian concentrates on software tools for collaboration and project management. Uber’s business model revolves around connecting consumers with service providers, whereas Atlassian licenses software products and cloud services for enterprise use. Their geographical footprints and market capitalizations also differ significantly.
Income Statement Comparison
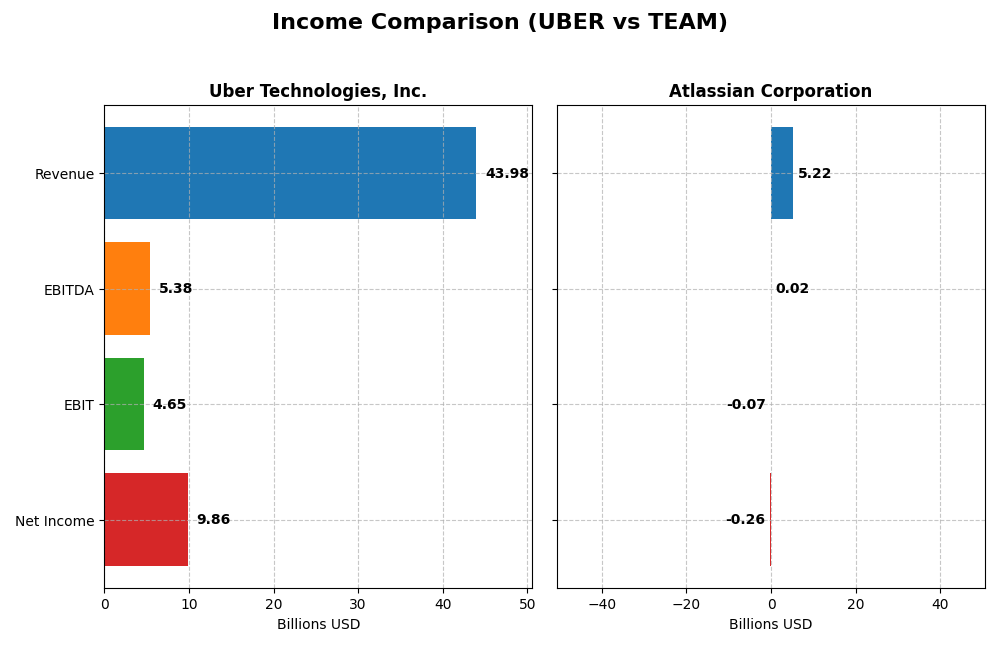
The table below compares the latest available fiscal year income statement metrics for Uber Technologies, Inc. and Atlassian Corporation, providing a snapshot of their financial performance.
| Metric | Uber Technologies, Inc. | Atlassian Corporation |
|---|---|---|
| Market Cap | 176.3B | 31.1B |
| Revenue | 43.98B | 5.22B |
| EBITDA | 5.39B | 24M |
| EBIT | 4.65B | -68M |
| Net Income | 9.86B | -257M |
| EPS | 4.71 | -0.98 |
| Fiscal Year | 2024 | 2025 |
Income Statement Interpretations
Uber Technologies, Inc.
Uber exhibited strong growth from 2020 to 2024, with revenue rising from 11.1B to 44.0B and net income turning sharply positive to 9.9B in 2024. Margins improved significantly, with gross margin at 39.4% and net margin at 22.4%. The latest year showed accelerated revenue growth of 18% and a remarkable 343% increase in net margin, reflecting enhanced profitability.
Atlassian Corporation
Atlassian’s revenue grew steadily from 2.1B in 2021 to 5.2B in mid-2025, with net losses narrowing from -579M to -257M. Gross margin is notably high at 82.8%, but EBIT and net margins remain negative, at -1.3% and -4.9% respectively. The most recent year showed 20% revenue growth alongside a 29% improvement in net margin, though operating expenses grew unfavorably.
Which one has the stronger fundamentals?
Uber demonstrates stronger fundamentals with consistent revenue and net income growth, positive margins, and improving profitability metrics. Atlassian, despite solid revenue expansion and high gross margins, continues to face operating losses and negative net margins, indicating ongoing challenges in achieving profitability. Uber’s fully favorable income statement contrasts with Atlassian’s mixed margin profile.
Financial Ratios Comparison
This table presents the most recent financial ratios for Uber Technologies, Inc. and Atlassian Corporation, providing a side-by-side comparison for key profitability, liquidity, leverage, efficiency, and dividend metrics as of their latest fiscal years.
| Ratios | Uber Technologies, Inc. (2024) | Atlassian Corporation (2025) |
|---|---|---|
| ROE | 45.7% | -19.1% |
| ROIC | 6.8% | -4.5% |
| P/E | 12.8 | -207.1 |
| P/B | 5.9 | 39.5 |
| Current Ratio | 1.07 | 1.22 |
| Quick Ratio | 1.07 | 1.22 |
| D/E | 0.53 | 0.92 |
| Debt-to-Assets | 22.3% | 20.5% |
| Interest Coverage | 5.35 | -4.27 |
| Asset Turnover | 0.86 | 0.86 |
| Fixed Asset Turnover | 14.1 | 19.0 |
| Payout ratio | 0% | 0% |
| Dividend yield | 0% | 0% |
Interpretation of the Ratios
Uber Technologies, Inc.
Uber shows a mix of strong and neutral ratios, with favorable net margin at 22.41% and ROE at 45.72%, indicating efficient profitability and equity returns. The company’s price-to-earnings ratio is attractive at 12.82, though its price-to-book ratio is less favorable at 5.86. Liquidity and leverage metrics are generally stable. Uber does not pay dividends, focusing on reinvestment and growth instead.
Atlassian Corporation
Atlassian’s key ratios reveal weakness with negative net margin (-4.92%) and ROE (-19.08%), signaling profitability struggles. Despite a high price-to-book ratio of 39.51, its WACC is favorable at 7.85%. Liquidity ratios are adequate, but interest coverage is negative, raising concerns over debt servicing. The company does not issue dividends, prioritizing growth and R&D investment.
Which one has the best ratios?
Uber presents a stronger overall ratio profile with half of its ratios favorable and only 14% unfavorable, reflecting better profitability and financial stability. Atlassian, however, exhibits more unfavorable ratios at 43%, particularly in profitability and interest coverage, suggesting greater financial challenges. Thus, Uber’s ratios appear comparatively more robust.
Strategic Positioning
This section compares the strategic positioning of Uber and Atlassian, including market position, key segments, and exposure to technological disruption:
Uber Technologies, Inc.
- Large market cap with high competition in ride-sharing and delivery sectors globally.
- Diverse segments: Mobility, Delivery, and Freight driving revenue across multiple services.
- Operates proprietary tech platforms; faces evolving tech but no explicit disruption details provided.
Atlassian Corporation
- Smaller market cap focused on software application market with NASDAQ listing.
- Concentrated on software tools for project management, collaboration, and IT service management.
- Develops a variety of interconnected software products; potential exposure to rapid software innovation.
Uber vs Atlassian Positioning
Uber pursues a diversified business model with three distinct segments, offering broad geographic and service coverage. Atlassian concentrates on software products aimed at business collaboration and IT, benefiting from focused product innovation but less diversification.
Which has the best competitive advantage?
Based on MOAT evaluations, Uber is slightly unfavorable but improving profitability, while Atlassian shows very unfavorable and declining returns, indicating Uber currently holds a relatively stronger competitive advantage.
Stock Comparison
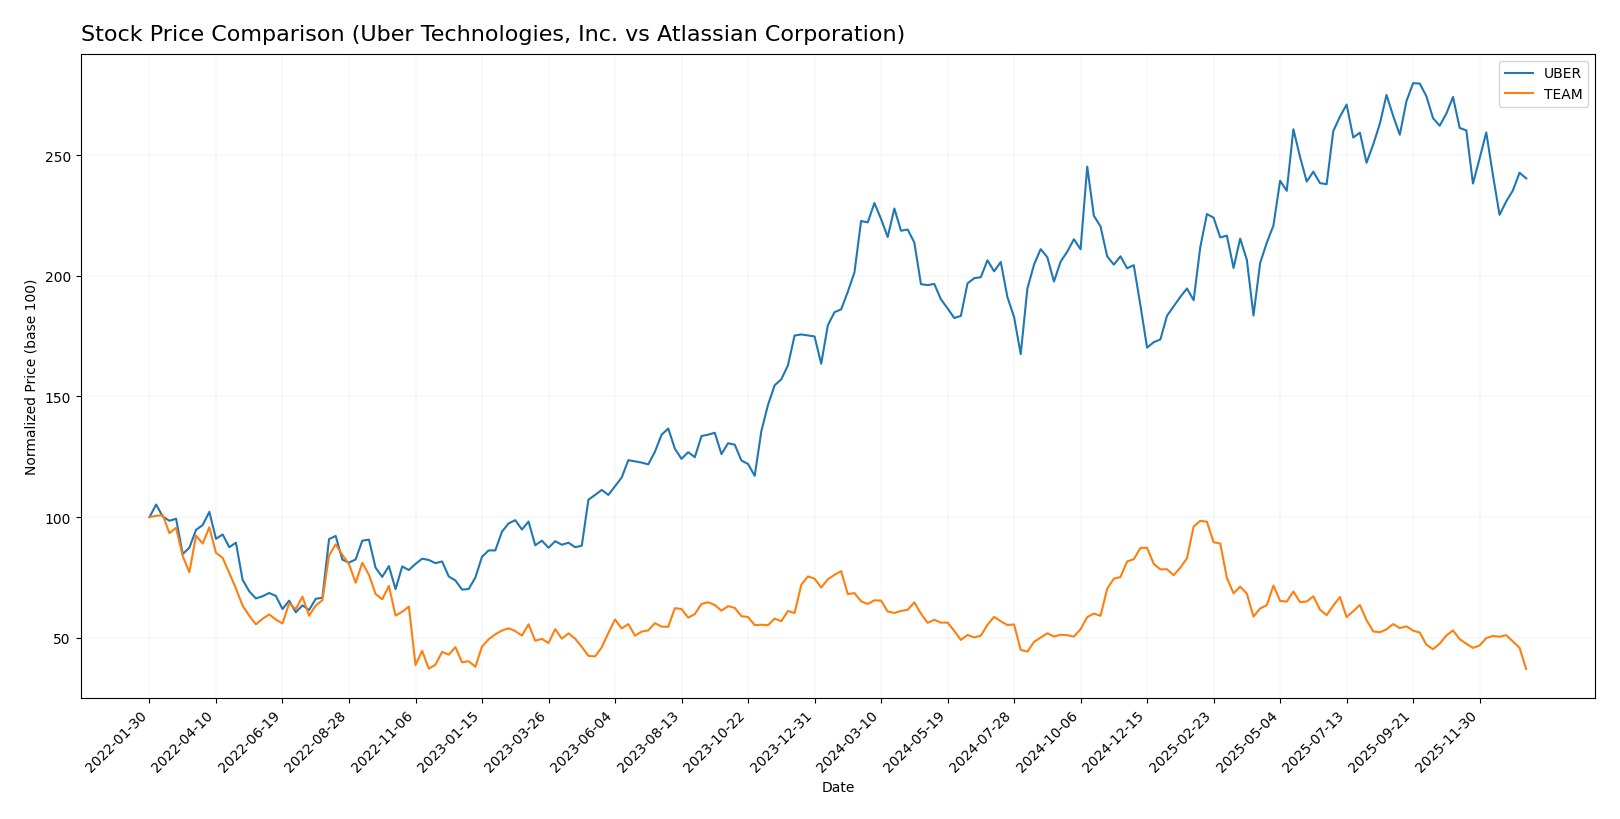
The stock price chart over the past 12 months highlights significant divergence in performance between Uber Technologies, Inc. and Atlassian Corporation, with Uber showing moderate gains amid decelerating bullish momentum, while Atlassian experienced a marked decline with heightened volatility.
Trend Analysis
Uber Technologies, Inc. recorded an 8.21% price increase over the past year, indicating a bullish trend with decelerating upward momentum and a price range from 58.99 to 98.51. Recent months showed a reversal with a -12.31% drop and seller dominance.
Atlassian Corporation’s stock declined by 42.01% over the same period, reflecting a bearish trend with decelerating downtrend and high volatility, evidenced by a wide price range between 118.55 and 314.28. The recent steep drop of -30.03% further confirms seller dominance.
Comparing both, Uber delivered the highest market performance with a positive price change, contrasting with Atlassian’s substantial losses and greater volatility throughout the year.
Target Prices
Analysts present a clear target price consensus for Uber Technologies, Inc. and Atlassian Corporation based on recent evaluations.
| Company | Target High | Target Low | Consensus |
|---|---|---|---|
| Uber Technologies, Inc. | 140 | 73 | 111.26 |
| Atlassian Corporation | 290 | 185 | 234.14 |
The consensus target prices suggest that analysts expect significant upside potential for both Uber and Atlassian compared to their current market prices of $84.86 and $118.55, respectively. This indicates generally positive sentiment and growth prospects.
Analyst Opinions Comparison
This section compares analysts’ ratings and grades for Uber Technologies, Inc. and Atlassian Corporation:
Rating Comparison
Uber Rating
- Rating: B, indicating a very favorable overall assessment by analysts.
- Discounted Cash Flow Score: Very unfavorable at 1, suggesting concerns on valuation.
- ROE Score: Very favorable 5, showing efficient profit generation from equity.
- ROA Score: Very favorable 5, strong asset utilization to generate earnings.
- Debt To Equity Score: Moderate at 2, reflecting some financial risk.
- Overall Score: Moderate at 3, a middle-ground comprehensive rating.
Atlassian Rating
- Rating: C, also marked as very favorable despite a lower letter grade.
- Discounted Cash Flow Score: Very favorable at 5, indicating strong future cash flows.
- ROE Score: Very unfavorable 1, reflecting weak efficiency in equity profit.
- ROA Score: Very unfavorable 1, indicating poor asset utilization.
- Debt To Equity Score: Very unfavorable 1, signaling higher financial risk.
- Overall Score: Moderate at 2, slightly below Uber’s overall performance.
Which one is the best rated?
Based on the data, Uber holds a better overall rating (B vs. C) and superior profitability scores (ROE and ROA), while Atlassian excels only in discounted cash flow. Uber’s balanced financial profile results in a higher overall score, making it better rated strictly on these metrics.
Scores Comparison
This table compares the Altman Z-Score and Piotroski Score for Uber and Atlassian:
Uber Scores
- Altman Z-Score: 4.44, indicating a safe zone status
- Piotroski Score: 6, classified as average
Atlassian Scores
- Altman Z-Score: 4.70, indicating a safe zone status
- Piotroski Score: 5, classified as average
Which company has the best scores?
Both Uber and Atlassian are in the safe zone for Altman Z-Score, with Atlassian slightly higher at 4.70 versus Uber’s 4.44. Uber has a marginally better Piotroski Score of 6 compared to Atlassian’s 5, both rated average.
Grades Comparison
I compare the recent grades assigned to Uber Technologies, Inc. and Atlassian Corporation by leading grading companies:
Uber Technologies, Inc. Grades
The table below summarizes Uber’s recent grades from notable financial institutions:
| Grading Company | Action | New Grade | Date |
|---|---|---|---|
| BTIG | Maintain | Buy | 2026-01-15 |
| Wells Fargo | Maintain | Overweight | 2026-01-08 |
| Cantor Fitzgerald | Maintain | Overweight | 2026-01-08 |
| Wolfe Research | Maintain | Outperform | 2026-01-06 |
| Wedbush | Maintain | Neutral | 2025-12-19 |
| Morgan Stanley | Maintain | Overweight | 2025-12-08 |
| Arete Research | Upgrade | Buy | 2025-12-03 |
| Wells Fargo | Maintain | Overweight | 2025-11-05 |
| Guggenheim | Maintain | Buy | 2025-11-05 |
| DA Davidson | Maintain | Buy | 2025-11-05 |
Overall, Uber’s grades predominantly reflect positive sentiment, with many “Buy” and “Overweight” ratings, indicating consistent confidence from analysts.
Atlassian Corporation Grades
Below is a summary of Atlassian’s recent grades by respected grading firms:
| Grading Company | Action | New Grade | Date |
|---|---|---|---|
| BTIG | Maintain | Buy | 2026-01-13 |
| Piper Sandler | Maintain | Overweight | 2026-01-05 |
| Bernstein | Maintain | Outperform | 2025-11-18 |
| Macquarie | Maintain | Outperform | 2025-11-03 |
| Mizuho | Maintain | Outperform | 2025-10-31 |
| Bernstein | Maintain | Outperform | 2025-10-31 |
| TD Cowen | Maintain | Hold | 2025-10-27 |
| BMO Capital | Maintain | Outperform | 2025-10-24 |
| UBS | Maintain | Neutral | 2025-10-24 |
| Keybanc | Maintain | Overweight | 2025-10-23 |
Atlassian’s grades show a generally favorable outlook, with multiple “Outperform” ratings and few neutral or hold positions, reflecting steady analyst optimism.
Which company has the best grades?
Both companies have received predominantly positive grades, but Uber has a higher count of “Buy” ratings, while Atlassian features more “Outperform” and “Overweight” ratings. This suggests that investors may see strong potential in both, with slight nuances in analyst confidence.
Strengths and Weaknesses
Below is a comparative table highlighting key strengths and weaknesses of Uber Technologies, Inc. and Atlassian Corporation based on the most recent data available.
| Criterion | Uber Technologies, Inc. (UBER) | Atlassian Corporation (TEAM) |
|---|---|---|
| Diversification | Strong diversification with three main segments: Mobility (25B), Delivery (13.75B), Freight (5.14B) in 2024 | Revenue mainly driven by License and Service (4.93B) and smaller segments; less diversified product lines |
| Profitability | Positive net margin (22.41%) and ROE (45.72%) indicating solid profitability; ROIC slightly below WACC but improving | Negative net margin (-4.92%) and ROE (-19.08%), with ROIC well below WACC showing ongoing value destruction |
| Innovation | Growing ROIC trend (139%), but currently shedding value; innovative in mobility and delivery sectors | Declining ROIC trend (-133%) and strong value destruction; innovation efforts seem less effective at generating profit |
| Global presence | Large global footprint in ride-sharing, delivery, and freight logistics | Global SaaS presence but more niche, focused on collaboration software markets |
| Market Share | Significant market share in ride-hailing and delivery services with expanding freight segment | Strong position in software collaboration tools but facing intense competition |
In summary, Uber benefits from strong diversification and improving profitability trends despite current challenges in value creation. Atlassian struggles with profitability and declining returns, indicating higher risk for investors seeking value stability.
Risk Analysis
Below is a comparison of key risks for Uber Technologies, Inc. and Atlassian Corporation based on the most recent data from 2025-2026:
| Metric | Uber Technologies, Inc. (UBER) | Atlassian Corporation (TEAM) |
|---|---|---|
| Market Risk | Moderate (Beta 1.20) | Lower (Beta 0.89) |
| Debt level | Moderate (Debt-to-Equity 0.53) | Moderate (Debt-to-Equity 0.92) |
| Regulatory Risk | High (Ride-sharing regulations and gig economy laws) | Moderate (Software compliance and privacy regulations) |
| Operational Risk | Moderate (Complex multi-segment operations) | Moderate (Software development and cloud service disruptions) |
| Environmental Risk | Low (Limited direct impact) | Low (Limited direct impact) |
| Geopolitical Risk | Moderate (Global presence with exposure in multiple regions) | Moderate (Global SaaS market exposure) |
The most impactful and likely risks are regulatory challenges for Uber, given ongoing changes in gig worker classification, and Atlassian’s operational risks related to software reliability and data security. Uber’s moderate debt and market sensitivity are balanced by strong profitability, while Atlassian faces profitability pressures and higher leverage, increasing financial risk. Both companies remain in a safe financial zone but require monitoring of regulatory and operational hurdles.
Which Stock to Choose?
Uber Technologies, Inc. has shown strong income growth with a 295% revenue increase over five years, favorable profitability metrics including a 22.4% net margin, and a solid return on equity of 45.7%. Its debt levels are moderate with a debt-to-assets ratio of 22.3%, and its overall rating is very favorable (B) supported by positive financial ratios.
Atlassian Corporation exhibits robust gross margins of 82.8% but struggles with profitability, reflected in a negative net margin of -4.9% and declining returns on equity and assets. Its debt profile is manageable with a 20.5% debt-to-assets ratio; however, its global financial ratios evaluation is slightly unfavorable and it holds a very favorable rating (C) despite operational challenges.
Investors seeking growth with improving profitability and stable debt might find Uber’s metrics slightly more favorable, while those valuing high gross margins but accepting current profitability pressures might view Atlassian’s profile differently. The contrasting MOAT evaluations—slightly unfavorable but improving for Uber versus very unfavorable and declining for Atlassian—may further influence interpretation depending on risk tolerance and investment goals.
Disclaimer: Investment carries a risk of loss of initial capital. The past performance is not a reliable indicator of future results. Be sure to understand risks before making an investment decision.
Go Further
I encourage you to read the complete analyses of Uber Technologies, Inc. and Atlassian Corporation to enhance your investment decisions: