Atlassian Corporation (TEAM) and Tyler Technologies, Inc. (TYL) are two prominent players in the software application industry, each with a distinct focus yet overlapping in enterprise solutions. Atlassian excels in collaborative project management tools, while Tyler specializes in integrated public sector software. Their innovation strategies and market approaches make them compelling subjects for comparison. In this article, I will help you determine which company offers the most attractive investment opportunity.
Table of contents
Companies Overview
I will begin the comparison between Atlassian Corporation and Tyler Technologies, Inc. by providing an overview of these two companies and their main differences.
Atlassian Corporation Overview
Atlassian Corporation, founded in 2002 and based in Sydney, Australia, develops, licenses, and maintains a diverse range of software products. Its mission focuses on improving team collaboration and project management through products like Jira, Confluence, Trello, and Bitbucket. The company operates globally in the software application industry with a market cap of $31.1B and employs over 12K people.
Tyler Technologies, Inc. Overview
Tyler Technologies, founded in 1966 and headquartered in Plano, Texas, delivers integrated information management solutions tailored to the public sector. Its product suite includes financial management, judicial solutions, and property appraisal software. Tyler operates mainly in the US with a market cap of $18.9B and employs approximately 7.5K staff, emphasizing automation and cloud-hosted services for government agencies.
Key similarities and differences
Both Atlassian and Tyler operate in the software application industry, focusing on specialized software solutions. Atlassian targets global business teams with collaboration and development tools, while Tyler serves the public sector with integrated management systems. Atlassian has a larger market cap and workforce, reflecting its broad market reach, whereas Tyler’s niche public sector focus involves a strategic cloud partnership with AWS.
Income Statement Comparison
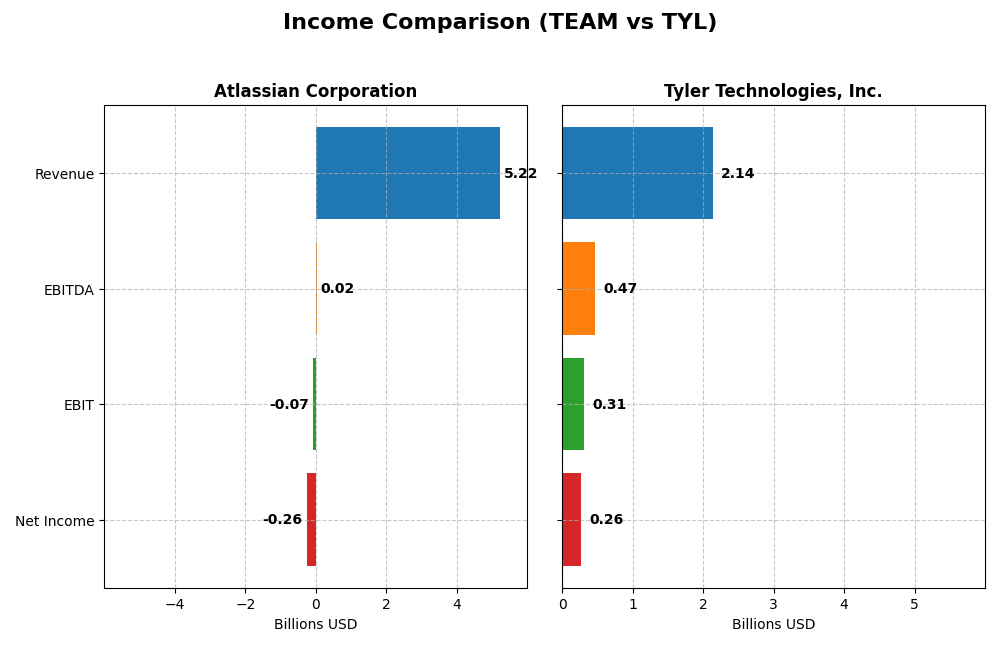
The table below compares key income statement metrics for Atlassian Corporation and Tyler Technologies, Inc. for their most recent fiscal years.
| Metric | Atlassian Corporation | Tyler Technologies, Inc. |
|---|---|---|
| Market Cap | 31.1B | 18.9B |
| Revenue | 5.22B | 2.14B |
| EBITDA | 24.0M | 466.5M |
| EBIT | -68.3M | 314.1M |
| Net Income | -257.0M | 263.0M |
| EPS | -0.98 | 6.17 |
| Fiscal Year | 2025 | 2024 |
Income Statement Interpretations
Atlassian Corporation
Atlassian’s revenue has grown significantly from 2.1B in 2021 to 5.2B in 2025, with net income losses narrowing from -579M to -257M. Its gross margin remains strong at 82.8%, though EBIT and net margins are negative. The latest year shows revenue growth of 19.7% and improving net margin by 28.6%, despite a 33.2% decline in EBIT.
Tyler Technologies, Inc.
Tyler Technologies reported consistent revenue growth from 1.1B in 2020 to 2.1B in 2024, with net income rising from 195M to 263M. Margins are healthy, with a 41.0% gross margin and 12.3% net margin in 2024. The most recent year delivered solid EBIT growth of 41.6% and net margin improvement of 44.7%, reflecting operational efficiency gains.
Which one has the stronger fundamentals?
Tyler Technologies demonstrates stronger fundamentals with positive EBIT and net margins, alongside consistent profitability and margin expansion. Atlassian shows impressive revenue growth and high gross margins but continues to face operating losses and negative net income. Tyler’s higher proportion of favorable income metrics and margin stability suggests a more robust income statement profile.
Financial Ratios Comparison
Below is a comparative table presenting the most recent financial ratios for Atlassian Corporation and Tyler Technologies, Inc., based on their fiscal year 2025 and 2024 data respectively.
| Ratios | Atlassian Corporation (2025) | Tyler Technologies, Inc. (2024) |
|---|---|---|
| ROE | -19.08% | 7.76% |
| ROIC | -4.48% | 6.20% |
| P/E | -207.1 | 93.42 |
| P/B | 39.51 | 7.25 |
| Current Ratio | 1.22 | 1.35 |
| Quick Ratio | 1.22 | 1.35 |
| D/E (Debt-to-Equity) | 0.92 | 0.19 |
| Debt-to-Assets | 20.5% | 12.3% |
| Interest Coverage | -4.27 | 50.50 |
| Asset Turnover | 0.86 | 0.41 |
| Fixed Asset Turnover | 19.02 | 10.95 |
| Payout Ratio | 0 | 0 |
| Dividend Yield | 0 | 0 |
Interpretation of the Ratios
Atlassian Corporation
Atlassian’s ratios reveal several weaknesses, including negative net margin (-4.92%) and return on equity (-19.08%), highlighting profitability and efficiency challenges. The debt to assets ratio is favorable at 20.51%, but interest coverage is notably negative, indicating potential difficulties in meeting interest obligations. Atlassian does not pay dividends, likely due to negative net income and a focus on reinvestment and growth.
Tyler Technologies, Inc.
Tyler Technologies displays stronger profitability with a favorable net margin of 12.3%, though its return on equity (7.76%) is considered unfavorable. Its balance sheet ratios such as debt to assets (12.32%) and interest coverage (52.96) are solid. Like Atlassian, Tyler does not pay dividends, possibly prioritizing reinvestment in operations or growth initiatives over shareholder payouts.
Which one has the best ratios?
Tyler Technologies holds a slight advantage with 50% of its ratios favorable versus Atlassian’s 35.7%, supported by stronger profitability and interest coverage. However, both companies share weaknesses, including zero dividend yield and some unfavorable efficiency metrics. Overall, Tyler’s slightly favorable ratio profile contrasts with Atlassian’s slightly unfavorable stance.
Strategic Positioning
This section compares the strategic positioning of Atlassian Corporation and Tyler Technologies, Inc., focusing on market position, key segments, and exposure to technological disruption:
Atlassian Corporation
- Larger market cap at 31B, faces competition in software applications
- Focuses on collaboration, project management, developer tools, and enterprise agility
- Offers diverse cloud-based products but no explicit mention of disruption risks
Tyler Technologies, Inc.
- Smaller market cap at 19B, operates in a niche public sector software market
- Concentrates on integrated public sector solutions and judicial software systems
- Has strategic AWS cloud hosting collaboration, indicating technological adaptation
Atlassian Corporation vs Tyler Technologies, Inc. Positioning
Atlassian pursues a diversified software portfolio targeting multiple business and technical teams globally, while Tyler focuses on concentrated public sector solutions. Atlassian’s broader market exposure contrasts with Tyler’s specialization, each offering unique competitive dynamics based on their segment focus.
Which has the best competitive advantage?
Both companies show very unfavorable MOAT evaluations with declining ROIC trends, indicating value destruction and no sustainable competitive advantage based on recent capital efficiency metrics.
Stock Comparison
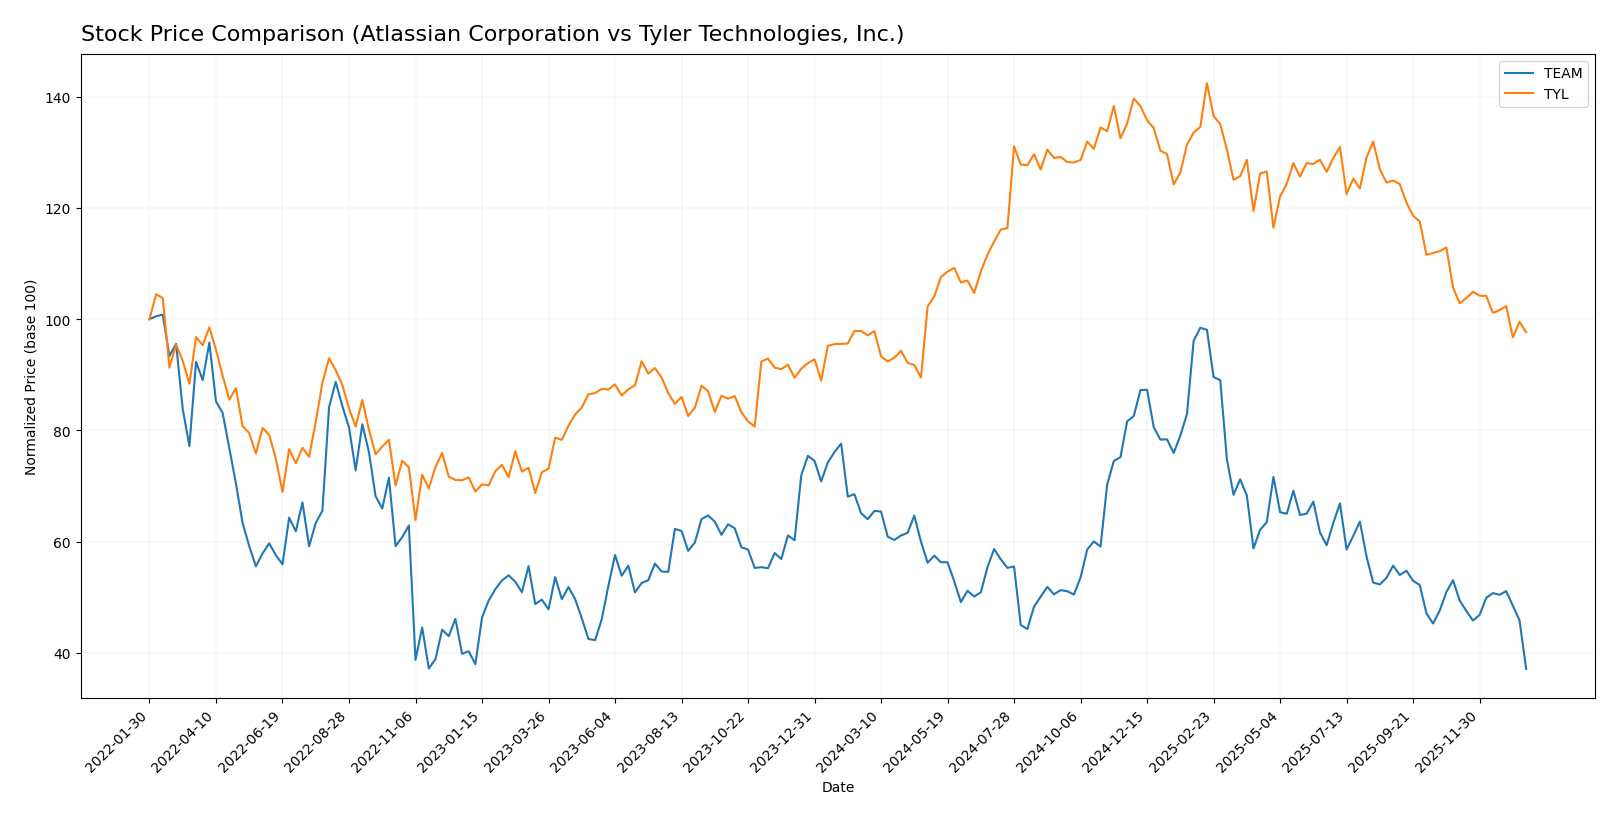
The stock price movements over the past year reveal contrasting dynamics between Atlassian Corporation and Tyler Technologies, Inc., with significant declines for TEAM and marginal gains for TYL amid fluctuating trading volumes.
Trend Analysis
Atlassian Corporation (TEAM) experienced a bearish trend over the past 12 months, with a price decline of -42.01%. The trend shows deceleration, hitting a high of 314.28 and a low of 118.55, with volatility indicated by a 41.22 std deviation.
Tyler Technologies, Inc. (TYL) showed a slight bullish trend with a 0.58% price increase over the last year. Despite deceleration, it reached a high of 641.7 and a low of 403.35, displaying higher volatility with a 61.82 std deviation.
Comparatively, TEAM delivered a substantially weaker market performance than TYL over the past year, with a significant price drop versus a marginal price gain for Tyler Technologies.
Target Prices
The analyst consensus for target prices indicates optimistic upside potential for both Atlassian Corporation and Tyler Technologies, Inc.
| Company | Target High | Target Low | Consensus |
|---|---|---|---|
| Atlassian Corporation | 290 | 185 | 234.14 |
| Tyler Technologies, Inc. | 675 | 470 | 584 |
Analysts expect Atlassian’s stock to rise significantly from the current 118.55 USD toward a consensus target of 234.14 USD, while Tyler Technologies shows a strong upward potential from 440.01 USD to 584 USD consensus. Both stocks present attractive growth opportunities compared to their current market prices.
Analyst Opinions Comparison
This section compares analysts’ ratings and grades for Atlassian Corporation and Tyler Technologies, Inc.:
Rating Comparison
Atlassian Corporation Rating
- Rating: C, considered Very Favorable by evaluators.
- Discounted Cash Flow Score: 5, indicating Very Favorable valuation.
- ROE Score: 1, marked as Very Unfavorable for profitability efficiency.
- ROA Score: 1, very unfavorable asset utilization.
- Debt To Equity Score: 1, very unfavorable financial risk profile.
- Overall Score: 2, indicating Moderate overall financial standing.
Tyler Technologies, Inc. Rating
- Rating: B, considered Very Favorable by evaluators.
- Discounted Cash Flow Score: 4, indicating Favorable valuation.
- ROE Score: 3, marked as Moderate for profitability efficiency.
- ROA Score: 4, favorable asset utilization.
- Debt To Equity Score: 3, moderate financial risk profile.
- Overall Score: 3, indicating Moderate overall financial standing.
Which one is the best rated?
Tyler Technologies holds a higher overall rating (B) and better scores in ROE, ROA, and debt-to-equity, indicating stronger financial efficiency and moderate risk compared to Atlassian’s lower scores and more unfavorable risk profile.
Scores Comparison
Here is a comparison of the Altman Z-Score and Piotroski Score for Atlassian Corporation and Tyler Technologies, Inc.:
TEAM Scores
- Altman Z-Score: 4.70, indicating a safe zone with low bankruptcy risk.
- Piotroski Score: 5, reflecting average financial strength.
TYL Scores
- Altman Z-Score: 7.42, indicating a safe zone with very low bankruptcy risk.
- Piotroski Score: 6, reflecting average financial strength.
Which company has the best scores?
TYL has a higher Altman Z-Score (7.42 vs. 4.70) and a slightly better Piotroski Score (6 vs. 5), indicating generally stronger financial stability and health based on these metrics.
Grades Comparison
Here is a detailed comparison of the latest grades assigned by reputable grading companies to both companies:
Atlassian Corporation Grades
The following table summarizes recent grades from established grading firms for Atlassian Corporation:
| Grading Company | Action | New Grade | Date |
|---|---|---|---|
| BTIG | Maintain | Buy | 2026-01-13 |
| Piper Sandler | Maintain | Overweight | 2026-01-05 |
| Bernstein | Maintain | Outperform | 2025-11-18 |
| Macquarie | Maintain | Outperform | 2025-11-03 |
| Mizuho | Maintain | Outperform | 2025-10-31 |
| Bernstein | Maintain | Outperform | 2025-10-31 |
| TD Cowen | Maintain | Hold | 2025-10-27 |
| BMO Capital | Maintain | Outperform | 2025-10-24 |
| UBS | Maintain | Neutral | 2025-10-24 |
| Keybanc | Maintain | Overweight | 2025-10-23 |
Atlassian’s grades predominantly indicate a positive outlook with multiple “Outperform” and “Buy” ratings, showing consistent confidence from analysts.
Tyler Technologies, Inc. Grades
The following table presents recent grades issued by credible grading companies for Tyler Technologies, Inc.:
| Grading Company | Action | New Grade | Date |
|---|---|---|---|
| Piper Sandler | Maintain | Overweight | 2026-01-13 |
| Wells Fargo | Maintain | Equal Weight | 2026-01-08 |
| DA Davidson | Maintain | Neutral | 2025-12-09 |
| Evercore ISI Group | Maintain | In Line | 2025-10-31 |
| DA Davidson | Maintain | Neutral | 2025-10-31 |
| DA Davidson | Maintain | Neutral | 2025-10-10 |
| DA Davidson | Maintain | Neutral | 2025-08-05 |
| Barclays | Maintain | Overweight | 2025-07-31 |
| Needham | Maintain | Buy | 2025-05-13 |
| Barclays | Maintain | Overweight | 2025-04-25 |
Tyler Technologies shows a mixed but generally positive consensus with several “Overweight” and “Buy” ratings, alongside multiple “Neutral” assessments.
Which company has the best grades?
Atlassian Corporation has received more consistent high-tier ratings such as “Outperform” and “Buy” compared to Tyler Technologies, which has a higher proportion of “Neutral” grades. For investors, Atlassian’s stronger grades may imply a more favorable analyst outlook, potentially influencing confidence and valuation expectations.
Strengths and Weaknesses
Below is a comparative overview of key strengths and weaknesses of Atlassian Corporation (TEAM) and Tyler Technologies, Inc. (TYL) based on the most recent data available.
| Criterion | Atlassian Corporation (TEAM) | Tyler Technologies, Inc. (TYL) |
|---|---|---|
| Diversification | Moderate; relies heavily on License and Service revenue (~4.93B USD in 2025) with limited segments | Moderate; diverse revenue streams including SaaS, Maintenance, Professional Services, and Transaction Fees (~1.42B USD SaaS & fees in 2024) |
| Profitability | Unfavorable; negative net margin (-4.92%) and declining ROIC (-4.48%) indicating value destruction | Mixed; positive net margin (12.3%) but ROIC (6.2%) only neutral and declining trend, some ratios unfavorable |
| Innovation | Challenging; declining ROIC trend suggests struggles in sustaining competitive advantage | Stable; favorable interest coverage and fixed asset turnover reflect efficient operations and investment |
| Global presence | Strong software presence globally but financial metrics show operational struggles | Primarily focused on US public sector markets with steady financial performance |
| Market Share | Significant in collaboration software but facing pressure as indicated by deteriorating profitability | Strong niche player in government software, with consistent revenue growth and operational efficiency |
Key takeaway: Atlassian shows strong revenue from its core software but faces significant profitability challenges and value erosion. Tyler Technologies exhibits better profitability and operational metrics with a stable niche focus, making it a more cautious but potentially safer option for investors.
Risk Analysis
The table below summarizes key risks for Atlassian Corporation (TEAM) and Tyler Technologies, Inc. (TYL) based on their latest financial and market data from 2025 and 2024 respectively.
| Metric | Atlassian Corporation (TEAM) | Tyler Technologies, Inc. (TYL) |
|---|---|---|
| Market Risk | Moderate (Beta 0.89, volatile price range 118-326 USD) | Moderate (Beta 0.92, stable price range 430-661 USD) |
| Debt level | Moderate (Debt/Equity 0.92, debt/assets 20.5%) | Low (Debt/Equity 0.19, debt/assets 12.3%) |
| Regulatory Risk | Moderate (Tech sector, global operations, data privacy concerns) | Moderate (Public sector software, compliance with government regulations) |
| Operational Risk | Moderate (Negative 2025 net margin -4.9%, unfavorable ROE -19%) | Low-Moderate (Positive 2024 net margin 12.3%, solid cash flow) |
| Environmental Risk | Low (Software company, limited direct environmental impact) | Low (Software company, limited direct environmental impact) |
| Geopolitical Risk | Moderate (Headquartered in Australia, global market exposure) | Moderate (US-based, exposure to US government budget changes) |
Atlassian faces notable operational risks highlighted by its negative profitability and return on equity in 2025, alongside moderate debt levels and market volatility. Tyler Technologies shows stronger financial stability and profitability with lower debt, but both companies share moderate regulatory and geopolitical risks due to their sectors and global footprints. Investors should weigh Atlassian’s operational challenges against Tyler’s higher valuation multiples and sector-specific dependencies.
Which Stock to Choose?
Atlassian Corporation (TEAM) shows a favorable income statement with 19.66% revenue growth in 2025 but struggles with profitability, posting negative net margin (-4.92%) and return on equity (-19.08%). Its debt levels are moderate, and the rating is very favorable (C), though financial ratios are slightly unfavorable overall.
Tyler Technologies, Inc. (TYL) presents consistent income growth with a 9.53% revenue increase and a positive 12.3% net margin in 2024. Profitability ratios are mostly favorable, debt is low, and the company holds a very favorable rating (B) supported by a slightly favorable financial ratios profile.
Investors seeking growth might find Atlassian’s strong revenue expansion appealing despite profitability challenges, while those valuing stable profitability and lower financial risk may view Tyler’s solid margins and balanced ratios more favorably. Both companies show declining ROIC relative to WACC, indicating value destruction.
Disclaimer: Investment carries a risk of loss of initial capital. The past performance is not a reliable indicator of future results. Be sure to understand risks before making an investment decision.
Go Further
I encourage you to read the complete analyses of Atlassian Corporation and Tyler Technologies, Inc. to enhance your investment decisions: