In today’s dynamic technology landscape, Strategy Inc (MSTR) and Atlassian Corporation (TEAM) stand out as influential players in the software application industry. Both companies innovate by blending cutting-edge software solutions with unique market strategies—Strategy Inc with its AI-driven analytics and bitcoin treasury focus, and Atlassian with its comprehensive collaboration and project management tools. This article will explore their strengths and risks to determine which company offers the most compelling opportunity for investors.
Table of contents
Companies Overview
I will begin the comparison between Strategy Inc and Atlassian Corporation by providing an overview of these two companies and their main differences.
Strategy Inc Overview
Strategy Inc, formerly known as MicroStrategy Incorporated until August 2025, operates as a bitcoin treasury company and provider of AI-powered enterprise analytics software. Headquartered in Tysons Corner, Virginia, it offers investors various securities tied to Bitcoin and software solutions like Strategy One and Strategy Mosaic. The company was incorporated in 1989 and is positioned in the technology sector with a focus on software applications.
Atlassian Corporation Overview
Atlassian Corporation, founded in 2002 and based in Sydney, Australia, designs and maintains a broad portfolio of software products for project management, collaboration, and software development. Its offerings include Jira, Trello, Confluence, and Bitbucket, targeting both technical and business teams. The company emphasizes enterprise agility and security, serving diverse service teams globally within the technology sector.
Key similarities and differences
Both companies operate in the software application industry and serve enterprise clients worldwide, but their core focuses differ. Strategy Inc centers on bitcoin-related financial products and AI analytics software, while Atlassian specializes in collaborative project management and developer tools. Strategy Inc is U.S.-based with a smaller employee base of 1.5K, whereas Atlassian is Australian with over 12K employees, reflecting differing scales and product scopes.
Income Statement Comparison
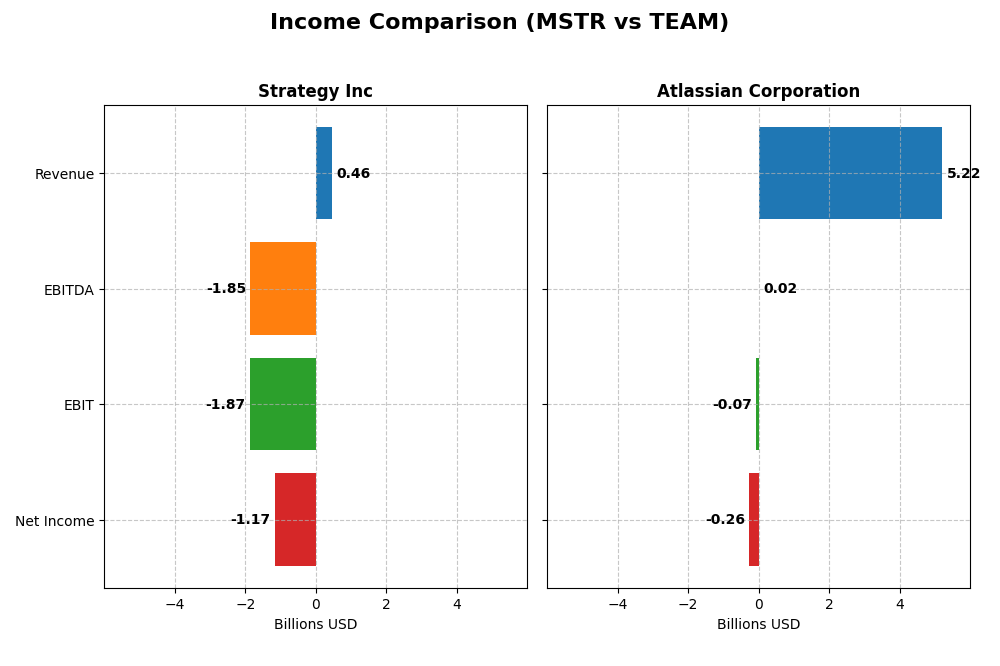
The table below compares the most recent fiscal year income statement metrics for Strategy Inc and Atlassian Corporation, providing a clear snapshot of their financial performance.
| Metric | Strategy Inc (MSTR) | Atlassian Corporation (TEAM) |
|---|---|---|
| Market Cap | 50.3B | 31.1B |
| Revenue | 463M | 5.22B |
| EBITDA | -1.85B | 24.0M |
| EBIT | -1.87B | -68.3M |
| Net Income | -1.17B | -257M |
| EPS | -6.06 | -0.98 |
| Fiscal Year | 2024 | 2025 |
Income Statement Interpretations
Strategy Inc
Strategy Inc’s revenue slightly declined by 6.61% over the last year, continuing a minor overall downward trend from 2020 to 2024. Net income showed significant volatility, culminating in a substantial loss of -1.17B in 2024, sharply reversing a positive 429M in 2023. Gross margin remained strong at 72.06%, but EBIT and net margins deteriorated significantly, reflecting unfavorable profitability and escalating interest expenses.
Atlassian Corporation
Atlassian Corporation exhibited robust revenue growth of 19.66% in the latest year, continuing a strong upward trajectory since 2021. Despite this, net income remained negative at -257M in 2025, though net margin improved by 28.62%. The gross margin was high at 82.84%, and interest expenses were favorably low at 0.59%, while EBIT margin stayed slightly negative, indicating ongoing investment in growth and operational scaling.
Which one has the stronger fundamentals?
Atlassian Corporation presents stronger fundamentals with sustained revenue growth of 149.64% over the period and positive trends in net income, net margin, and EPS growth. Strategy Inc, however, faces unfavorable trends with declining revenues, steep net losses, and worsening margins. Atlassian’s healthier profitability metrics and controlled interest expenses contrast with Strategy Inc’s significant operating and net losses.
Financial Ratios Comparison
Below is a comparison of key financial ratios for Strategy Inc (MSTR) and Atlassian Corporation (TEAM) based on the most recent fiscal data available.
| Ratios | Strategy Inc (MSTR) 2024 | Atlassian Corporation (TEAM) 2025 H1 |
|---|---|---|
| ROE | -6.40% | -19.08% |
| ROIC | -4.38% | -4.48% |
| P/E | -47.80 | -207.13 |
| P/B | 3.06 | 39.51 |
| Current Ratio | 0.71 | 1.22 |
| Quick Ratio | 0.71 | 1.22 |
| D/E (Debt-to-Equity) | 0.40 | 0.92 |
| Debt-to-Assets | 28.09% | 20.51% |
| Interest Coverage | -29.92 | -4.27 |
| Asset Turnover | 0.02 | 0.86 |
| Fixed Asset Turnover | 5.73 | 19.02 |
| Payout Ratio | 0 | 0 |
| Dividend Yield | 0 | 0 |
Interpretation of the Ratios
Strategy Inc
Strategy Inc exhibits mostly unfavorable ratios, with weak profitability indicators such as a net margin of -251.73% and a negative return on equity of -6.4%. Liquidity ratios are below 1, signaling potential short-term financial stress. The company does not pay dividends, likely due to negative net income, and appears focused on reinvestment or strategic priorities rather than shareholder payouts.
Atlassian Corporation
Atlassian shows a mixed ratio profile with some favorable metrics like a reasonable weighted average cost of capital (7.85%) and strong fixed asset turnover (19.02). However, profitability remains challenged, with negative net margin (-4.92%) and return on equity (-19.08%). No dividends are paid, reflecting reinvestment into growth and product development rather than shareholder distributions.
Which one has the best ratios?
Between the two, Atlassian Corporation presents a slightly more balanced ratio profile, with a higher proportion of favorable and neutral metrics compared to Strategy Inc’s predominantly unfavorable ratios. Both companies face profitability concerns, but Atlassian’s liquidity and efficiency ratios offer a somewhat stronger financial footing.
Strategic Positioning
This section compares the strategic positioning of Strategy Inc and Atlassian Corporation, including market position, key segments, and exposure to technological disruption:
Strategy Inc
- Market position and competitive pressure
- Key segments and business drivers
- Exposure to technological disruption
Atlassian Corporation
- Operates as bitcoin treasury and enterprise analytics software provider
- Revenue from License, Maintenance, Subscription, and Technology Services
- Offers AI-powered analytics and bitcoin-related securities
Strategy Inc vs Atlassian Corporation Positioning
Strategy Inc combines cryptocurrency exposure with AI analytics, reflecting a concentrated but innovative strategy. Atlassian offers a broad software portfolio supporting collaboration and project management, representing a diversified approach with multiple business drivers.
Which has the best competitive advantage?
Both companies exhibit very unfavorable MOAT evaluations with declining ROIC below WACC, indicating value destruction. Neither currently demonstrates a sustainable competitive advantage based on efficient capital use and profitability trends.
Stock Comparison
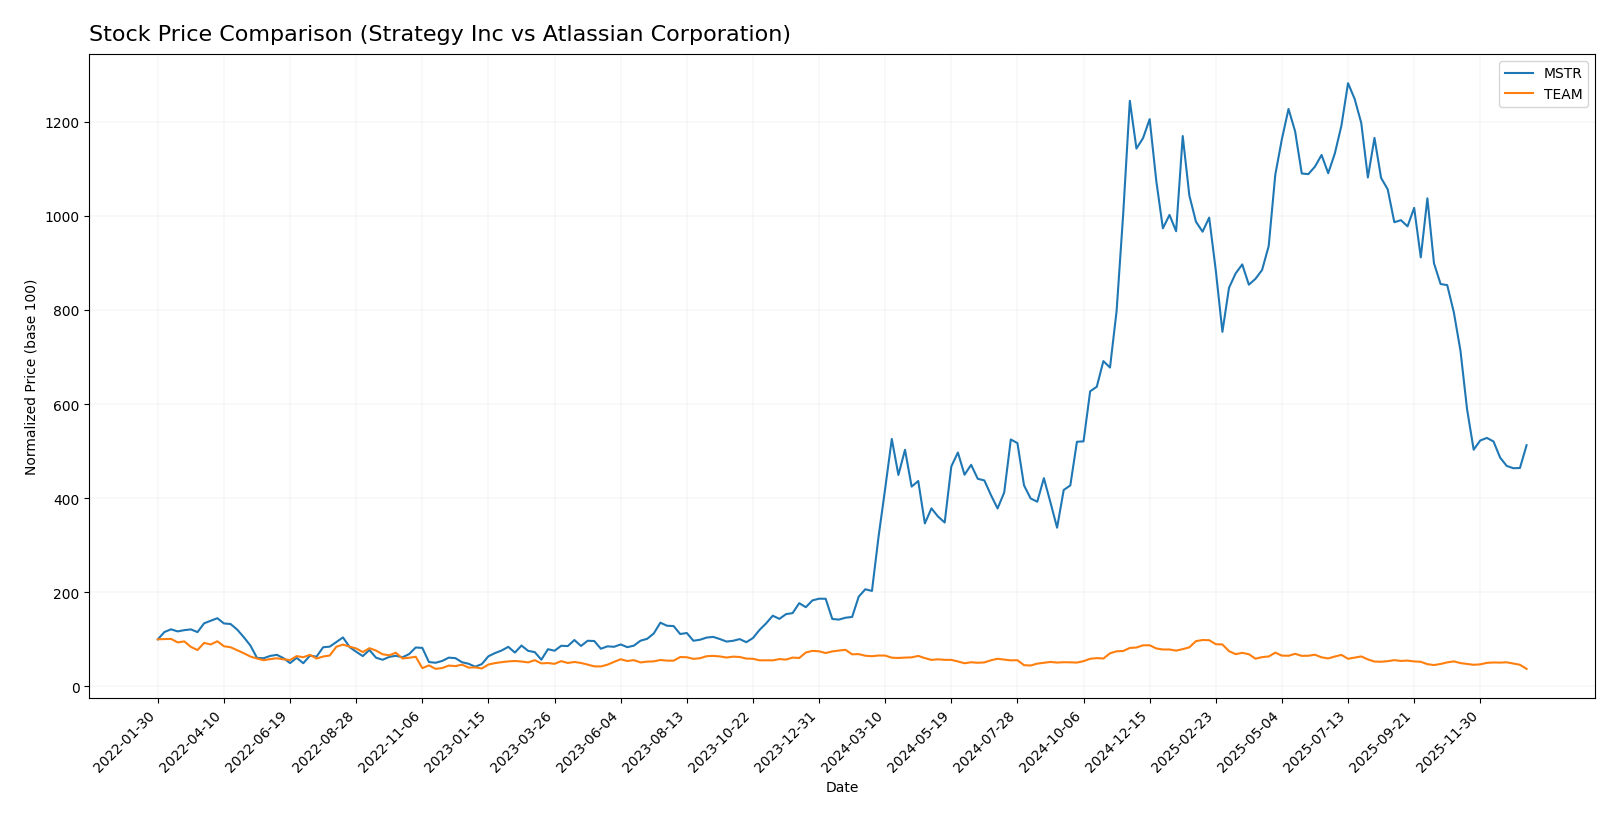
The stock price movements over the past year reveal a significant bullish surge for Strategy Inc, contrasted by a pronounced bearish trend for Atlassian Corporation, with both exhibiting deceleration in momentum during recent months.
Trend Analysis
Strategy Inc’s stock showed a strong bullish trend over the past 12 months, with a 152.71% price increase and high volatility (std deviation 103.09), but the trend decelerated recently with a -35.55% drop. Atlassian Corporation experienced a bearish trend over the same period, losing 42.01% in value with moderate volatility (std deviation 41.22), also showing deceleration and a recent decline of -30.03%. Comparing the two, Strategy Inc outperformed Atlassian Corporation significantly, delivering the highest market performance over the past year.
Target Prices
Here is the current analyst consensus on target prices for Strategy Inc and Atlassian Corporation.
| Company | Target High | Target Low | Consensus |
|---|---|---|---|
| Strategy Inc | 705 | 175 | 433.57 |
| Atlassian Corporation | 290 | 185 | 234.14 |
Analysts expect Strategy Inc’s stock to rise significantly from its current price of 173.71 USD, while Atlassian Corporation’s consensus target is also well above its current trading price of 118.55 USD. This suggests positive market sentiment for both stocks.
Analyst Opinions Comparison
This section compares analysts’ ratings and grades for Strategy Inc and Atlassian Corporation:
Rating Comparison
Strategy Inc Rating
- Rating: A-; rated very favorable overall.
- Discounted Cash Flow Score: 1; very unfavorable valuation.
- ROE Score: 4; favorable efficiency in generating equity profit.
- ROA Score: 5; very favorable asset utilization.
- Debt To Equity Score: 3; moderate financial risk.
Atlassian Corporation Rating
- Rating: C; rated very favorable overall.
- Discounted Cash Flow Score: 5; very favorable valuation.
- ROE Score: 1; very unfavorable efficiency.
- ROA Score: 1; very unfavorable asset utilization.
- Debt To Equity Score: 1; very unfavorable financial risk.
Which one is the best rated?
Based strictly on the provided data, Strategy Inc holds a better overall rating (A-) and stronger profitability and asset utilization scores, whereas Atlassian Corporation scores higher only in discounted cash flow evaluation but falls behind in efficiency and financial stability metrics.
Scores Comparison
Here is a comparison of the Altman Z-Score and Piotroski Score for both companies:
Strategy Inc Scores
- Altman Z-Score: 2.78, positioned in the grey zone, moderate bankruptcy risk
- Piotroski Score: 4, considered average financial strength
Atlassian Corporation Scores
- Altman Z-Score: 4.70, in the safe zone, low bankruptcy risk
- Piotroski Score: 5, also indicating average financial strength
Which company has the best scores?
Atlassian Corporation has a higher Altman Z-Score indicating stronger bankruptcy protection and a slightly better Piotroski Score, suggesting marginally stronger financial health than Strategy Inc.
Grades Comparison
Here is a comparison of the latest available grades for Strategy Inc and Atlassian Corporation:
Strategy Inc Grades
This table summarizes the recent grades assigned by reputable financial institutions to Strategy Inc:
| Grading Company | Action | New Grade | Date |
|---|---|---|---|
| Citigroup | Maintain | Buy | 2025-12-22 |
| Bernstein | Maintain | Outperform | 2025-12-08 |
| Monness, Crespi, Hardt | Upgrade | Neutral | 2025-11-10 |
| HC Wainwright & Co. | Maintain | Buy | 2025-11-03 |
| Canaccord Genuity | Maintain | Buy | 2025-11-03 |
| BTIG | Maintain | Buy | 2025-10-31 |
| TD Cowen | Maintain | Buy | 2025-10-31 |
| Cantor Fitzgerald | Maintain | Overweight | 2025-10-31 |
| Wells Fargo | Downgrade | Equal Weight | 2025-09-30 |
| TD Cowen | Maintain | Buy | 2025-09-16 |
Overall, Strategy Inc has predominantly received Buy and Outperform ratings, with a single recent downgrade to Equal Weight, indicating generally positive but cautious sentiment.
Atlassian Corporation Grades
This table shows recent grades assigned by recognized financial firms to Atlassian Corporation:
| Grading Company | Action | New Grade | Date |
|---|---|---|---|
| BTIG | Maintain | Buy | 2026-01-13 |
| Piper Sandler | Maintain | Overweight | 2026-01-05 |
| Bernstein | Maintain | Outperform | 2025-11-18 |
| Macquarie | Maintain | Outperform | 2025-11-03 |
| Mizuho | Maintain | Outperform | 2025-10-31 |
| Bernstein | Maintain | Outperform | 2025-10-31 |
| TD Cowen | Maintain | Hold | 2025-10-27 |
| BMO Capital | Maintain | Outperform | 2025-10-24 |
| UBS | Maintain | Neutral | 2025-10-24 |
| Keybanc | Maintain | Overweight | 2025-10-23 |
Atlassian Corporation consistently holds Outperform and Buy ratings, with some Hold and Neutral assessments, reflecting strong confidence from analysts.
Which company has the best grades?
Atlassian Corporation has received a higher number of Outperform and Buy grades compared to Strategy Inc’s mixture of Buy, Outperform, and some Neutral or Equal Weight ratings. This suggests a stronger consensus on Atlassian’s growth potential, which may influence investor perception of future performance and risk.
Strengths and Weaknesses
Below is a comparative table summarizing key strengths and weaknesses of Strategy Inc (MSTR) and Atlassian Corporation (TEAM) based on their latest financial and operational data.
| Criterion | Strategy Inc (MSTR) | Atlassian Corporation (TEAM) |
|---|---|---|
| Diversification | Moderate product range; focus on licenses, maintenance, subscriptions, and tech services; revenue concentration in maintenance (about 244M USD in 2024) | Highly diversified with strong license and service revenues (4.93B USD in 2025) and product/service variations |
| Profitability | Negative net margin (-251.7%), declining ROIC (-4.38%), and unfavorable profitability ratios indicate value destruction | Negative net margin (-4.92%) and declining ROIC (-4.48%), but less severe than MSTR; slightly unfavorable overall ratios |
| Innovation | Limited recent growth in ROIC; innovation impact appears weak with declining returns and value | Strong fixed asset turnover (19.02) and favorable WACC suggest operational efficiency, but profitability is challenged |
| Global presence | Moderate, with stable but declining revenue segments and low asset turnover (0.02) | Extensive global footprint supported by high license/service revenue and more balanced financial health |
| Market Share | Smaller scale with revenue around 485M USD in licensing segment | Large market share with revenues in billions and strong license/service growth |
Key takeaways: Both companies face profitability challenges with declining returns on capital. Atlassian exhibits stronger diversification, operational efficiency, and scale, while Strategy Inc struggles with value destruction and limited innovation impact. Caution is warranted, prioritizing risk management when considering these equities.
Risk Analysis
The table below outlines key risks for Strategy Inc (MSTR) and Atlassian Corporation (TEAM) based on the most recent financial and operational data.
| Metric | Strategy Inc (MSTR) | Atlassian Corporation (TEAM) |
|---|---|---|
| Market Risk | High (Beta 3.43, volatile price range 149.75-457.22) | Moderate (Beta 0.89, price range 118.12-326) |
| Debt level | Moderate (Debt to Assets 28%, DE 0.4) | Moderate (Debt to Assets 20.5%, DE 0.92) |
| Regulatory Risk | Moderate (Exposure to multiple international markets) | Moderate (Global software regulations, data privacy concerns) |
| Operational Risk | Moderate (Integration of AI and Bitcoin exposure) | Moderate (Complex product portfolio, cloud security risks) |
| Environmental Risk | Low (Technology sector, limited direct impact) | Low (Technology sector, limited direct impact) |
| Geopolitical Risk | Moderate (Operations in US, EMEA regions) | Moderate (Headquartered in Australia, global operations) |
In summary, Strategy Inc faces the most impactful risk from market volatility due to its high beta and Bitcoin-related exposure, along with operational risks tied to AI and treasury operations. Atlassian’s risks are more balanced, with moderate market and operational risks but stronger financial stability. Both companies exhibit moderate regulatory and geopolitical risks given their international footprints.
Which Stock to Choose?
Strategy Inc (MSTR) shows a declining income with a negative net margin of -251.73% and unfavorable profitability metrics. Its financial ratios are mostly unfavorable, except moderate debt levels and a favorable rating of A-. The firm is shedding value with a very unfavorable moat evaluation.
Atlassian Corporation (TEAM) presents favorable income growth and a strong gross margin of 82.84%, though net margin remains negative at -4.92%. Its financial ratios are slightly unfavorable overall, with some favorable metrics and a very favorable rating of C. Like MSTR, TEAM is also shedding value with a very unfavorable moat.
Investors focused on growth might find TEAM’s favorable income trends and rating more appealing, while those prioritizing financial stability could consider MSTR’s stronger rating and lower debt. However, both companies display challenges in profitability and value creation, suggesting cautious interpretation.
Disclaimer: Investment carries a risk of loss of initial capital. The past performance is not a reliable indicator of future results. Be sure to understand risks before making an investment decision.
Go Further
I encourage you to read the complete analyses of Strategy Inc and Atlassian Corporation to enhance your investment decisions: