In the dynamic software industry, Snowflake Inc. (SNOW) and Atlassian Corporation (TEAM) stand out as leaders driving innovation in data management and collaborative work solutions. Both companies serve overlapping markets with cloud-based platforms, yet they adopt distinct strategies to capture growth. This comparison will help you, as an investor, understand which company offers the most compelling opportunity for your portfolio in 2026.

Table of contents
Companies Overview
I will begin the comparison between Snowflake Inc. and Atlassian Corporation by providing an overview of these two companies and their main differences.
Snowflake Inc. Overview
Snowflake Inc. provides a cloud-based data platform that enables customers to consolidate data into a single source of truth to drive business insights, build data-driven applications, and share data. Operating internationally, Snowflake serves organizations across various industries. Founded in 2012 and headquartered in Bozeman, Montana, the company is positioned as a key player in the software application industry with a market cap of approximately 70.4B USD.
Atlassian Corporation Overview
Atlassian Corporation, headquartered in Sydney, Australia, designs and develops a wide range of software products aimed at improving team collaboration and project management. Its portfolio includes Jira, Confluence, Trello, and several other tools supporting IT, legal, HR, and development teams. Founded in 2002, Atlassian operates globally with a market cap near 31.1B USD, positioning itself as a leader in software applications focused on teamwork and agile project management.
Key similarities and differences
Both Snowflake and Atlassian operate in the technology sector within the software application industry, serving global markets with cloud-based products. However, Snowflake focuses on data platform solutions that centralize and manage enterprise data, while Atlassian specializes in collaboration, project management, and developer tools. Snowflake has a higher market capitalization and fewer employees compared to Atlassian, which offers a broader product portfolio targeted at various team functions.
Income Statement Comparison
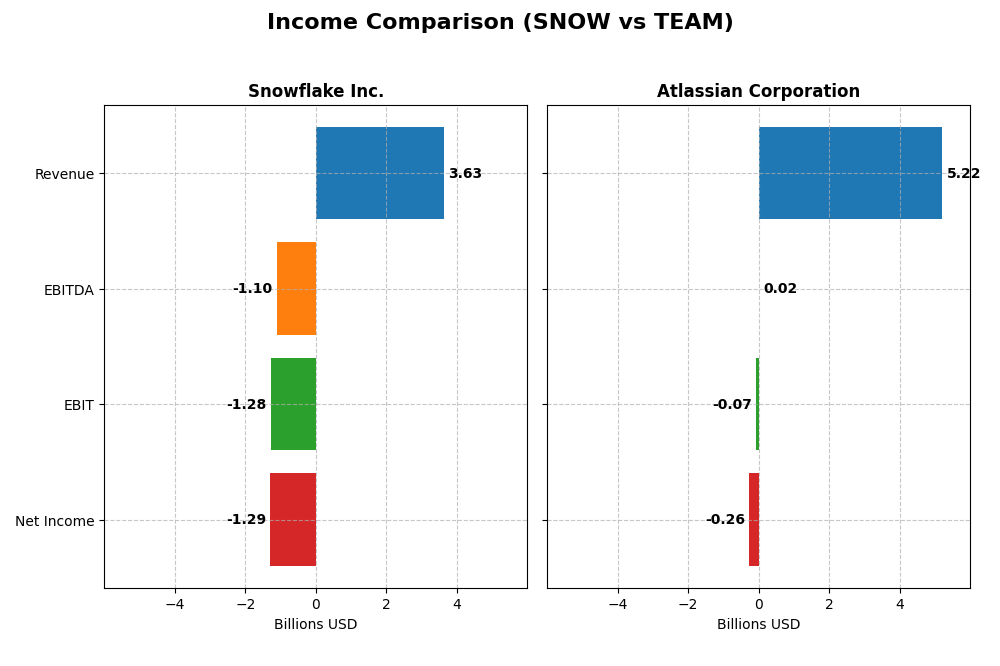
The table below presents a side-by-side comparison of Snowflake Inc. and Atlassian Corporation’s key income statement metrics for their most recent fiscal year, highlighting their financial performance.
| Metric | Snowflake Inc. (SNOW) | Atlassian Corporation (TEAM) |
|---|---|---|
| Market Cap | 70.4B | 31.1B |
| Revenue | 3.63B | 5.22B |
| EBITDA | -1.10B | 24.0M |
| EBIT | -1.28B | -68.3M |
| Net Income | -1.29B | -257M |
| EPS | -3.86 | -0.98 |
| Fiscal Year | 2025 | 2025 |
Income Statement Interpretations
Snowflake Inc.
Snowflake’s revenue increased significantly from 592M in 2021 to 3.63B in 2025, reflecting strong top-line growth. However, net income remained negative, worsening from -539M to -1.29B, with net margins consistently unfavorable around -35%. In 2025, revenue growth accelerated by 29% but net income declined by 19%, indicating margin pressure despite higher sales.
Atlassian Corporation
Atlassian’s revenue rose steadily from 2.09B in 2021 to 5.22B in 2025, with net income improving from -579M to -257M. Gross margins remained robust above 80%, while net margins stayed negative but improved to -4.92% in 2025. The latest year showed 20% revenue growth, accompanied by a 29% net margin improvement and positive EPS growth of 15.5%.
Which one has the stronger fundamentals?
Atlassian demonstrates stronger fundamentals with consistent positive revenue and net income growth, favorable gross margins above 80%, and improving net margins. Snowflake, despite impressive revenue gains, struggles with persistent large net losses and deteriorating profitability metrics. Overall, Atlassian’s income statement evaluations show a more favorable profile compared to Snowflake’s mixed results.
Financial Ratios Comparison
The table below presents a concise comparison of key financial ratios for Snowflake Inc. and Atlassian Corporation based on their most recent fiscal year data.
| Ratios | Snowflake Inc. (2025) | Atlassian Corporation (2025) |
|---|---|---|
| ROE | -42.9% | -19.1% |
| ROIC | -25.2% | -4.5% |
| P/E | -47.0 | -207.1 |
| P/B | 20.1 | 39.5 |
| Current Ratio | 1.75 | 1.22 |
| Quick Ratio | 1.75 | 1.22 |
| D/E | 0.90 | 0.92 |
| Debt-to-Assets | 29.7% | 20.5% |
| Interest Coverage | -528 | -4.27 |
| Asset Turnover | 0.40 | 0.86 |
| Fixed Asset Turnover | 5.53 | 19.02 |
| Payout Ratio | 0 | 0 |
| Dividend Yield | 0 | 0 |
Interpretation of the Ratios
Snowflake Inc.
Snowflake’s ratios present a mixed picture with several unfavorable results, including a negative net margin of -35.45% and a sharply negative return on equity at -42.86%. The company shows a strong current and quick ratio at 1.75, indicating good short-term liquidity, but asset turnover at 0.4 is weak. Snowflake does not pay dividends, reflecting a reinvestment strategy typical for high-growth tech firms.
Atlassian Corporation
Atlassian’s ratios also reveal challenges, with a negative net margin of -4.92% and return on equity at -19.08%, though less severe than Snowflake’s. The company has a favorable weighted average cost of capital at 7.85% and a solid quick ratio of 1.22. Atlassian does not pay dividends either, consistent with a strategy focused on growth and reinvestment rather than shareholder payouts.
Which one has the best ratios?
Both companies face profitability issues with negative margins and returns, while liquidity ratios favor Snowflake slightly due to higher current and quick ratios. Atlassian shows a better cost of capital and asset turnover, but a higher price-to-book ratio. Overall, both are rated slightly unfavorable, reflecting risks typical for growth-oriented software firms without dividend income.
Strategic Positioning
This section compares the strategic positioning of Snowflake Inc. and Atlassian Corporation, focusing on market position, key segments, and exposure to technological disruption:
Snowflake Inc.
- Positioned in cloud-based data platforms with strong competition in software applications.
- Focuses on cloud data platform products and professional services driving revenue growth.
- Faces disruption risks from evolving cloud technologies and data platform innovations.
Atlassian Corporation
- Competes in software applications with broad project management and collaboration tools globally.
- Diverse software portfolio including project management, collaboration, security, and developer tools.
- Exposed to disruption through evolving software development, security, and collaboration technologies.
Snowflake Inc. vs Atlassian Corporation Positioning
Snowflake concentrates on cloud data platforms, leveraging data consolidation as its core driver, whereas Atlassian offers a diversified software suite addressing project management, collaboration, and security. Snowflake’s focused approach contrasts with Atlassian’s broad product range.
Which has the best competitive advantage?
Both companies show declining ROIC trends below WACC, indicating value destruction and very unfavorable moats, suggesting neither currently holds a sustainable competitive advantage based on ROIC efficiency.
Stock Comparison
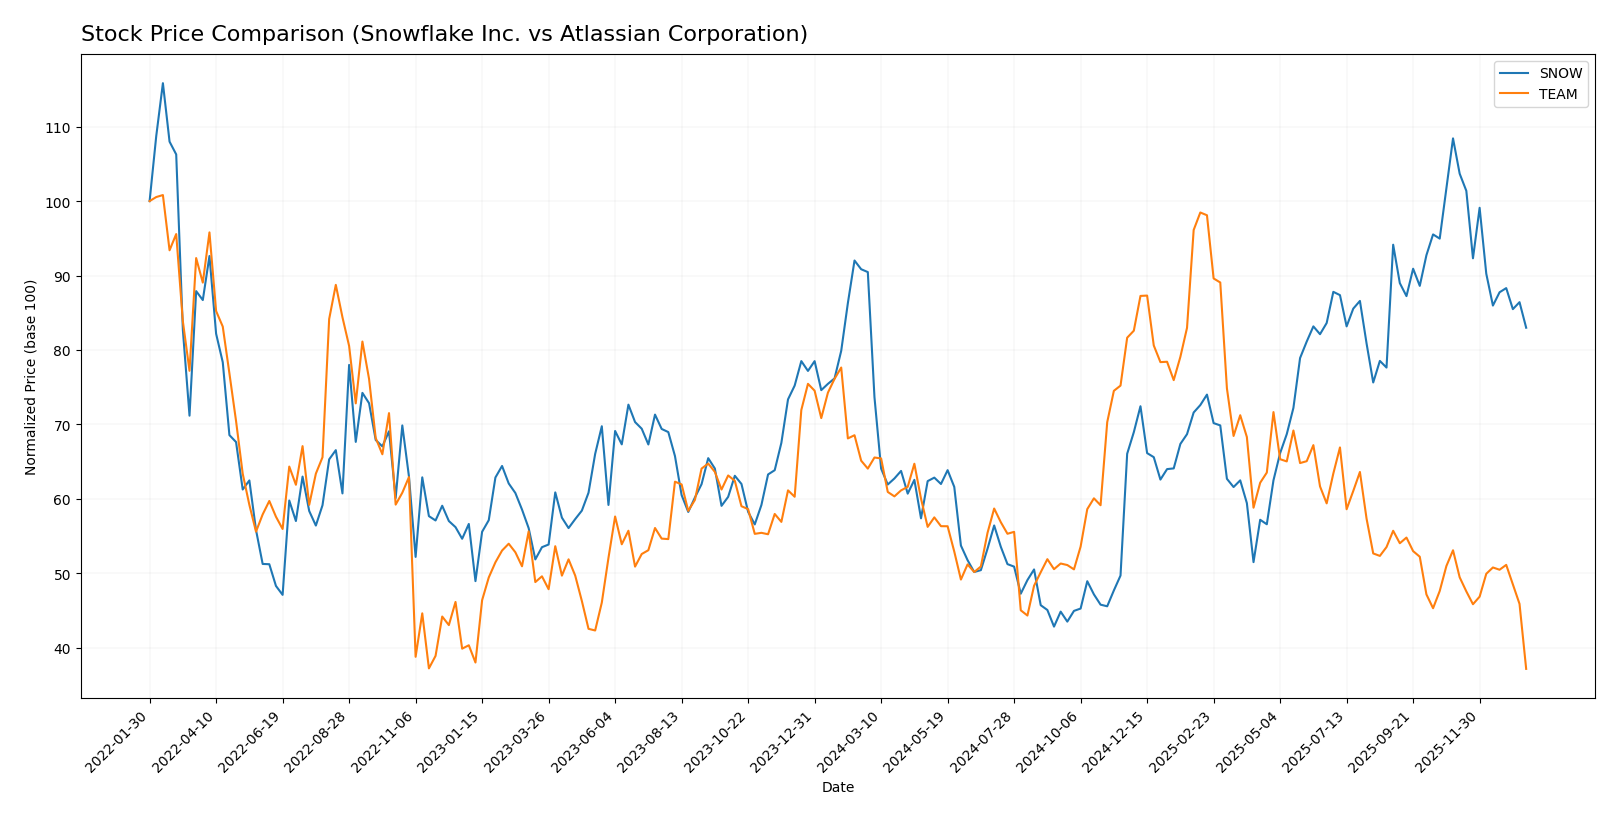
The stock price movements of Snowflake Inc. and Atlassian Corporation over the past year reveal significant bearish trends with marked declines and decelerating momentum, reflecting challenging trading dynamics for both companies.
Trend Analysis
Snowflake Inc. (SNOW) experienced a bearish trend with an overall price decline of 8.27% over the past 12 months, accompanied by decelerating downward momentum and a high price volatility of 42.6%. The recent period shows an accelerated drop of 23.46%.
Atlassian Corporation (TEAM) recorded a more pronounced bearish trend, with a 42.01% price decrease over the same 12-month span, also showing deceleration and a volatility level of 41.22%. Its recent decline reached 30.03%, indicating continued selling pressure.
Comparing both stocks, Atlassian underperformed Snowflake, delivering the lowest market returns over the past year, with both companies facing seller dominance in recent trading periods.
Target Prices
Analysts provide a clear consensus on target prices for Snowflake Inc. and Atlassian Corporation, reflecting optimistic growth expectations.
| Company | Target High | Target Low | Consensus |
|---|---|---|---|
| Snowflake Inc. | 325 | 237 | 281.86 |
| Atlassian Corporation | 290 | 185 | 234.14 |
The target consensus for Snowflake is about 34% above its current price of 210.38 USD, indicating strong upside potential. Atlassian’s consensus target is nearly double its current price of 118.55 USD, suggesting significant expected growth from analysts.
Analyst Opinions Comparison
This section compares analysts’ ratings and financial scores for Snowflake Inc. and Atlassian Corporation:
Rating Comparison
Snowflake Inc. Rating
- Rating: C- with a “Very Favorable” status
- Discounted Cash Flow Score: 3, indicating “Moderate”
- ROE Score: 1, indicating “Very Unfavorable”
- ROA Score: 1, indicating “Very Unfavorable”
- Debt To Equity Score: 1, indicating “Very Unfavorable”
- Overall Score: 1, indicating “Very Unfavorable”
Atlassian Corporation Rating
- Rating: C with a “Very Favorable” status
- Discounted Cash Flow Score: 5, indicating “Very Favorable”
- ROE Score: 1, indicating “Very Unfavorable”
- ROA Score: 1, indicating “Very Unfavorable”
- Debt To Equity Score: 1, indicating “Very Unfavorable”
- Overall Score: 2, indicating “Moderate”
Which one is the best rated?
Atlassian holds a slightly better overall rating with a C and a moderate overall score of 2, compared to Snowflake’s C- and a very unfavorable overall score of 1. Atlassian’s discounted cash flow score is also notably higher.
Scores Comparison
The comparison of Snowflake Inc. and Atlassian Corporation scores highlights their financial stability and strength:
Snowflake Inc. Scores
- Altman Z-Score: 5.36, indicating a safe zone with low bankruptcy risk.
- Piotroski Score: 4, categorized as average financial strength.
Atlassian Corporation Scores
- Altman Z-Score: 4.70, also in the safe zone, reflecting financial stability.
- Piotroski Score: 5, slightly stronger but still average financial strength.
Which company has the best scores?
Both companies show strong financial stability with Altman Z-Scores in the safe zone. Atlassian has a marginally higher Piotroski Score, suggesting slightly better financial health based on provided data.
Grades Comparison
Here is the grades comparison for Snowflake Inc. and Atlassian Corporation from reputable grading companies:
Snowflake Inc. Grades
This table summarizes recent grades and rating actions for Snowflake Inc.:
| Grading Company | Action | New Grade | Date |
|---|---|---|---|
| Barclays | downgrade | Equal Weight | 2026-01-12 |
| Argus Research | upgrade | Buy | 2026-01-08 |
| Citigroup | maintain | Buy | 2025-12-08 |
| Wells Fargo | maintain | Overweight | 2025-12-04 |
| Keybanc | maintain | Overweight | 2025-12-04 |
| Piper Sandler | maintain | Overweight | 2025-12-04 |
| Morgan Stanley | maintain | Overweight | 2025-12-04 |
| Wedbush | maintain | Outperform | 2025-12-04 |
| Deutsche Bank | maintain | Buy | 2025-12-04 |
| Cantor Fitzgerald | maintain | Overweight | 2025-12-04 |
Snowflake Inc. shows a predominantly positive trend with multiple consistent “Overweight,” “Buy,” and “Outperform” ratings, despite a recent downgrade from Barclays.
Atlassian Corporation Grades
This table summarizes recent grades and rating actions for Atlassian Corporation:
| Grading Company | Action | New Grade | Date |
|---|---|---|---|
| BTIG | maintain | Buy | 2026-01-13 |
| Piper Sandler | maintain | Overweight | 2026-01-05 |
| Bernstein | maintain | Outperform | 2025-11-18 |
| Macquarie | maintain | Outperform | 2025-11-03 |
| Mizuho | maintain | Outperform | 2025-10-31 |
| Bernstein | maintain | Outperform | 2025-10-31 |
| TD Cowen | maintain | Hold | 2025-10-27 |
| BMO Capital | maintain | Outperform | 2025-10-24 |
| UBS | maintain | Neutral | 2025-10-24 |
| Keybanc | maintain | Overweight | 2025-10-23 |
Atlassian Corporation displays stable positive ratings with several “Outperform,” “Buy,” and “Overweight” grades, accompanied by a few neutral or hold ratings.
Which company has the best grades?
Both Snowflake Inc. and Atlassian Corporation hold predominantly positive grades with consensus “Buy” ratings. Snowflake’s mix includes many “Overweight” and “Buy” grades with one recent downgrade, while Atlassian maintains a strong “Outperform” presence. Investors may interpret these patterns as reflecting confidence balanced with some caution for Snowflake and steady optimism for Atlassian.
Strengths and Weaknesses
The table below summarizes key strengths and weaknesses of Snowflake Inc. (SNOW) and Atlassian Corporation (TEAM) based on recent financial and operational data.
| Criterion | Snowflake Inc. (SNOW) | Atlassian Corporation (TEAM) |
|---|---|---|
| Diversification | Moderate: Revenue mainly from Product (3.46B) and Services (164M) | Moderate: Revenue mainly from License and Service (4.93B) and Other (285M) |
| Profitability | Weak: Negative net margin (-35.45%), ROIC (-25.24%), and ROE (-42.86%) | Weak: Negative net margin (-4.92%), ROIC (-4.48%), and ROE (-19.08%) |
| Innovation | Moderate: High fixed asset turnover (5.53) but declining ROIC (-139%) | Strong fixed asset turnover (19.02), but also declining ROIC (-133%) |
| Global presence | Solid: Growing product revenue over 5 years indicates expanding market acceptance | Solid: Steady growth in license and service revenue signals global traction |
| Market Share | Challenged: Very unfavorable economic moat indicating value destruction | Challenged: Very unfavorable economic moat, also value destroying |
Both companies show strong revenue growth and market presence in their niches but struggle significantly with profitability and efficient capital use. Their declining ROIC trends and negative returns indicate caution for investors focused on value creation.
Risk Analysis
Below is a comparative table summarizing the key risks for Snowflake Inc. and Atlassian Corporation based on the most recent 2025 data:
| Metric | Snowflake Inc. (SNOW) | Atlassian Corporation (TEAM) |
|---|---|---|
| Market Risk | Beta 1.14, moderately volatile | Beta 0.89, lower volatility |
| Debt Level | Debt-to-Equity 0.9, moderate | Debt-to-Equity 0.92, moderate |
| Regulatory Risk | US-based, subject to US tech regulations | Australia-based, exposure to multiple jurisdictions |
| Operational Risk | Negative net margin (-35.45%), negative ROE (-42.86%) | Negative net margin (-4.92%), negative ROE (-19.08%) |
| Environmental Risk | Moderate, no dividend to offset costs | Moderate, no dividend to offset costs |
| Geopolitical Risk | US market focus, potential trade tensions | Exposure to global markets, some geopolitical diversification |
The most impactful and likely risks for both companies are operational, given their negative profitability metrics and ongoing investments that pressure margins. Snowflake’s higher beta indicates greater market sensitivity, while Atlassian’s broader international exposure introduces geopolitical uncertainties. Debt levels are moderate but warrant monitoring alongside weak interest coverage ratios. Both firms show solid financial stability scores, reducing bankruptcy risk, but investors should carefully manage exposure to their ongoing profitability challenges.
Which Stock to Choose?
Snowflake Inc. (SNOW) shows strong revenue growth of 29.21% in 2025 but struggles with negative profitability metrics, including a -35.45% net margin and -42.86% ROE. Its debt level is moderate with a debt-to-equity ratio around 0.9, but financial ratios are slightly unfavorable overall, and the company’s rating is very favorable.
Atlassian Corporation (TEAM) reports solid revenue growth of 19.66% in 2025 with better profitability indicators than SNOW, despite a negative net margin of -4.92% and ROE of -19.08%. Its debt is lower relative to assets, financial ratios are slightly unfavorable but with a favorable income statement, and it holds a very favorable rating.
Investors prioritizing growth might find Snowflake’s aggressive revenue expansion appealing despite profitability challenges, while those valuing a more stable income profile and healthier margins could view Atlassian as more favorable. Both companies show declining ROIC trends with very unfavorable moat evaluations, indicating value destruction risks.
Disclaimer: Investment carries a risk of loss of initial capital. The past performance is not a reliable indicator of future results. Be sure to understand risks before making an investment decision.
Go Further
I encourage you to read the complete analyses of Snowflake Inc. and Atlassian Corporation to enhance your investment decisions: