In the fast-evolving software industry, Shopify Inc. (SHOP) and Atlassian Corporation (TEAM) stand out as influential players driving innovation in digital commerce and team collaboration. Both companies operate within the software application sector, targeting overlapping markets by empowering businesses with scalable technology solutions. This comparison will explore their strategic positioning and growth potential, helping you decide which stock could be the most compelling addition to your investment portfolio.
Table of contents
Companies Overview
I will begin the comparison between Shopify Inc. and Atlassian Corporation by providing an overview of these two companies and their main differences.
Shopify Inc. Overview
Shopify Inc. is a Canadian commerce company that offers a comprehensive platform enabling merchants to manage and sell products across multiple channels including web, mobile, social media, and physical retail. Its services encompass product management, payment processing, order fulfillment, and customer relationship tools. Founded in 2004 and headquartered in Ottawa, Shopify operates globally with a market cap of approximately 205B USD.
Atlassian Corporation Overview
Atlassian Corporation is an Australian software company specializing in collaboration and project management tools for technical and business teams. Its suite includes Jira, Confluence, Trello, and various enterprise solutions focused on workflow optimization, security, and agile business practices. Founded in 2002 and headquartered in Sydney, Atlassian has a market cap of about 32B USD and employs over 12K staff.
Key similarities and differences
Both Shopify and Atlassian operate in the software application industry and serve a global customer base through cloud-based platforms. Shopify focuses on e-commerce solutions facilitating online and offline sales, while Atlassian centers on software tools that enhance team collaboration and project management. Their business models differ in target markets: Shopify addresses merchants and retailers, whereas Atlassian caters primarily to enterprises and development teams.
Income Statement Comparison
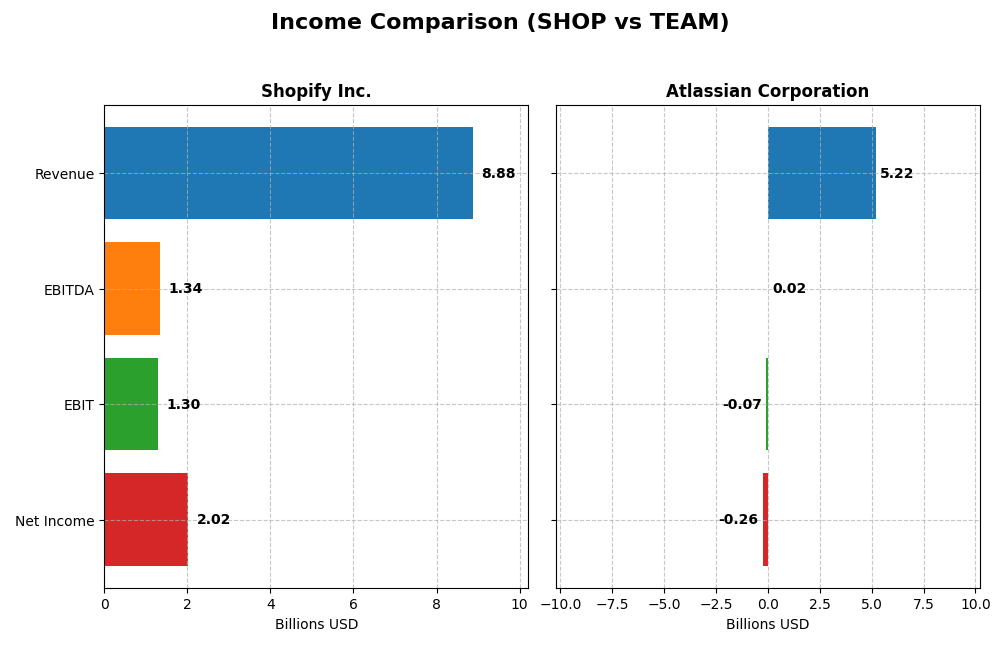
The table below presents a side-by-side comparison of key income statement metrics for Shopify Inc. and Atlassian Corporation for their most recent fiscal years.
| Metric | Shopify Inc. (SHOP) | Atlassian Corporation (TEAM) |
|---|---|---|
| Market Cap | 205.1B | 32.1B |
| Revenue | 8.88B | 5.22B |
| EBITDA | 1.34B | 24.0M |
| EBIT | 1.30B | -68.3M |
| Net Income | 2.02B | -257M |
| EPS | 1.56 | -0.98 |
| Fiscal Year | 2024 | 2025 |
Income Statement Interpretations
Shopify Inc.
Shopify’s revenue and net income demonstrated strong growth from 2020 to 2024, with revenue increasing by over 200% and net income surging more than 500%. Margins improved notably, with a gross margin of 50.36% and a net margin of 22.74% in 2024. The most recent year showed significant margin expansion and a sharp rise in net income, signaling enhanced profitability.
Atlassian Corporation
Atlassian’s revenue grew steadily by nearly 150% from 2021 to mid-2025, while net income remained negative but improved by over 55%. The company maintained a high gross margin of 82.84%, though EBIT and net margins were negative in 2025. Despite unfavorable operating margins, recent improvements in net margin and EPS growth indicate progress toward profitability.
Which one has the stronger fundamentals?
Shopify exhibits stronger fundamentals with consistently favorable margins, substantial net income growth, and positive EBIT margins. Atlassian shows mixed results, with excellent gross margins but persistent operating losses and negative net margins. While both companies grew revenue, Shopify’s profitability metrics and margin improvements present a more favorable income statement profile.
Financial Ratios Comparison
The table below presents a side-by-side comparison of key financial ratios for Shopify Inc. (SHOP) and Atlassian Corporation (TEAM), based on the most recent available fiscal data.
| Ratios | Shopify Inc. (2024) | Atlassian Corporation (2025) |
|---|---|---|
| ROE | 17.5% | -19.1% |
| ROIC | 7.5% | -4.5% |
| P/E | 68.2 | -207.1 |
| P/B | 11.9 | 39.5 |
| Current Ratio | 3.71 | 1.22 |
| Quick Ratio | 3.70 | 1.22 |
| D/E | 0.10 | 0.92 |
| Debt-to-Assets | 8.1% | 20.5% |
| Interest Coverage | 0 | -4.3 |
| Asset Turnover | 0.64 | 0.86 |
| Fixed Asset Turnover | 63.4 | 19.0 |
| Payout Ratio | 0 | 0 |
| Dividend Yield | 0 | 0 |
Interpretation of the Ratios
Shopify Inc.
Shopify’s financial ratios show a mix of strengths and weaknesses. It has a strong net margin of 22.74% and favorable return on equity at 17.47%, but challenges include a high price-to-earnings ratio of 68.18 and an unfavorable current ratio of 3.71. The company does not pay dividends, likely reflecting a reinvestment strategy to fuel growth and innovation without share buyback programs.
Atlassian Corporation
Atlassian exhibits several unfavorable ratios, including a negative net margin of -4.92% and return on equity at -19.08%. While its weighted average cost of capital is favorable at 7.81%, concerns arise from a high price-to-book ratio of 39.51 and negative interest coverage. Atlassian also does not pay dividends, consistent with a focus on reinvestment in R&D and growth initiatives.
Which one has the best ratios?
Shopify presents a slightly more favorable ratio profile, benefiting from positive profitability and return measures despite valuation concerns. Atlassian’s ratios are more skewed toward unfavorable, with losses and weak returns dominating. Overall, Shopify’s balanced strengths provide a comparatively better foundation than Atlassian’s current financial metrics.
Strategic Positioning
This section compares the strategic positioning of Shopify Inc. and Atlassian Corporation, focusing on market position, key segments, and exposure to technological disruption:
Shopify Inc.
- Large market cap of 205B USD, facing competition in commerce platform software.
- Key segments include Merchant and Subscription Solutions driving commerce services globally.
- Platform-based commerce solutions exposed to evolving e-commerce technologies.
Atlassian Corporation
- Smaller market cap of 32B USD, competing in project management software.
- Key segments are License, Maintenance, and Subscription for collaboration software suite.
- Diverse software tools with potential disruption from new enterprise collaboration technologies.
Shopify Inc. vs Atlassian Corporation Positioning
Shopify’s strategy focuses on a commerce platform with diversified merchant and subscription services, while Atlassian concentrates on integrated software tools for team collaboration. Shopify’s global commerce scope contrasts with Atlassian’s focus on enterprise software segments.
Which has the best competitive advantage?
Both companies are currently shedding value with ROIC below WACC. Shopify shows improving profitability trends, whereas Atlassian faces declining returns, indicating Shopify has a relatively more favorable competitive advantage.
Stock Comparison
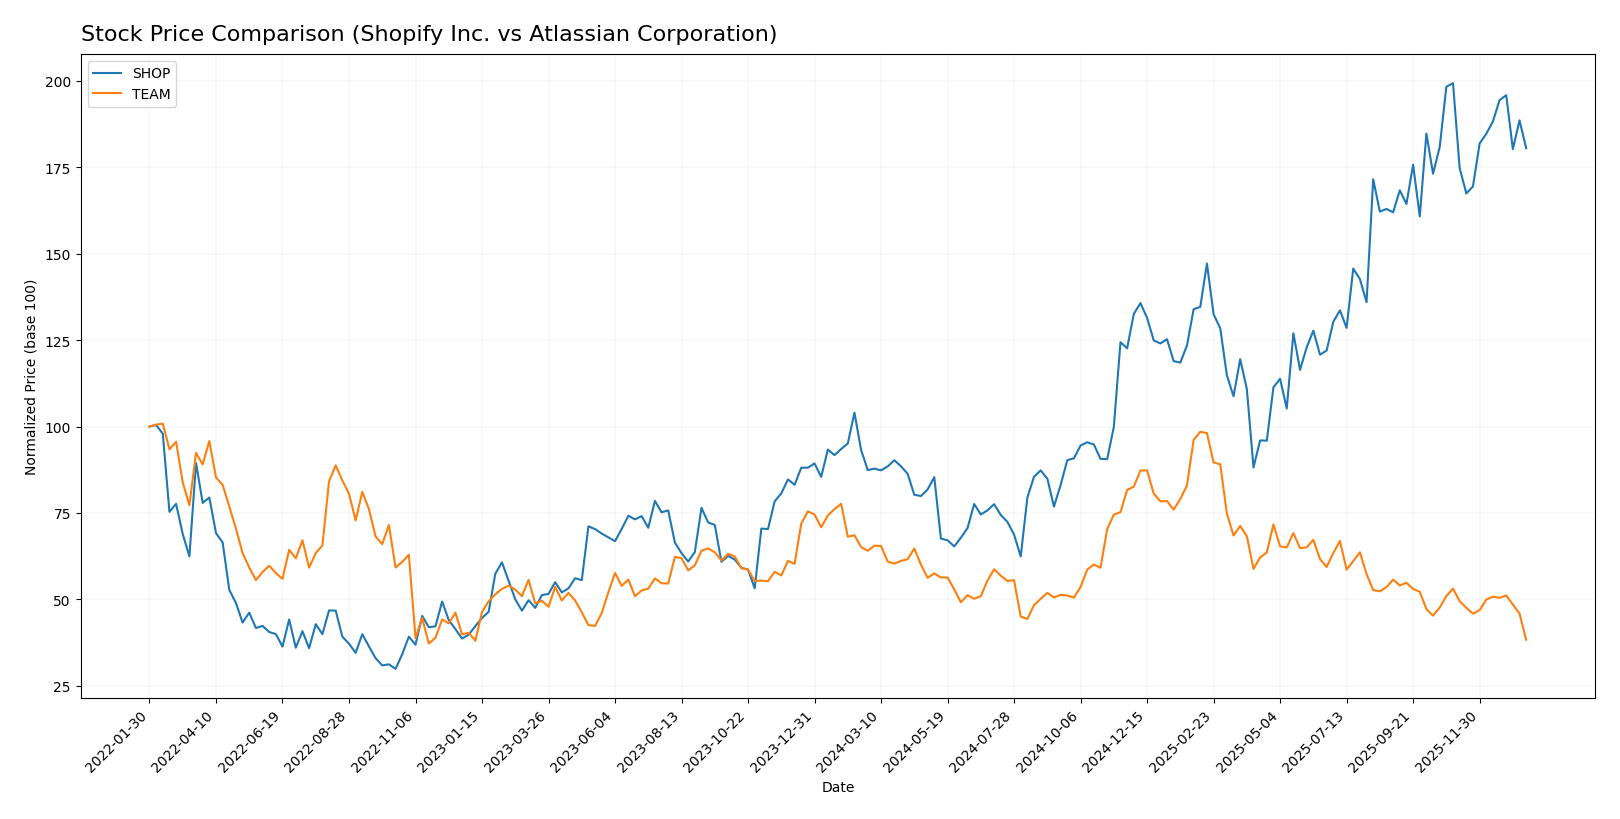
The stock price movements of Shopify Inc. and Atlassian Corporation over the past 12 months reveal divergent trajectories, with Shopify showing strong gains despite recent pullbacks, while Atlassian faces a sustained decline amid volatile trading dynamics.
Trend Analysis
Shopify Inc. exhibited a bullish trend over the past year with a 106.53% price increase, though the trend shows deceleration and a notable volatility level with a 33.71 standard deviation. Recent months saw a minor 9.43% decline but maintained a slight positive slope.
Atlassian Corporation experienced a bearish trend with a 40.17% price drop over 12 months, accompanied by a decelerating decline and higher volatility at 41.15 standard deviation. Its recent trend worsened with a 27.81% decrease and a negative slope.
Comparing these trends, Shopify outperformed Atlassian significantly, delivering the highest market performance with a strong overall gain versus Atlassian’s continuous loss.
Target Prices
The current analyst consensus presents optimistic target prices for both Shopify Inc. and Atlassian Corporation.
| Company | Target High | Target Low | Consensus |
|---|---|---|---|
| Shopify Inc. | 200 | 140 | 186.24 |
| Atlassian Corporation | 290 | 185 | 234.14 |
Analysts expect Shopify’s stock to rise above its current price of 157.55 USD, with a consensus target near 186 USD. Atlassian’s target consensus is significantly higher than its 122.31 USD current price, indicating strong expected growth.
Analyst Opinions Comparison
This section compares analysts’ ratings and grades for Shopify Inc. and Atlassian Corporation:
Rating Comparison
SHOP Rating
- Rating: B, considered very favorable by analysts.
- Discounted Cash Flow Score: Moderate at 3, indicating average valuation.
- ROE Score: Favorable at 4, showing efficient profit generation.
- ROA Score: Very favorable at 5, reflecting excellent asset utilization.
- Debt To Equity Score: Moderate at 3, indicating average financial risk.
- Overall Score: Moderate at 3, representing a balanced overall financial health.
TEAM Rating
- Rating: C, also regarded as very favorable by analysts.
- Discounted Cash Flow Score: Very favorable at 5, suggesting strong valuation.
- ROE Score: Very unfavorable at 1, indicating poor profit efficiency.
- ROA Score: Very unfavorable at 1, reflecting weak asset utilization.
- Debt To Equity Score: Very unfavorable at 1, signaling high financial risk.
- Overall Score: Moderate at 2, showing slightly weaker overall financial health.
Which one is the best rated?
Shopify holds a better overall rating (B) compared to Atlassian’s C, with stronger ROE and ROA scores and a more balanced debt profile. Atlassian excels only in discounted cash flow valuation.
Scores Comparison
Here is a comparison of the Altman Z-Score and Piotroski Score for Shopify Inc. and Atlassian Corporation:
SHOP Scores
- Altman Z-Score: 50.42, indicating a safe zone for bankruptcy risk.
- Piotroski Score: 6, reflecting average financial strength.
TEAM Scores
- Altman Z-Score: 4.70, also in the safe zone for bankruptcy risk.
- Piotroski Score: 5, reflecting average financial strength.
Which company has the best scores?
Shopify has a significantly higher Altman Z-Score than Atlassian, suggesting stronger financial safety. Both have similar average Piotroski Scores, indicating comparable financial strength.
Grades Comparison
Here is the comparison of recent grades and ratings for Shopify Inc. and Atlassian Corporation:
Shopify Inc. Grades
This table summarizes the recent grades issued by reliable grading companies for Shopify Inc.:
| Grading Company | Action | New Grade | Date |
|---|---|---|---|
| Scotiabank | Upgrade | Sector Outperform | 2026-01-08 |
| Wolfe Research | Downgrade | Peer Perform | 2026-01-06 |
| Wells Fargo | Maintain | Overweight | 2025-12-17 |
| Truist Securities | Maintain | Hold | 2025-11-05 |
| CIBC | Maintain | Outperform | 2025-11-05 |
| Cantor Fitzgerald | Maintain | Neutral | 2025-11-05 |
| DA Davidson | Maintain | Buy | 2025-11-05 |
| Scotiabank | Maintain | Sector Perform | 2025-11-05 |
| Needham | Maintain | Buy | 2025-11-05 |
| JP Morgan | Maintain | Overweight | 2025-11-05 |
Shopify’s grades show a mix of “Buy,” “Outperform,” and “Hold,” with one recent upgrade and one downgrade, indicating some divergence in analyst views.
Atlassian Corporation Grades
This table summarizes the recent grades issued by reliable grading companies for Atlassian Corporation:
| Grading Company | Action | New Grade | Date |
|---|---|---|---|
| BTIG | Maintain | Buy | 2026-01-13 |
| Piper Sandler | Maintain | Overweight | 2026-01-05 |
| Bernstein | Maintain | Outperform | 2025-11-18 |
| Macquarie | Maintain | Outperform | 2025-11-03 |
| Mizuho | Maintain | Outperform | 2025-10-31 |
| Bernstein | Maintain | Outperform | 2025-10-31 |
| TD Cowen | Maintain | Hold | 2025-10-27 |
| BMO Capital | Maintain | Outperform | 2025-10-24 |
| UBS | Maintain | Neutral | 2025-10-24 |
| Keybanc | Maintain | Overweight | 2025-10-23 |
Atlassian presents a strong and consistent trend of “Outperform,” “Buy,” and “Overweight” ratings, with no downgrades, suggesting stable analyst confidence.
Which company has the best grades?
Atlassian Corporation holds generally stronger and more consistent grades than Shopify Inc., with multiple “Outperform” and “Buy” ratings maintained recently. This suggests a more uniform positive outlook from analysts, which could influence investor sentiment towards perceived stability and growth potential. Shopify’s more mixed grades reflect a less unanimous analyst consensus, potentially implying higher uncertainty for investors.
Strengths and Weaknesses
Below is a comparative overview of key strengths and weaknesses for Shopify Inc. (SHOP) and Atlassian Corporation (TEAM), based on their latest financial and operational data.
| Criterion | Shopify Inc. (SHOP) | Atlassian Corporation (TEAM) |
|---|---|---|
| Diversification | Moderate: Focused on e-commerce and subscription services, with steady growth in Merchant Solutions and Subscription segments. | Moderate: Primarily software licenses and services, with some diversification in maintenance and other product lines. |
| Profitability | Favorable net margin (22.74%) and ROE (17.47%), but ROIC below WACC indicating value destruction despite improving trend. | Unfavorable profitability metrics: negative net margin (-4.92%), ROE (-19.08%), and ROIC with declining trend, signaling value destruction. |
| Innovation | High fixed asset turnover (63.43) and growing ROIC trend suggest operational efficiency and innovation potential. | Moderate innovation with favorable fixed asset turnover (19.02), but declining ROIC and profitability raise concerns about sustainable innovation. |
| Global presence | Strong global reach supporting significant revenue growth in services and subscriptions. | Global software presence with growing license and service revenues, but profitability challenges may limit expansion. |
| Market Share | Significant player in e-commerce platform market, continuously expanding merchant solutions. | Important player in collaboration software, though profitability issues may impact competitive positioning. |
Key takeaways: Shopify shows strong profitability and operational efficiency with improving capital returns, despite current value destruction. Atlassian faces profitability headwinds and declining capital efficiency, raising caution despite its market presence and product diversification. Investors should weigh Shopify’s growth potential against Atlassian’s current financial challenges.
Risk Analysis
Below is a comparative table of key risks for Shopify Inc. and Atlassian Corporation based on the most recent data available:
| Metric | Shopify Inc. (SHOP) | Atlassian Corporation (TEAM) |
|---|---|---|
| Market Risk | High beta at 2.84, indicating high volatility and sensitivity to market swings | Moderate beta at 0.89, less volatile and more stable market exposure |
| Debt level | Low debt-to-equity ratio of 0.1 and debt-to-assets 8.09%, indicating low leverage | Higher debt-to-equity ratio of 0.92, moderate leverage and financial risk |
| Regulatory Risk | Moderate, with global operations subject to diverse compliance requirements | Moderate, operating in multiple jurisdictions with data security regulations |
| Operational Risk | Medium, reliant on e-commerce platform stability and merchant adoption | Medium, dependent on continuous software innovation and cloud service uptime |
| Environmental Risk | Low, limited direct environmental impact due to software-based business | Low, primarily software services with minimal environmental footprint |
| Geopolitical Risk | Moderate, exposure to global markets including US, Europe, Asia Pacific | Moderate, headquartered in Australia with international customer base |
In synthesis, Shopify’s highest risk is its market volatility due to a beta of 2.84, which can lead to substantial share price fluctuations. Atlassian faces greater financial risk from its higher leverage and recent unfavorable profitability, as well as operational risks tied to innovation demands. Both companies have manageable regulatory and geopolitical risks but must monitor global compliance and market conditions carefully for sustained growth.
Which Stock to Choose?
Shopify Inc. (SHOP) has shown strong income growth with a 25.78% revenue increase in 2024 and favorable profitability metrics, including a 22.74% net margin and 17.47% ROE. Its debt levels are low, with a debt-to-equity ratio of 0.1 and solid interest coverage, supported by a very favorable B rating and slightly favorable financial ratios overall.
Atlassian Corporation (TEAM) displays favorable revenue growth of 19.66% in 2025 but suffers from negative profitability, with a -4.92% net margin and -19.08% ROE. Its financial ratios are slightly unfavorable, with moderate debt (debt-to-equity of 0.92) and a C rating, reflecting challenges in earnings quality and value creation, alongside a very unfavorable moat status.
Investors prioritizing growth and profitability may find Shopify’s strong income evolution, favorable ratios, and very favorable rating more appealing, while those with tolerance for risk and focus on discounted cash flow might consider Atlassian despite its profitability struggles and unfavorable moat, which suggest value destruction and declining returns.
Disclaimer: Investment carries a risk of loss of initial capital. The past performance is not a reliable indicator of future results. Be sure to understand risks before making an investment decision.
Go Further
I encourage you to read the complete analyses of Shopify Inc. and Atlassian Corporation to enhance your investment decisions: