In the fast-evolving software application industry, Salesforce, Inc. (CRM) and Atlassian Corporation (TEAM) stand out as leaders driving innovation and digital transformation. Both companies serve enterprise clients with powerful collaboration and customer management solutions, competing for market share while expanding their product ecosystems. This article will analyze their strengths, strategies, and risks to help you decide which company deserves a place in your investment portfolio.
Table of contents
Companies Overview
I will begin the comparison between Salesforce, Inc. and Atlassian Corporation by providing an overview of these two companies and their main differences.
Salesforce Overview
Salesforce, Inc. is a US-based leader in customer relationship management (CRM) technology, offering a comprehensive Customer 360 platform that connects companies and customers worldwide. Its services span sales, service, marketing, commerce, analytics, and integration solutions, serving various industries such as financial services and healthcare. Founded in 1999 and headquartered in San Francisco, Salesforce employs over 76K people and is known for platforms like Slack and Tableau.
Atlassian Overview
Atlassian Corporation, headquartered in Sydney, Australia, develops and licenses software products that enhance team collaboration and project management. Its portfolio includes Jira, Confluence, and Trello, targeting technical and business teams to improve work organization and service management. Founded in 2002, Atlassian employs about 12K people and offers tools for developers, security, and enterprise agility, serving a global customer base from its NASDAQ listing.
Key similarities and differences
Both Salesforce and Atlassian operate in the software application industry, focusing on improving business productivity through cloud-based platforms. Salesforce emphasizes customer relationship management and enterprise-wide analytics, while Atlassian specializes in project management, collaboration, and developer tools. Despite their shared technology sector, Salesforce has a significantly larger market cap and workforce, reflecting its broader service offerings and global reach compared to Atlassian’s more specialized product set.
Income Statement Comparison
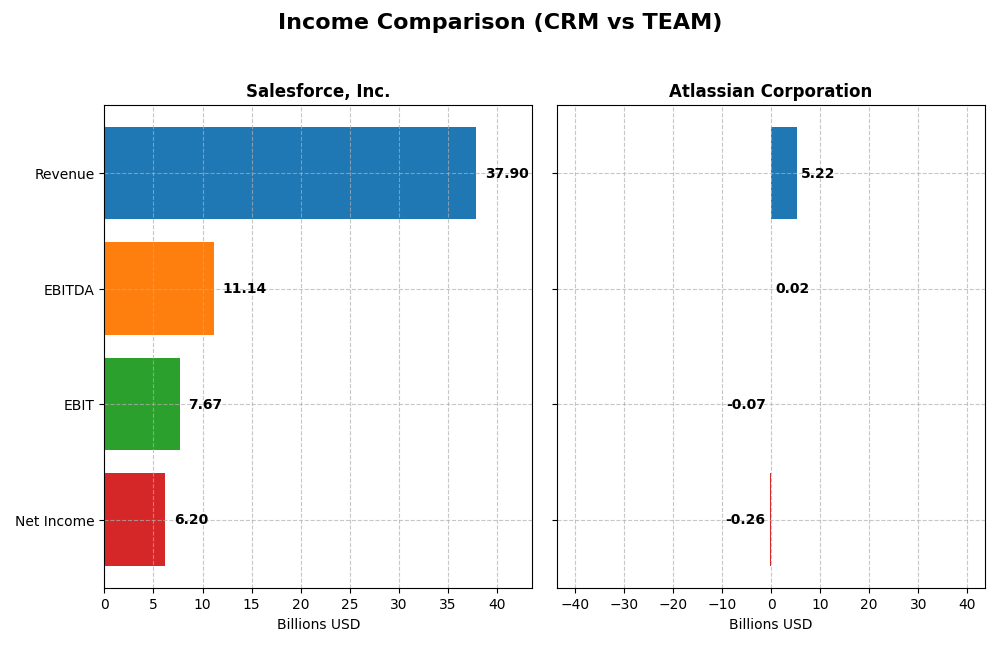
This table compares the key income statement metrics for Salesforce, Inc. and Atlassian Corporation for their most recent fiscal years, highlighting revenue, profitability, and earnings per share.
| Metric | Salesforce, Inc. (CRM) | Atlassian Corporation (TEAM) |
|---|---|---|
| Market Cap | 219B | 31.9B |
| Revenue | 37.9B | 5.22B |
| EBITDA | 11.1B | 24M |
| EBIT | 7.67B | -68M |
| Net Income | 6.2B | -257M |
| EPS | 6.44 | -0.98 |
| Fiscal Year | 2025 | 2025 |
Income Statement Interpretations
Salesforce, Inc.
Salesforce’s revenue and net income have shown strong growth from 2021 to 2025, with an overall revenue increase of 78.31% and net income rising by 52.19%. Margins are generally favorable, though net margin declined slightly over the period. In 2025, revenue growth slowed to 8.72%, but both EBIT and net income margins improved significantly, indicating enhanced profitability.
Atlassian Corporation
Atlassian experienced substantial revenue growth of 149.64% and a 55.67% increase in net income over the 2021-2025 period. Despite a negative EBIT margin in 2025, gross margin remained high at 82.84%. The latest year saw a 19.66% revenue increase but a decline in EBIT by 33.15%, reflecting higher operating expenses relative to revenue growth, though net margin and EPS showed improvement.
Which one has the stronger fundamentals?
Salesforce presents stronger fundamentals with consistently favorable margins, positive EBIT, and robust net income growth, despite a slight net margin decline. Atlassian, while growing faster in revenue and net income, contends with negative EBIT margins and less favorable operating expense control. Both companies are rated favorable overall, but Salesforce’s margin stability and profitability lead the comparison.
Financial Ratios Comparison
The table below compares key financial ratios for Salesforce, Inc. (CRM) and Atlassian Corporation (TEAM) based on the most recent fiscal year data available as of 2025.
| Ratios | Salesforce, Inc. (CRM) | Atlassian Corporation (TEAM) |
|---|---|---|
| ROE | 10.1% | -19.1% |
| ROIC | 7.95% | -4.48% |
| P/E | 53.0 | -207.1 |
| P/B | 5.37 | 39.51 |
| Current Ratio | 1.06 | 1.22 |
| Quick Ratio | 1.06 | 1.22 |
| D/E | 0.19 | 0.92 |
| Debt-to-Assets | 11.1% | 20.5% |
| Interest Coverage | 26.5 | -4.27 |
| Asset Turnover | 0.37 | 0.86 |
| Fixed Asset Turnover | 7.03 | 19.02 |
| Payout Ratio | 24.8% | 0% |
| Dividend Yield | 0.47% | 0% |
Interpretation of the Ratios
Salesforce, Inc.
Salesforce shows a mix of strong and weak ratios, with favorable metrics in net margin (16.35%) and interest coverage (28.18), but unfavorable valuations such as a high PE of 53.04 and PB of 5.37. Liquidity ratios remain stable, with a current ratio of 1.06. The company pays dividends with a low yield of 0.47%, suggesting cautious shareholder returns.
Atlassian Corporation
Atlassian exhibits mostly unfavorable profitability ratios, including a negative net margin (-4.92%) and ROE (-19.08%), despite a favorable WACC of 7.8%. Its liquidity is solid, with a current ratio at 1.22 and no dividend payments, reflecting a focus on reinvestment and growth rather than immediate shareholder returns.
Which one has the best ratios?
Salesforce holds a slightly favorable overall ratio profile with more balanced profitability and liquidity metrics, while Atlassian faces significant challenges in profitability and interest coverage. Salesforce’s dividend payments add a layer of shareholder return, contrasting with Atlassian’s growth-oriented stance and lack of dividends.
Strategic Positioning
This section compares the strategic positioning of Salesforce, Inc. and Atlassian Corporation, including market position, key segments, and exposure to disruption:
Salesforce, Inc.
- Leading global CRM provider with significant competitive pressure in enterprise software market.
- Diverse revenue streams from Sales, Service, Marketing, Commerce Clouds, Integration, and Analytics.
- Faces disruption through cloud platform innovations and integration services like MuleSoft and Slack.
Atlassian Corporation
- Focused on collaboration and project management software with competitive niche in team productivity.
- Concentrated on software products like Jira, Trello, Confluence, and developer tools driving growth.
- Exposure to disruption via continuous delivery, cloud security, and agile enterprise management tools.
Salesforce, Inc. vs Atlassian Corporation Positioning
Salesforce shows a diversified business model across multiple cloud services and industries, providing breadth but facing intense competition. Atlassian maintains a more concentrated focus on collaboration and developer tools, potentially limiting scale but enhancing specialization.
Which has the best competitive advantage?
Both companies are currently shedding value, but Salesforce’s growing ROIC trend suggests improving profitability, while Atlassian’s declining ROIC indicates weakening returns, reflecting a stronger competitive position for Salesforce based on MOAT evaluation.
Stock Comparison
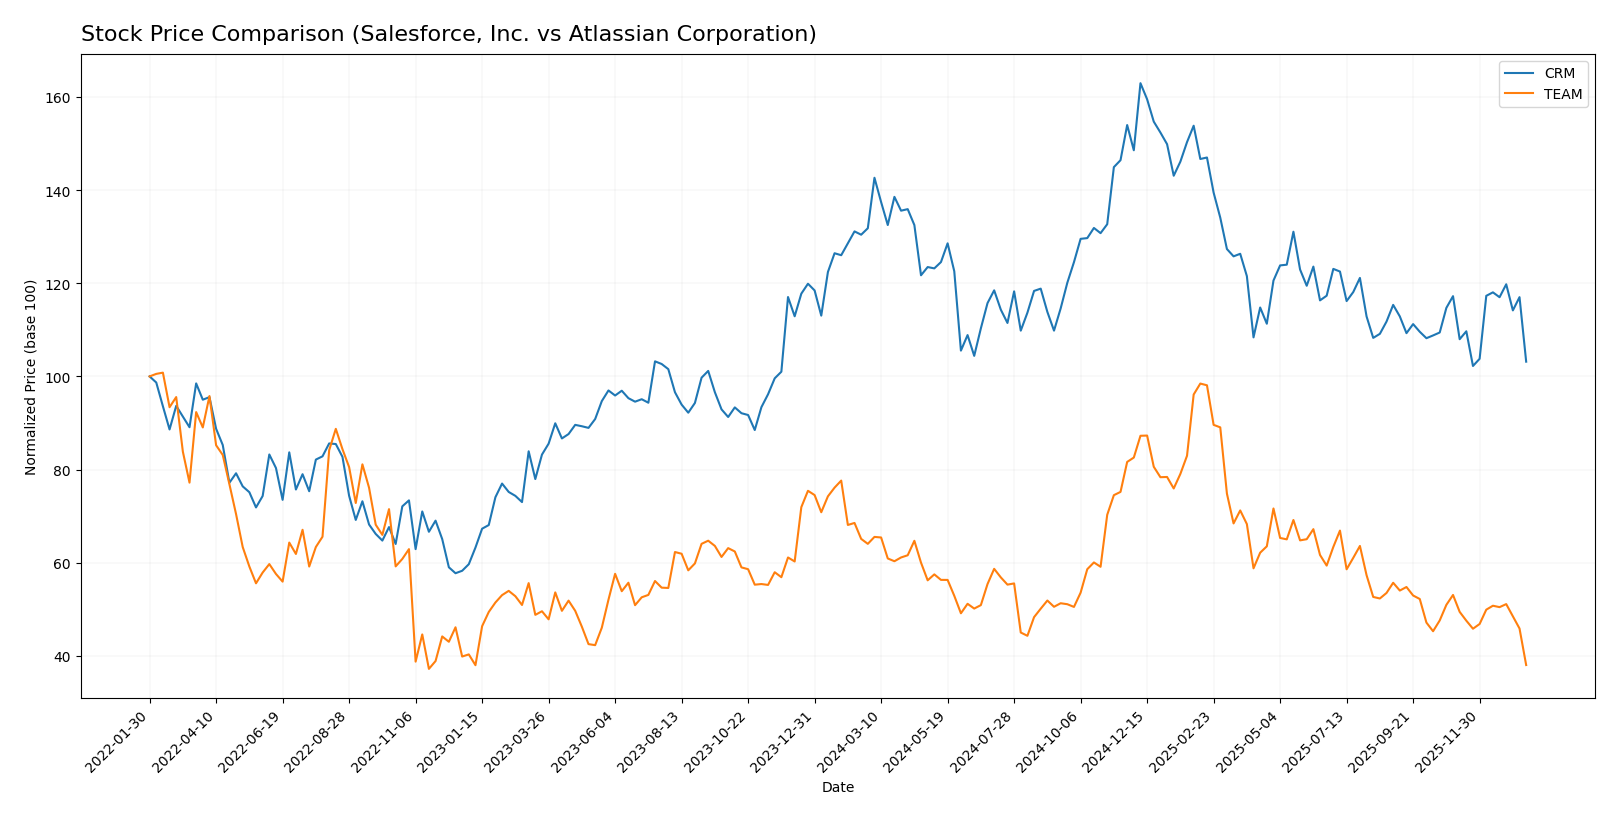
The stock prices of Salesforce, Inc. (CRM) and Atlassian Corporation (TEAM) exhibited notable declines over the past year, with CRM showing accelerated bearish momentum and TEAM experiencing a decelerating downtrend amid volatile trading dynamics.
Trend Analysis
Salesforce, Inc. (CRM) displayed a bearish trend over the past 12 months with a -21.73% price change, showing acceleration in its decline and a standard deviation of 31.79. The stock reached a high of 361.99 and a low of 227.11.
Atlassian Corporation (TEAM) also followed a bearish trend with a -40.62% price change over the same period, though its downtrend decelerated. It had a higher volatility with a 41.16 standard deviation, hitting a peak of 314.28 and a trough of 121.39.
Comparing both, CRM delivered the higher market performance with a smaller decline of -21.73% versus TEAM’s -40.62%, indicating relatively better resilience despite negative trends.
Target Prices
The target price consensus for Salesforce, Inc. and Atlassian Corporation indicates moderate upside potential according to recent analyst estimates.
| Company | Target High | Target Low | Consensus |
|---|---|---|---|
| Salesforce, Inc. | 400 | 250 | 324.17 |
| Atlassian Corporation | 290 | 185 | 234.14 |
Analysts expect Salesforce’s stock to rise significantly from its current price of $228.58, suggesting a favorable outlook. Atlassian’s consensus target of $234.14 also implies potential gains versus its current price near $121.49.
Analyst Opinions Comparison
This section compares analysts’ ratings and financial scores for Salesforce, Inc. and Atlassian Corporation:
Rating Comparison
Salesforce, Inc. Rating
- Rating: B+ reflecting a very favorable overall evaluation.
- Discounted Cash Flow Score: 4, considered favorable.
- ROE Score: 4, representing favorable profitability from equity.
- ROA Score: 4, favorable utilization of assets.
- Debt To Equity Score: 3, moderate financial risk.
- Overall Score: 3, moderate overall financial standing.
Atlassian Corporation Rating
- Rating: C indicating a very favorable overall rating.
- Discounted Cash Flow Score: 5, considered very favorable.
- ROE Score: 1, signaling very unfavorable efficiency.
- ROA Score: 1, very unfavorable asset utilization.
- Debt To Equity Score: 1, very unfavorable financial risk.
- Overall Score: 2, moderate overall financial standing.
Which one is the best rated?
Salesforce, Inc. holds a higher rating of B+ compared to Atlassian’s C, with stronger ROE, ROA, and debt-to-equity scores, despite Atlassian’s superior discounted cash flow score. Overall, Salesforce’s financial metrics suggest a better rating.
Scores Comparison
The comparison of Salesforce and Atlassian scores for financial stability and strength is as follows:
Salesforce Scores
- Altman Z-Score: 5.26, indicating a safe financial zone and low bankruptcy risk.
- Piotroski Score: 7, reflecting strong financial health and good investment potential.
Atlassian Scores
- Altman Z-Score: 4.70, indicating a safe financial zone and low bankruptcy risk.
- Piotroski Score: 5, reflecting average financial health and moderate investment potential.
Which company has the best scores?
Salesforce shows a higher Altman Z-Score and a stronger Piotroski Score compared to Atlassian. Based strictly on these scores, Salesforce demonstrates better financial stability and strength.
Grades Comparison
Here is a comparison of recent reliable grades for Salesforce, Inc. and Atlassian Corporation:
Salesforce, Inc. Grades
The following table summarizes recent grades assigned to Salesforce by reputable grading firms.
| Grading Company | Action | New Grade | Date |
|---|---|---|---|
| Barclays | Maintain | Overweight | 2026-01-12 |
| RBC Capital | Maintain | Sector Perform | 2026-01-05 |
| Morgan Stanley | Maintain | Overweight | 2025-12-09 |
| Citigroup | Maintain | Neutral | 2025-12-08 |
| DA Davidson | Maintain | Neutral | 2025-12-05 |
| Citizens | Maintain | Market Outperform | 2025-12-04 |
| Deutsche Bank | Maintain | Buy | 2025-12-04 |
| Wedbush | Maintain | Outperform | 2025-12-04 |
| Northland Capital Markets | Maintain | Market Perform | 2025-12-04 |
| Canaccord Genuity | Maintain | Buy | 2025-12-04 |
Salesforce’s grades predominantly indicate a positive outlook with multiple “Buy”, “Overweight”, and “Outperform” ratings maintained across late 2025 and early 2026.
Atlassian Corporation Grades
Below is a summary of recent grades assigned to Atlassian by recognized grading agencies.
| Grading Company | Action | New Grade | Date |
|---|---|---|---|
| BTIG | Maintain | Buy | 2026-01-13 |
| Piper Sandler | Maintain | Overweight | 2026-01-05 |
| Bernstein | Maintain | Outperform | 2025-11-18 |
| Macquarie | Maintain | Outperform | 2025-11-03 |
| Mizuho | Maintain | Outperform | 2025-10-31 |
| Bernstein | Maintain | Outperform | 2025-10-31 |
| TD Cowen | Maintain | Hold | 2025-10-27 |
| BMO Capital | Maintain | Outperform | 2025-10-24 |
| UBS | Maintain | Neutral | 2025-10-24 |
| Keybanc | Maintain | Overweight | 2025-10-23 |
Atlassian shows a strong consensus of “Outperform” and “Buy” ratings, with only a few “Hold” and “Neutral” grades, reflecting generally positive analyst sentiment.
Which company has the best grades?
Both Salesforce and Atlassian have received predominantly positive grades, with consensus ratings of “Buy”. Atlassian’s grades lean more consistently towards “Outperform” across multiple firms, while Salesforce’s ratings show a broader mix including “Buy” and “Overweight”. Investors may interpret Atlassian’s stronger outperform signals as a sign of greater near-term growth expectations, whereas Salesforce’s diversified positive ratings suggest steady confidence.
Strengths and Weaknesses
Below is a comparative overview of key strengths and weaknesses for Salesforce, Inc. (CRM) and Atlassian Corporation (TEAM) based on the latest available data.
| Criterion | Salesforce, Inc. (CRM) | Atlassian Corporation (TEAM) |
|---|---|---|
| Diversification | Highly diversified product portfolio across Sales Cloud, Service Cloud, Marketing, and Integration (~$38B in 2025 revenue) | More concentrated, primarily License and Service ($4.9B in 2025) with less diversification |
| Profitability | Positive net margin (16.35%), neutral ROIC (7.95%) but slightly unfavorable valuation ratios (PE 53.04, PB 5.37) | Negative profitability (net margin -4.92%, ROIC -4.48%), unfavorable overall financial health |
| Innovation | Strong innovation reflected in growing ROIC trend (762%) despite current value destruction | Declining ROIC trend (-133%), signaling challenges in innovation and profitability sustainability |
| Global presence | Extensive global footprint supporting large cloud service segments | Growing global presence but smaller scale and less diversified markets |
| Market Share | Leading in CRM and cloud service sectors with sustained revenue growth | Smaller market share with focus on collaboration and productivity tools |
Key takeaways: Salesforce shows broad diversification and improving profitability trends despite some valuation concerns. Atlassian faces profitability and value destruction challenges with a narrower product base. Investors should weigh Salesforce’s steady growth and innovation against Atlassian’s financial risks and declining returns.
Risk Analysis
Below is a comparative table highlighting key risks for Salesforce, Inc. (CRM) and Atlassian Corporation (TEAM) based on 2025 data:
| Metric | Salesforce, Inc. (CRM) | Atlassian Corporation (TEAM) |
|---|---|---|
| Market Risk | Moderate (Beta 1.27, fairly volatile market exposure) | Lower (Beta 0.89, less volatile) |
| Debt level | Low (Debt/Equity 0.19, favorable) | Moderate (Debt/Equity 0.92, neutral) |
| Regulatory Risk | Moderate (US-based tech company facing data/privacy regulations) | Moderate (Global operations with compliance challenges) |
| Operational Risk | Moderate (Large scale operations with integration complexity) | Moderate (Relies on innovation and platform stability) |
| Environmental Risk | Low (Tech sector with limited direct environmental impact) | Low (Similar sector profile) |
| Geopolitical Risk | Moderate (Headquartered in US, exposed to US-China tensions) | Moderate (Australian HQ, global presence with regional risks) |
Salesforce’s risks center on market volatility and regulatory challenges in the US, while Atlassian faces higher debt-related risk and operational dependence on continuous innovation. Salesforce’s strong balance sheet reduces financial risk, making market and regulatory pressures the most impactful concerns for both companies in 2026.
Which Stock to Choose?
Salesforce, Inc. (CRM) shows strong income growth with an 8.72% revenue increase in 2025 and a favorable net margin of 16.35%. Its financial ratios are slightly favorable overall, with good debt management and interest coverage. Profitability is improving despite a slightly unfavorable valuation, and debt remains moderate. The company holds a very favorable B+ rating and demonstrates a growing but still slightly unfavorable economic moat.
Atlassian Corporation (TEAM) has a higher revenue growth of 19.66% in 2025 but suffers from negative profitability, with a net margin of -4.92% and unfavorable returns on equity and assets. Its financial ratios are slightly unfavorable overall, with high valuation multiples and weak interest coverage. Debt levels are manageable, yet the company’s economic moat is very unfavorable due to declining returns. It carries a very favorable C rating but with several weak financial indicators.
For investors prioritizing stable profitability and improving financial health, Salesforce might appear more favorable given its stronger income quality and slightly favorable financial ratios. Conversely, those focused on high growth potential despite current losses could see value in Atlassian, which shows rapid revenue expansion but faces profitability and efficiency challenges. The choice could therefore depend on whether an investor is risk-averse or willing to tolerate volatility for growth.
Disclaimer: Investment carries a risk of loss of initial capital. The past performance is not a reliable indicator of future results. Be sure to understand risks before making an investment decision.
Go Further
I encourage you to read the complete analyses of Salesforce, Inc. and Atlassian Corporation to enhance your investment decisions: