Atlassian Corporation (TEAM) and PTC Inc. (PTC) are two prominent players in the software application industry, each driving innovation in enterprise solutions. Atlassian excels in collaborative work management tools, while PTC focuses on digital transformation and product lifecycle management. Their market overlap and differing innovation strategies make them compelling candidates for comparison. In this article, I will help you decide which company presents the most attractive opportunity for your investment portfolio.
Table of contents
Companies Overview
I will begin the comparison between Atlassian Corporation and PTC Inc. by providing an overview of these two companies and their main differences.
Atlassian Corporation Overview
Atlassian Corporation, headquartered in Sydney, Australia, focuses on designing, developing, licensing, and maintaining software products that enhance team collaboration and project management. Its portfolio includes well-known products like Jira, Confluence, and Trello, which serve both technical and business teams worldwide. Founded in 2002, Atlassian aims to improve work organization and communication through its diverse suite of software solutions.
PTC Inc. Overview
PTC Inc., based in Boston, Massachusetts, provides software and services primarily in the Americas, Europe, and Asia Pacific. Established in 1985, PTC offers platforms such as ThingWorx for digital transformation and Vuforia for augmented reality, alongside product lifecycle management tools like Creo and Windchill. The company emphasizes innovation in product development and lifecycle management to support various industries globally.
Key similarities and differences
Both Atlassian and PTC operate in the software application industry, focusing on enterprise solutions that drive business efficiency and innovation. Atlassian specializes in collaboration and project management software, while PTC concentrates on digital transformation, augmented reality, and product lifecycle management. They differ in geographic headquarters and employee size, with Atlassian employing over 12K staff compared to PTC’s 7.5K, reflecting distinct operational scales within the technology sector.
Income Statement Comparison
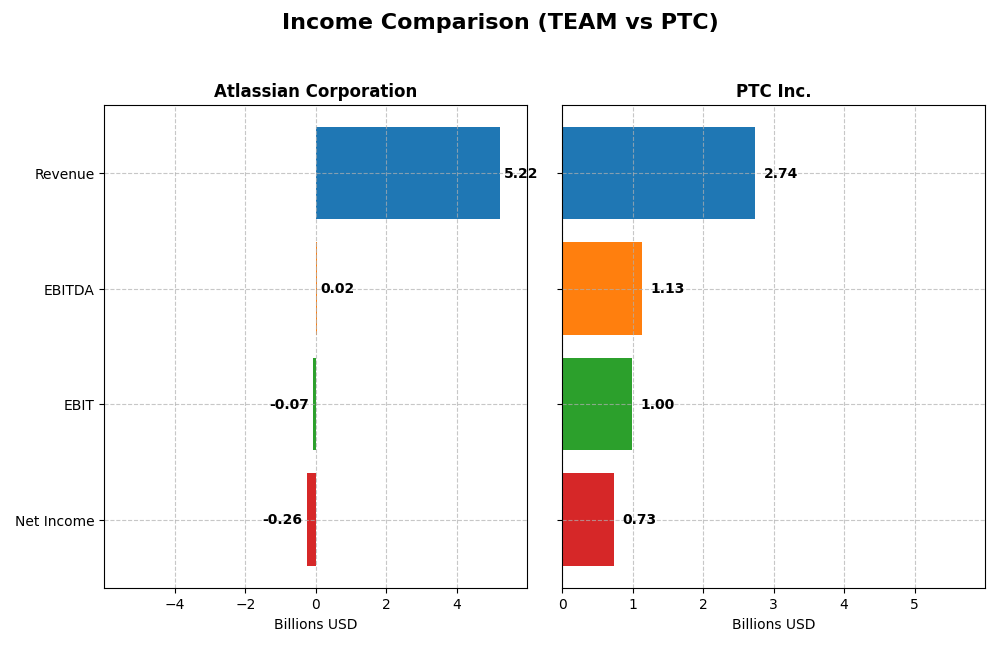
The table below presents a side-by-side comparison of key income statement metrics for Atlassian Corporation and PTC Inc. for their most recent fiscal years.
| Metric | Atlassian Corporation | PTC Inc. |
|---|---|---|
| Market Cap | 31.1B | 19.9B |
| Revenue | 5.22B | 2.74B |
| EBITDA | 24.0M | 1.13B |
| EBIT | -68.3M | 997.2M |
| Net Income | -257M | 734M |
| EPS | -0.98 | 6.18 |
| Fiscal Year | 2025 | 2025 |
Income Statement Interpretations
Atlassian Corporation
Atlassian’s revenue grew substantially from 2.1B in 2021 to 5.2B in 2025, with net income losses narrowing from -579M to -257M in the same period. Gross margins remained strong around 83%, but EBIT and net margins remained negative, albeit improving. The latest year showed a 19.7% revenue increase and a 28.6% net margin improvement, despite EBIT declining by 33.2%.
PTC Inc.
PTC’s revenue rose from 1.8B in 2021 to 2.7B in 2025, with net income increasing significantly from 477M to 734M. Margins were consistently robust, with a gross margin of 83.8% and a net margin of 26.8% in 2025, both favorable. The most recent year showed 19.2% revenue growth, a 69.4% EBIT increase, and a nearly doubling of EPS, indicating strong operational performance.
Which one has the stronger fundamentals?
PTC displays stronger fundamentals with consistently positive EBIT and net margins, alongside significant growth in earnings and stable operating efficiency. Atlassian shows impressive top-line growth but continues to operate at a loss with negative EBIT and net margins, despite margin improvements. Overall, PTC’s income statement reflects a more favorable profitability and growth profile.
Financial Ratios Comparison
The table below compares key financial ratios for Atlassian Corporation (TEAM) and PTC Inc. (PTC) based on their most recent fiscal year data.
| Ratios | Atlassian Corporation (TEAM) FY 2025 | PTC Inc. (PTC) FY 2025 |
|---|---|---|
| ROE | -19.1% | 19.2% |
| ROIC | -4.5% | 14.4% |
| P/E | -207.1 | 33.2 |
| P/B | 39.5 | 6.4 |
| Current Ratio | 1.22 | 1.12 |
| Quick Ratio | 1.22 | 1.12 |
| D/E | 0.92 | 0.36 |
| Debt-to-Assets | 20.5% | 20.7% |
| Interest Coverage | -4.27 | 12.76 |
| Asset Turnover | 0.86 | 0.41 |
| Fixed Asset Turnover | 19.0 | 15.6 |
| Payout Ratio | 0% | 0% |
| Dividend Yield | 0% | 0% |
Interpretation of the Ratios
Atlassian Corporation
Atlassian shows mixed financial health with several unfavorable ratios: negative net margin (-4.92%), ROE (-19.08%), and ROIC (-4.48%) indicate profitability challenges. However, its weighted average cost of capital (WACC) is favorable at 7.85%, and liquidity ratios are stable. The company does not pay dividends, likely prioritizing reinvestment and growth given its negative earnings and cash flow dynamics.
PTC Inc.
PTC demonstrates stronger profitability with favorable net margin (26.8%), ROE (19.18%), and ROIC (14.43%). Liquidity and leverage ratios are generally positive, though its price-to-earnings and price-to-book ratios appear elevated. PTC also does not pay dividends, possibly focusing on expansion and R&D investments, as indicated by its positive earnings but zero dividend yield.
Which one has the best ratios?
Comparing both, PTC presents a more favorable ratio profile with stronger profitability and financial stability, reflected in higher return metrics and interest coverage. Atlassian’s ratios suggest operational and profitability weaknesses despite some liquidity strengths. Overall, PTC’s ratios appear more robust, while Atlassian’s reflect ongoing challenges.
Strategic Positioning
This section compares the strategic positioning of Atlassian Corporation and PTC Inc., including market position, key segments, and exposure to technological disruption:
Atlassian Corporation
- Larger market cap of 31B with moderate competitive pressure in software application sector.
- Focuses on software products connecting teams, including project management, collaboration, and security.
- Exposure to technological disruption through cloud-based collaboration, agile solutions, and developer tools.
PTC Inc.
- Smaller market cap of 20B with steady competitive presence in software and services markets.
- Operates in software products and professional services, emphasizing digital transformation and AR.
- Faces disruption risks from evolving digital transformation platforms and augmented reality tech.
Atlassian Corporation vs PTC Inc. Positioning
Atlassian pursues a diversified software portfolio targeting team collaboration and project management, while PTC concentrates on digital transformation and AR platforms. Atlassian’s broad offerings contrast with PTC’s focused segments, each with distinct market dynamics and innovation drivers.
Which has the best competitive advantage?
PTC exhibits a very favorable moat with growing ROIC and value creation, indicating a durable competitive advantage. Atlassian shows a very unfavorable moat with declining ROIC, reflecting challenges in sustaining profitability and competitive strength.
Stock Comparison
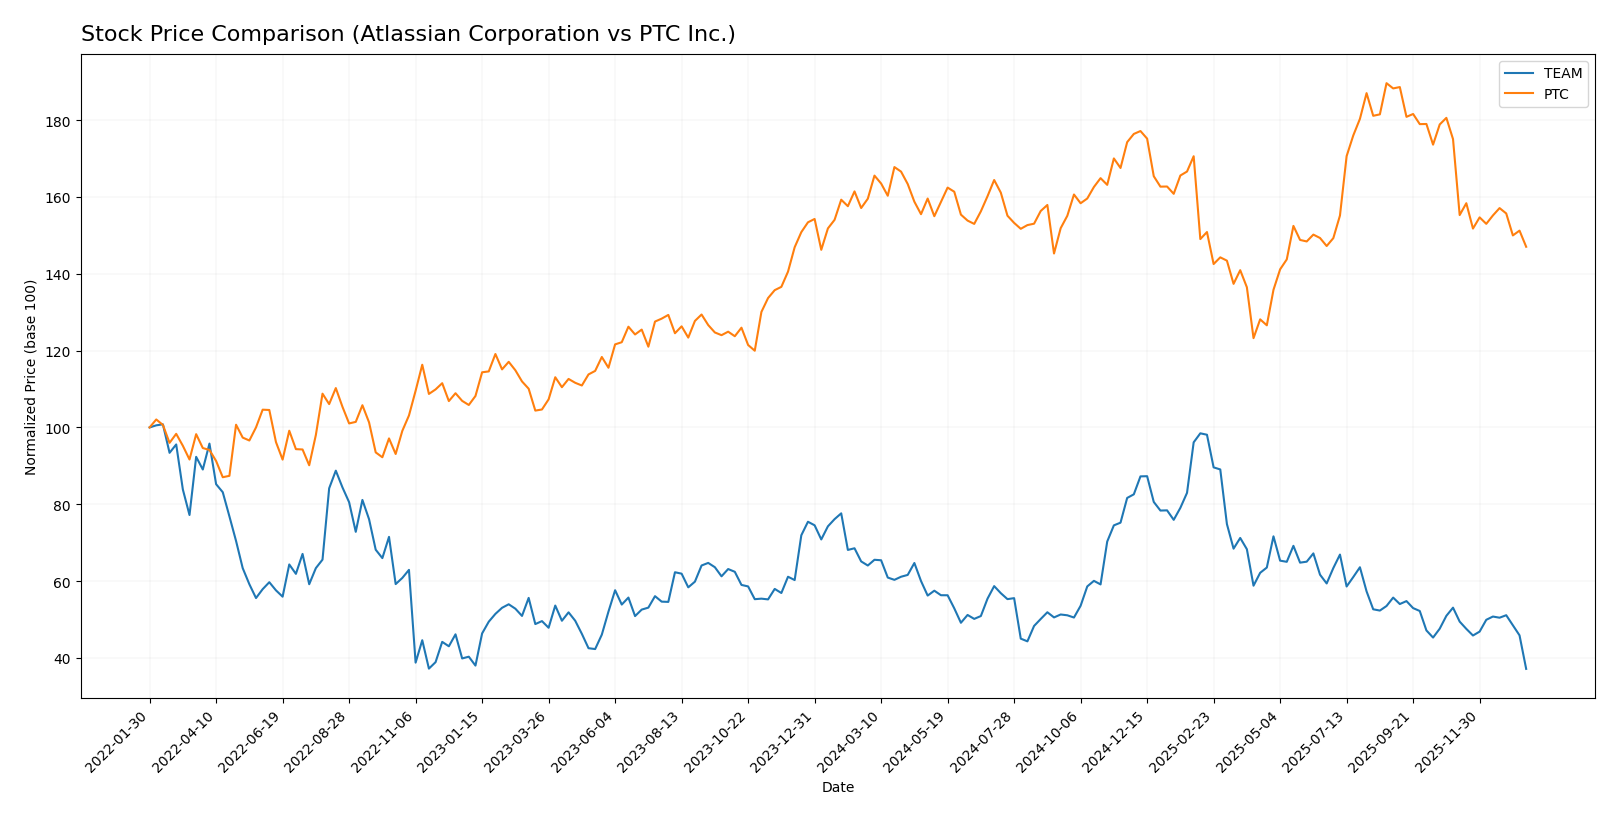
The stock prices of Atlassian Corporation and PTC Inc. have both experienced notable declines over the past year, with distinct trading dynamics and decelerating bearish trends shaping their market behavior.
Trend Analysis
Atlassian Corporation’s stock shows a bearish trend with a -42.01% price change over the past 12 months, coupled with deceleration. The price ranged from a high of 314.28 to a low of 118.55, reflecting significant volatility.
PTC Inc.’s stock also follows a bearish trend with a smaller decline of -7.84% over the same period and decelerating momentum. Its price fluctuated between 215.05 and 139.77, with moderate volatility.
Comparing the two, PTC Inc. delivered higher market performance, with a smaller percentage decline than Atlassian Corporation over the past year.
Target Prices
Analysts present a compelling target price consensus for Atlassian Corporation and PTC Inc., reflecting optimistic outlooks.
| Company | Target High | Target Low | Consensus |
|---|---|---|---|
| Atlassian Corporation | 290 | 185 | 234.14 |
| PTC Inc. | 255 | 120 | 213.25 |
The consensus target prices for both companies significantly exceed their current market prices—$118.55 for Atlassian and $166.75 for PTC—indicating analyst expectations of substantial upside potential in the software application sector.
Analyst Opinions Comparison
This section compares analysts’ ratings and grades for Atlassian Corporation and PTC Inc.:
Rating Comparison
Atlassian Corporation Rating
- Rating: C, considered Very Favorable overall
- Discounted Cash Flow Score: 5, Very Favorable valuation
- ROE Score: 1, Very Unfavorable efficiency at generating profit
- ROA Score: 1, Very Unfavorable asset utilization
- Debt To Equity Score: 1, Very Unfavorable financial risk
- Overall Score: 2, Moderate financial standing
PTC Inc. Rating
- Rating: B+, considered Very Favorable overall
- Discounted Cash Flow Score: 4, Favorable valuation
- ROE Score: 4, Favorable efficiency at generating profit
- ROA Score: 5, Very Favorable asset utilization
- Debt To Equity Score: 2, Moderate financial risk
- Overall Score: 3, Moderate financial standing
Which one is the best rated?
PTC Inc. is better rated than Atlassian, with a higher overall score (3 vs. 2) and stronger scores in ROE, ROA, and debt-to-equity, indicating more efficient profitability and lower financial risk.
Scores Comparison
The comparison of the Altman Z-Score and Piotroski Score for both companies is as follows:
Atlassian Scores
- Altman Z-Score: 4.70, indicating safe zone status.
- Piotroski Score: 5, reflecting average financial strength.
PTC Scores
- Altman Z-Score: 5.67, indicating safe zone status.
- Piotroski Score: 8, reflecting very strong financial strength.
Which company has the best scores?
PTC has higher scores with an Altman Z-Score of 5.67 and a Piotroski Score of 8, compared to Atlassian’s 4.70 and 5. PTC shows stronger financial health based on these metrics.
Grades Comparison
The following presents a detailed comparison of the available grades for Atlassian Corporation and PTC Inc.:
Atlassian Corporation Grades
This table summarizes recent grades assigned to Atlassian Corporation by recognized grading firms.
| Grading Company | Action | New Grade | Date |
|---|---|---|---|
| BTIG | Maintain | Buy | 2026-01-13 |
| Piper Sandler | Maintain | Overweight | 2026-01-05 |
| Bernstein | Maintain | Outperform | 2025-11-18 |
| Macquarie | Maintain | Outperform | 2025-11-03 |
| Mizuho | Maintain | Outperform | 2025-10-31 |
| Bernstein | Maintain | Outperform | 2025-10-31 |
| TD Cowen | Maintain | Hold | 2025-10-27 |
| BMO Capital | Maintain | Outperform | 2025-10-24 |
| UBS | Maintain | Neutral | 2025-10-24 |
| Keybanc | Maintain | Overweight | 2025-10-23 |
Atlassian Corporation’s grades predominantly cluster around positive ratings such as Buy, Overweight, and Outperform, with few Neutral or Hold evaluations.
PTC Inc. Grades
This table details recent grades assigned to PTC Inc. by credible grading companies.
| Grading Company | Action | New Grade | Date |
|---|---|---|---|
| Piper Sandler | Maintain | Neutral | 2025-11-07 |
| Rosenblatt | Maintain | Buy | 2025-11-06 |
| Rosenblatt | Maintain | Buy | 2025-10-30 |
| Oppenheimer | Maintain | Outperform | 2025-07-31 |
| Rosenblatt | Maintain | Buy | 2025-07-31 |
| Barclays | Maintain | Overweight | 2025-07-31 |
| Stifel | Maintain | Buy | 2025-07-31 |
| Keybanc | Maintain | Overweight | 2025-07-31 |
| RBC Capital | Maintain | Outperform | 2025-07-31 |
| Piper Sandler | Maintain | Neutral | 2025-07-31 |
PTC Inc.’s grades show a mix of Buy, Overweight, and Outperform ratings, but also include some Neutral and a few Sell opinions, reflecting some divergence in analyst sentiment.
Which company has the best grades?
Atlassian Corporation has received more consistently positive grades with no Sell ratings, whereas PTC Inc. has a few Sell grades amid its Buy and Outperform ratings. This suggests Atlassian’s analyst consensus is somewhat stronger, potentially implying a more favorable market perception for investors seeking less controversial stock opinions.
Strengths and Weaknesses
Below is a comparative overview of key strengths and weaknesses for Atlassian Corporation (TEAM) and PTC Inc. based on recent financial and operational data.
| Criterion | Atlassian Corporation (TEAM) | PTC Inc. |
|---|---|---|
| Diversification | Moderate; mainly license and service revenue, limited product range growth | Balanced segmentation across license, technology services, and cloud support |
| Profitability | Negative net margin (-4.92%) and ROIC (-4.48%), value destroying | Strong profitability with net margin 26.8% and ROIC 14.43%, value creating |
| Innovation | Declining ROIC trend (-132.5%), indicating challenges in efficiency | Growing ROIC trend (42.4%), reflecting effective innovation and capital use |
| Global presence | Significant but less efficient use of capital globally | Durable competitive advantage with increasing profitability worldwide |
| Market Share | High valuation multiples, but inefficient asset use | Healthy financial ratios and sustainable market position |
Key takeaways: PTC Inc. demonstrates superior profitability, innovation, and value creation, supported by a diverse revenue mix and efficient capital use. Atlassian, while a notable player, is currently facing declining profitability and value destruction, suggesting caution for investors.
Risk Analysis
The table below summarizes key risks for Atlassian Corporation (TEAM) and PTC Inc. (PTC) based on recent 2025 data and market context:
| Metric | Atlassian Corporation (TEAM) | PTC Inc. (PTC) |
|---|---|---|
| Market Risk | Moderate (Beta 0.89, price down ~7.7% recently) | Moderate (Beta 1.01, price stable) |
| Debt level | Moderate debt/equity (0.92), favorable debt to assets (20.5%) | Low debt/equity (0.36), favorable debt to assets (20.7%) |
| Regulatory Risk | Medium (Tech sector, global data security focus) | Medium (Tech sector with international operations) |
| Operational Risk | Unfavorable margins and ROE, negative interest coverage (-2.24) | Favorable margins and ROE, strong interest coverage (12.95) |
| Environmental Risk | Low to moderate (Software industry, limited direct impact) | Low to moderate (Software industry) |
| Geopolitical Risk | Medium (Australian HQ, global cloud services) | Medium (US HQ, global market presence) |
Atlassian faces notable operational risks with negative profitability and interest coverage, increasing financial vulnerability despite moderate debt levels. PTC shows stronger financial health and operational stability. Market risk remains moderate for both due to tech sector volatility. Geopolitical and regulatory risks persist given global operations but are manageable. Investors should weigh Atlassian’s financial weaknesses carefully against PTC’s robust profile.
Which Stock to Choose?
Atlassian Corporation (TEAM) shows a favorable income statement with strong revenue growth (150% over five years) but suffers from negative profitability and declining returns on invested capital. Its financial ratios are mixed, with a slightly unfavorable overall rating and significant challenges in ROE and interest coverage, indicating financial stress despite a solid current ratio and manageable debt. The company’s economic moat is very unfavorable, signaling value destruction and decreasing profitability.
PTC Inc. (PTC) presents a consistently favorable income statement with solid profitability and positive growth metrics. Its financial ratios are mostly favorable, supported by strong returns on assets and equity, though valuation multiples appear less attractive. The company holds a very favorable economic moat with increasing ROIC above its WACC, reflecting efficient capital use and a durable competitive advantage. Ratings are positive overall, with strong financial health scores.
Considering the ratings and comprehensive financial evaluation, TEAM may appear more volatile with value challenges, while PTC could be seen as a more stable value creator. Investors prioritizing growth might find TEAM’s revenue momentum appealing, whereas those valuing profitability and capital efficiency might lean towards PTC’s stronger economic moat and favorable ratios.
Disclaimer: Investment carries a risk of loss of initial capital. The past performance is not a reliable indicator of future results. Be sure to understand risks before making an investment decision.
Go Further
I encourage you to read the complete analyses of Atlassian Corporation and PTC Inc. to enhance your investment decisions: