Atlassian Corporation and Perfect Corp. are two innovative players in the software application industry, each excelling in distinct yet overlapping market niches. Atlassian focuses on collaborative project management and developer tools, while Perfect Corp. harnesses AI and augmented reality to revolutionize beauty and fashion tech. This article will explore their growth strategies, market positions, and innovation approaches to help you decide which company presents the most compelling investment opportunity in 2026.

Table of contents
Companies Overview
I will begin the comparison between Atlassian Corporation and Perfect Corp. by providing an overview of these two companies and their main differences.
Atlassian Corporation Overview
Atlassian Corporation, headquartered in Sydney, Australia, is a technology company specializing in software applications. Founded in 2002, it offers a broad portfolio of collaboration and project management tools such as Jira, Confluence, and Trello. The company focuses on connecting technical and business teams to improve workflow and productivity, serving enterprise and professional customers worldwide.
Perfect Corp. Overview
Perfect Corp., based in New Taipei City, Taiwan, operates in the technology sector, offering SaaS solutions focused on artificial intelligence and augmented reality for the beauty and fashion industries. Established in 2015, its product suite includes virtual try-on tools and AI-powered analysis for cosmetics, hair color, and accessories. The company targets consumer engagement and retail innovation through advanced AR and AI technologies.
Key similarities and differences
Both Atlassian and Perfect Corp. operate in the software application industry with a focus on SaaS products, yet their markets differ significantly. Atlassian emphasizes enterprise collaboration and project management software, while Perfect Corp. specializes in AI-driven AR solutions for beauty and fashion retail. Atlassian has a substantially larger workforce and market cap, reflecting its broader global reach and diversified software portfolio compared to Perfect Corp.’s niche consumer technology offerings.
Income Statement Comparison
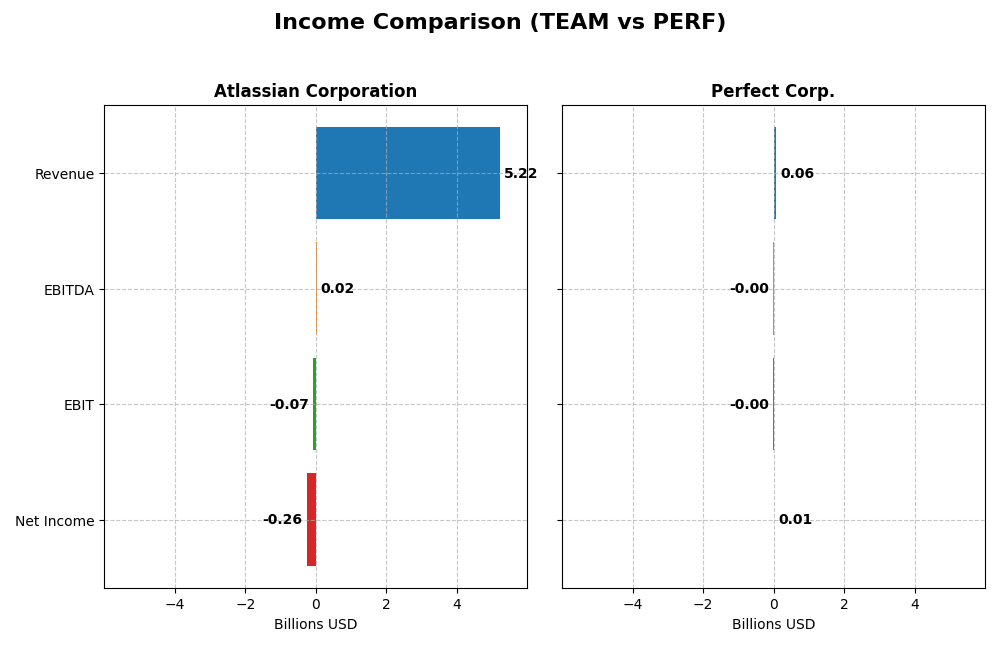
This table presents a side-by-side comparison of the most recent fiscal year income statement metrics for Atlassian Corporation and Perfect Corp., facilitating an overview of their financial performance.
| Metric | Atlassian Corporation (TEAM) | Perfect Corp. (PERF) |
|---|---|---|
| Market Cap | 31.1B | 179M |
| Revenue | 5.22B | 60.2M |
| EBITDA | 24.0M | -2.05M |
| EBIT | -68.3M | -2.84M |
| Net Income | -257M | 5.02M |
| EPS | -0.98 | 0.05 |
| Fiscal Year | 2025 | 2024 |
Income Statement Interpretations
Atlassian Corporation
Atlassian’s revenue grew significantly from $2.1B in 2021 to $5.2B in 2025, with net income losses narrowing from -$579M to -$257M, reflecting improving profitability. Gross margins remained strong around 83%, while EBIT margins stayed negative. The 2025 year showed 19.7% revenue growth with improved net margin and EPS, despite operating expenses rising in line with revenue.
Perfect Corp.
Perfect Corp. demonstrated steady revenue growth from $30M in 2020 to $60M in 2024, with net income turning positive in recent years, reaching $5M in 2024. Gross margin held favorably near 78%, though EBIT margins remained negative. The latest year saw a 12.5% revenue increase but a decline in net margin and EBIT growth, indicating pressure on profitability despite EPS growth.
Which one has the stronger fundamentals?
Both companies exhibit favorable income statement trends, with Atlassian showing robust revenue expansion and improving net margins, offset by persistent operating losses. Perfect Corp. has achieved positive net income and stable gross margins but faces weakening EBIT and net margin growth recently. Atlassian’s scale and growth contrast with Perfect Corp.’s profitability gains, making fundamentals strong but differing by focus.
Financial Ratios Comparison
Below is a comparison of key financial ratios for Atlassian Corporation (TEAM) and Perfect Corp. (PERF) based on the most recent fiscal year data available.
| Ratios | Atlassian Corporation (TEAM) 2025 | Perfect Corp. (PERF) 2024 |
|---|---|---|
| ROE | -19.1% | 3.42% |
| ROIC | -4.48% | -2.10% |
| P/E | -207.1 | 56.6 |
| P/B | 39.5 | 1.93 |
| Current Ratio | 1.22 | 5.52 |
| Quick Ratio | 1.22 | 5.52 |
| D/E (Debt-to-Equity) | 0.92 | 0.0035 |
| Debt-to-Assets | 20.5% | 0.28% |
| Interest Coverage | -4.27 | -449 |
| Asset Turnover | 0.86 | 0.33 |
| Fixed Asset Turnover | 19.0 | 57.9 |
| Payout ratio | 0 | 0 |
| Dividend yield | 0 | 0 |
Interpretation of the Ratios
Atlassian Corporation
Atlassian shows a mixed financial profile with several unfavorable ratios such as a negative net margin of -4.92% and a return on equity of -19.08%. The company’s price-to-book ratio is quite high at 39.51, signaling potential overvaluation, though its weighted average cost of capital at 7.85% is favorable. Atlassian does not pay dividends, likely focusing on reinvestment and growth given its negative earnings and significant R&D expenses.
Perfect Corp.
Perfect Corp. displays a neutral net margin of 8.34%, but weaker returns on equity and invested capital, reflecting some operational challenges. The firm’s price-to-earnings ratio of 56.6 is elevated, while its debt levels remain minimal, with a debt-to-assets ratio of just 0.28%. Like Atlassian, Perfect Corp. does not pay dividends, possibly prioritizing reinvestment in technology and growth initiatives.
Which one has the best ratios?
Both companies exhibit slightly unfavorable overall ratio evaluations with 35.71% favorable and 42.86% to 50% unfavorable ratios. Atlassian’s stronger asset turnover and manageable debt contrast with Perfect Corp.’s better liquidity but weaker asset efficiency. Neither company currently provides dividends, emphasizing growth over shareholder payouts.
Strategic Positioning
This section compares the strategic positioning of Atlassian Corporation and Perfect Corp. in terms of market position, key segments, and exposure to technological disruption:
Atlassian Corporation
- Large market cap of 31B USD with strong NASDAQ presence, facing software application competition
- Focused on software collaboration tools like Jira, Trello, and Confluence, driving revenue via licenses and services
- Moderate exposure to tech disruption through constant product innovation in cloud and collaboration software
Perfect Corp.
- Small market cap of 179M USD, listed on NYSE, with lower competitive pressure
- Specializes in AI and AR beauty and fashion SaaS solutions, including virtual try-ons and AI analysis
- High exposure to AI and AR innovation in beauty tech, leveraging augmented reality and AI capabilities
Atlassian Corporation vs Perfect Corp. Positioning
Atlassian operates with a diversified product portfolio targeting broad business collaboration, while Perfect Corp. concentrates on AI-driven beauty and fashion tech solutions. Atlassian benefits from scale and breadth, whereas Perfect Corp. focuses on niche innovation with a smaller footprint.
Which has the best competitive advantage?
Both companies are currently shedding value relative to their cost of capital. Atlassian’s declining profitability indicates a very unfavorable moat, while Perfect Corp. shows improving profitability despite a slightly unfavorable moat, suggesting a cautiously more sustainable competitive advantage.
Stock Comparison
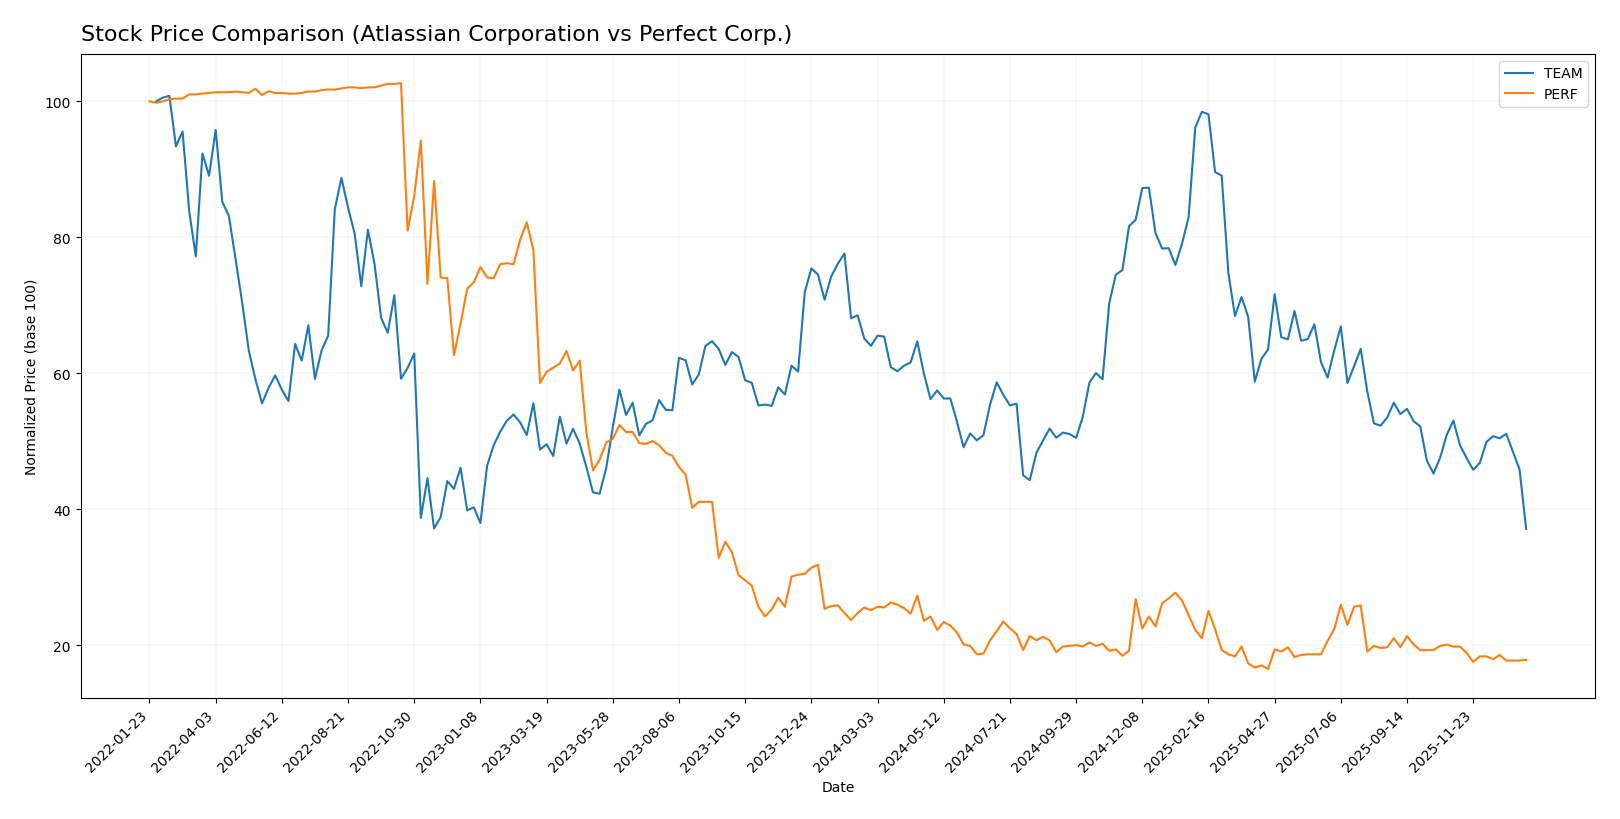
The stock price movements of Atlassian Corporation (TEAM) and Perfect Corp. (PERF) over the past year reveal significant bearish trends marked by decelerating declines and varying volatility levels.
Trend Analysis
Atlassian Corporation’s stock shows a bearish trend with a -42.01% price change over the past 12 months, accompanied by high volatility (std deviation 41.22) and decelerating downward momentum. Recent months reflect continued decline but at a slower pace (-30.03%).
Perfect Corp. also exhibits a bearish trend with a -28.98% price change over the same period, low volatility (std deviation 0.27), and decelerating loss. Its recent trend shows a smaller decline (-9.84%) with minimal slope, indicating near stabilization.
Comparing both, Atlassian’s stock has experienced a steeper decline and higher volatility, while Perfect Corp.’s loss is less severe. Perfect Corp. delivered the higher relative market performance over the past year.
Target Prices
The current analyst consensus reflects a positive outlook for Atlassian Corporation and Perfect Corp.
| Company | Target High | Target Low | Consensus |
|---|---|---|---|
| Atlassian Corporation | 290 | 185 | 234.14 |
| Perfect Corp. | 7 | 7 | 7 |
Analysts expect Atlassian’s stock to trade significantly above its current price of $118.55, indicating strong upside potential. Perfect Corp.’s consensus target at $7 also suggests substantial growth compared to its current $1.74 price.
Analyst Opinions Comparison
This section compares analysts’ ratings and grades for Atlassian Corporation and Perfect Corp.:
Rating Comparison
Atlassian Corporation Rating
- Rating: C, indicating a very favorable status.
- Discounted Cash Flow Score: 5, very favorable.
- ROE Score: 1, very unfavorable, showing low efficiency in using shareholders’ equity.
- ROA Score: 1, very unfavorable, indicating poor asset utilization.
- Debt To Equity Score: 1, very unfavorable, implying high financial risk.
- Overall Score: 2, moderate overall financial standing.
Perfect Corp. Rating
- Rating: A-, also very favorable overall.
- Discounted Cash Flow Score: 5, very favorable.
- ROE Score: 2, moderate, reflecting some efficiency in equity use.
- ROA Score: 3, moderate, indicating better asset use.
- Debt To Equity Score: 4, favorable, showing stronger balance sheet.
- Overall Score: 4, favorable overall financial standing.
Which one is the best rated?
Perfect Corp. holds a stronger position with an A- rating and higher overall score of 4 compared to Atlassian’s C rating and score of 2. Perfect Corp. also outperforms on ROE, ROA, and debt to equity, indicating better financial health.
Scores Comparison
The comparison of Atlassian Corporation and Perfect Corp. scores is as follows:
Atlassian Corporation Scores
- Altman Z-Score: 4.70, indicating a safe zone with low bankruptcy risk.
- Piotroski Score: 5, reflecting average financial strength.
Perfect Corp. Scores
- Altman Z-Score: 1.31, indicating distress zone with high bankruptcy risk.
- Piotroski Score: 6, reflecting average financial strength.
Which company has the best scores?
Atlassian shows a significantly stronger Altman Z-Score, placing it in the safe zone, while Perfect Corp. is in distress. Both have average Piotroski Scores, with Perfect Corp. slightly higher. Overall, Atlassian’s scores suggest better financial stability.
Grades Comparison
The grades comparison for Atlassian Corporation and Perfect Corp. based on recent analyst evaluations is as follows:
Atlassian Corporation Grades
This table summarizes recent grades and actions from reputable grading companies for Atlassian Corporation:
| Grading Company | Action | New Grade | Date |
|---|---|---|---|
| BTIG | Maintain | Buy | 2026-01-13 |
| Piper Sandler | Maintain | Overweight | 2026-01-05 |
| Bernstein | Maintain | Outperform | 2025-11-18 |
| Macquarie | Maintain | Outperform | 2025-11-03 |
| Mizuho | Maintain | Outperform | 2025-10-31 |
| Bernstein | Maintain | Outperform | 2025-10-31 |
| TD Cowen | Maintain | Hold | 2025-10-27 |
| BMO Capital | Maintain | Outperform | 2025-10-24 |
| UBS | Maintain | Neutral | 2025-10-24 |
| Keybanc | Maintain | Overweight | 2025-10-23 |
Overall, Atlassian Corporation’s grades show a strong positive trend, with multiple “Outperform” and “Buy” ratings and no downgrades.
Perfect Corp. Grades
This table summarizes recent grades and actions from reputable grading companies for Perfect Corp.:
| Grading Company | Action | New Grade | Date |
|---|---|---|---|
| Piper Sandler | Maintain | Neutral | 2024-02-29 |
| Goldman Sachs | Maintain | Neutral | 2023-10-26 |
| Piper Sandler | Maintain | Neutral | 2023-10-25 |
| Piper Sandler | Maintain | Neutral | 2023-07-26 |
| Piper Sandler | Maintain | Neutral | 2023-07-25 |
| Piper Sandler | Maintain | Neutral | 2023-04-27 |
| Oppenheimer | Downgrade | Perform | 2023-04-20 |
| Oppenheimer | Downgrade | Perform | 2023-04-19 |
| Oppenheimer | Downgrade | Perform | 2023-04-18 |
| Piper Sandler | Maintain | Neutral | 2023-03-08 |
Perfect Corp.’s grades predominantly remain at “Neutral” or have been downgraded to “Perform,” indicating a cautious stance from analysts.
Which company has the best grades?
Atlassian Corporation consistently receives higher grades such as “Buy” and “Outperform,” while Perfect Corp. mostly holds “Neutral” and downgraded “Perform” ratings. This suggests Atlassian’s perceived stronger growth or stability could impact investor confidence more positively.
Strengths and Weaknesses
Below is a comparative overview of key strengths and weaknesses for Atlassian Corporation (TEAM) and Perfect Corp. (PERF) based on the most recent financial and market data.
| Criterion | Atlassian Corporation (TEAM) | Perfect Corp. (PERF) |
|---|---|---|
| Diversification | Moderate: Primarily software with License and Service focus; limited product diversification | Limited: Mainly focused on beauty tech solutions; less diversified product range |
| Profitability | Weak: Negative net margin (-4.92%), negative ROE (-19.08%), declining ROIC; value destroying | Moderate: Positive net margin (8.34%) but negative ROE (3.42%) and ROIC; slightly unfavorable value creation |
| Innovation | Strong: High fixed asset turnover (19.02) suggests efficient use of assets for innovation | Strong: Very high fixed asset turnover (57.94) indicating efficient asset use for product development |
| Global presence | Solid: Large market with significant License and Service revenue (~4.93B USD in 2025) | Moderate: Niche market presence, smaller scale but growing |
| Market Share | Significant in collaboration software, but facing challenges due to declining profitability | Growing in beauty tech, with improving ROIC trend but still value destructive |
Key takeaways: Atlassian shows strong innovation and global reach but currently faces profitability and value destruction issues. Perfect Corp. exhibits efficient innovation and improving profitability trends but remains a slightly unfavorable investment due to negative returns on capital. Both require cautious consideration with a focus on risk management.
Risk Analysis
Below is a comparative table summarizing key risk metrics for Atlassian Corporation (TEAM) and Perfect Corp. (PERF) based on the most recent data available:
| Metric | Atlassian Corporation (TEAM) | Perfect Corp. (PERF) |
|---|---|---|
| Market Risk | Beta 0.888 (moderate volatility) | Beta 0.454 (low volatility) |
| Debt level | Debt-to-Equity 0.92 (neutral) | Debt-to-Equity 0.0 (favorable, no debt) |
| Regulatory Risk | Moderate (Tech sector, global operations) | Moderate (Tech, AR/AI focus, Taiwan-based) |
| Operational Risk | High (negative net margin, ROE, and interest coverage) | Moderate (positive net margin, but negative ROIC) |
| Environmental Risk | Low (software industry, limited direct impact) | Low (software/AR, limited direct impact) |
| Geopolitical Risk | Moderate (headquartered in Australia, global market exposure) | Elevated (based in Taiwan, sensitive to regional tensions) |
Synthesis: Atlassian faces operational risks with negative profitability and weak interest coverage, while having manageable debt. Perfect Corp. shows financial distress signals with a low Altman Z-score indicating higher bankruptcy risk, despite no debt and positive net margin. Geopolitical risks are more relevant for Perfect Corp. due to its Taiwan base. Traders should weigh operational weaknesses and geopolitical exposure carefully.
Which Stock to Choose?
Atlassian Corporation (TEAM) shows favorable income growth with a 19.66% revenue increase in 2025 and a strong gross margin of 82.84%, yet it struggles with negative profitability and declining returns on equity (-19.08%) and invested capital. Its debt levels are moderate with a debt-to-assets ratio of 20.51%, but financial ratios overall appear slightly unfavorable, and the company’s rating is moderate despite a very favorable discounted cash flow score. The economic moat is very unfavorable, indicating value destruction and declining profitability.
Perfect Corp. (PERF) exhibits favorable income growth, including a 12.52% revenue increase in 2024 and a solid gross margin near 78%. Profitability metrics are mixed, with positive net margin (8.34%) but moderate return on equity (3.42%) and slightly negative return on invested capital. Its debt ratios are very low, with a debt-to-assets ratio of 0.28%, and financial ratios are slightly unfavorable overall. The rating is favorable with strong discounted cash flow and better leverage scores. The moat status is slightly unfavorable but with improving profitability.
Investors focused on growth might see Atlassian’s strong revenue growth and cash flow as appealing despite weak profitability and value destruction signals. Conversely, investors prioritizing financial stability and improving profitability could find Perfect Corp.’s low debt and favorable rating more attractive, though both companies show slightly unfavorable financial ratios and bearish recent stock trends.
Disclaimer: Investment carries a risk of loss of initial capital. The past performance is not a reliable indicator of future results. Be sure to understand risks before making an investment decision.
Go Further
I encourage you to read the complete analyses of Atlassian Corporation and Perfect Corp. to enhance your investment decisions: