Atlassian Corporation (TEAM) and Pegasystems Inc. (PEGA) are prominent players in the software application industry, each offering innovative enterprise solutions that streamline business operations. Atlassian excels in project management and developer tools, while Pegasystems focuses on customer engagement and intelligent automation. Given their overlapping markets and distinct innovation strategies, this comparison aims to help investors identify which company offers the most compelling investment opportunity in 2026. Let’s explore their strengths and growth potential together.
Table of contents
Companies Overview
I will begin the comparison between Atlassian Corporation and Pegasystems Inc. by providing an overview of these two companies and their main differences.
Atlassian Corporation Overview
Atlassian Corporation, headquartered in Sydney, Australia, develops and licenses software products aimed at improving collaboration and project management for technical and business teams. Its portfolio includes Jira, Confluence, and Trello, which facilitate work organization and agile business management. The company focuses on enterprise solutions that enhance developer productivity and service management, serving a global market with a workforce of over 12K employees.
Pegasystems Inc. Overview
Pegasystems Inc., based in Waltham, Massachusetts, offers enterprise software for customer engagement and digital process automation. It markets platforms like Pega Infinity and Pega Platform, targeting industries such as financial services and healthcare. With about 5.4K employees, Pegasystems provides cloud-based and on-premise solutions aimed at automating sales, customer service, and operational workflows across multiple regions worldwide.
Key similarities and differences
Both Atlassian and Pegasystems operate in the software application industry, focusing on enhancing business processes through technology. Atlassian emphasizes collaboration tools and agile project management, while Pegasystems specializes in customer engagement and automation platforms. Atlassian has a larger market cap and employee base, reflecting its broader product suite and global reach, whereas Pegasystems concentrates on specific industry verticals with a slightly higher beta, indicating marginally greater stock volatility.
Income Statement Comparison
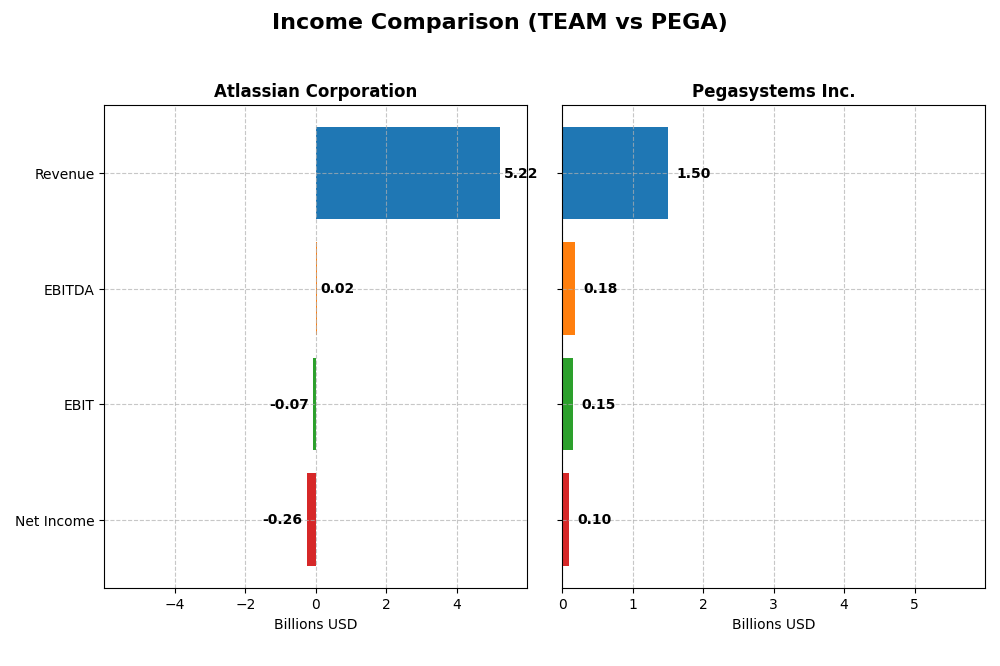
The table below compares key income statement metrics for Atlassian Corporation and Pegasystems Inc. for the most recent fiscal year available.
| Metric | Atlassian Corporation | Pegasystems Inc. |
|---|---|---|
| Market Cap | 31.1B | 8.9B |
| Revenue | 5.22B | 1.50B |
| EBITDA | 24.0M | 185M |
| EBIT | -68.3M | 149M |
| Net Income | -257M | 99.2M |
| EPS | -0.98 | 0.58 |
| Fiscal Year | 2025 | 2024 |
Income Statement Interpretations
Atlassian Corporation
Atlassian’s revenue showed strong growth from 2.09B in 2021 to 5.22B in 2025, with net income losses narrowing from -579M to -257M. Gross margins remained high and favorable at 82.84%, while EBIT and net margins were negative but improving. The latest year saw revenue growth accelerate by 19.66%, with net margin and EPS showing positive signs despite ongoing operating losses.
Pegasystems Inc.
Pegasystems experienced steady revenue growth from 1.02B in 2020 to nearly 1.50B in 2024, with net income rebounding from losses to a positive 99M in 2024. Gross margin held favorably at 73.91%, EBIT margin was neutral at 9.98%, and net margin was positive at 6.63%. Recent performance showed moderate revenue growth of 4.51% with significant gains in EBIT (+46.09%) and net margin (+39.97%).
Which one has the stronger fundamentals?
Pegasystems demonstrates stronger fundamentals with consistent profitability, positive EBIT and net margins, and impressive net income growth of 262% over the period. Atlassian, while growing revenue rapidly and improving margins, remains unprofitable with negative EBIT and net margins. Both show favorable gross margins, but Pegasystems’ earnings stability and margin expansion indicate more favorable income statement health.
Financial Ratios Comparison
The table below compares key financial ratios of Atlassian Corporation and Pegasystems Inc. for their most recent fiscal years, providing a snapshot of their profitability, liquidity, leverage, and market valuation.
| Ratios | Atlassian Corporation (2025) | Pegasystems Inc. (2024) |
|---|---|---|
| ROE | -19.1% | 16.9% |
| ROIC | -4.5% | 7.4% |
| P/E | -207.1 | 80.1 |
| P/B | 39.5 | 13.6 |
| Current Ratio | 1.22 | 1.23 |
| Quick Ratio | 1.22 | 1.23 |
| D/E (Debt-to-Equity) | 0.92 | 0.94 |
| Debt-to-Assets | 20.5% | 31.1% |
| Interest Coverage | -4.27 | 18.1 |
| Asset Turnover | 0.86 | 0.85 |
| Fixed Asset Turnover | 19.0 | 14.4 |
| Payout ratio | 0% | 10.3% |
| Dividend yield | 0% | 0.13% |
Interpretation of the Ratios
Atlassian Corporation
Atlassian shows several unfavorable profitability ratios, including a negative net margin of -4.92% and return on equity at -19.08%, indicating weak profitability and returns. The balance sheet ratios are mixed, with a neutral current ratio of 1.22 but favorable debt metrics. The company does not pay dividends, reflecting a reinvestment strategy consistent with its high R&D intensity.
Pegasystems Inc.
Pegasystems displays mostly neutral to favorable ratios, such as a positive net margin of 6.63% and a strong return on equity of 16.94%, indicating better profitability than Atlassian. The company maintains a neutral current ratio of 1.23 and favorable interest coverage. It pays a small dividend with a yield of 0.13%, suggesting modest shareholder returns alongside ongoing investments.
Which one has the best ratios?
Pegasystems has a slightly favorable overall ratio profile, showing better profitability and coverage metrics than Atlassian, which is slightly unfavorable due to its negative returns and weaker earnings. However, both companies maintain solid liquidity and manageable debt levels. The choice depends on investors’ preference for growth versus dividend income.
Strategic Positioning
This section compares the strategic positioning of Atlassian Corporation and Pegasystems Inc., including market position, key segments, and exposure to technological disruption:
Atlassian Corporation
- Leading global software application provider with strong NASDAQ presence and competitive pressure.
- Diverse product portfolio including project management, collaboration, and developer tools driving revenue growth.
- Offers cloud-based and enterprise software solutions with ongoing innovation in developer experience and security.
Pegasystems Inc.
- Mid-sized software company with established presence in enterprise applications facing moderate competition.
- Focused on customer engagement and digital process automation across multiple industries and regions.
- Provides cloud infrastructure and intelligent automation software, adapting to evolving digital workflows.
Atlassian Corporation vs Pegasystems Inc. Positioning
Atlassian pursues a diversified strategy with multiple software products serving various teams, while Pegasystems concentrates on customer engagement and automation platforms. Atlassian’s breadth may reduce risk, whereas Pegasystems’s focus targets niche markets with tailored solutions.
Which has the best competitive advantage?
Both companies are currently shedding value as ROIC is below WACC; however, Pegasystems shows improving profitability with a growing ROIC trend, contrasting Atlassian’s declining ROIC and more unfavorable moat status.
Stock Comparison
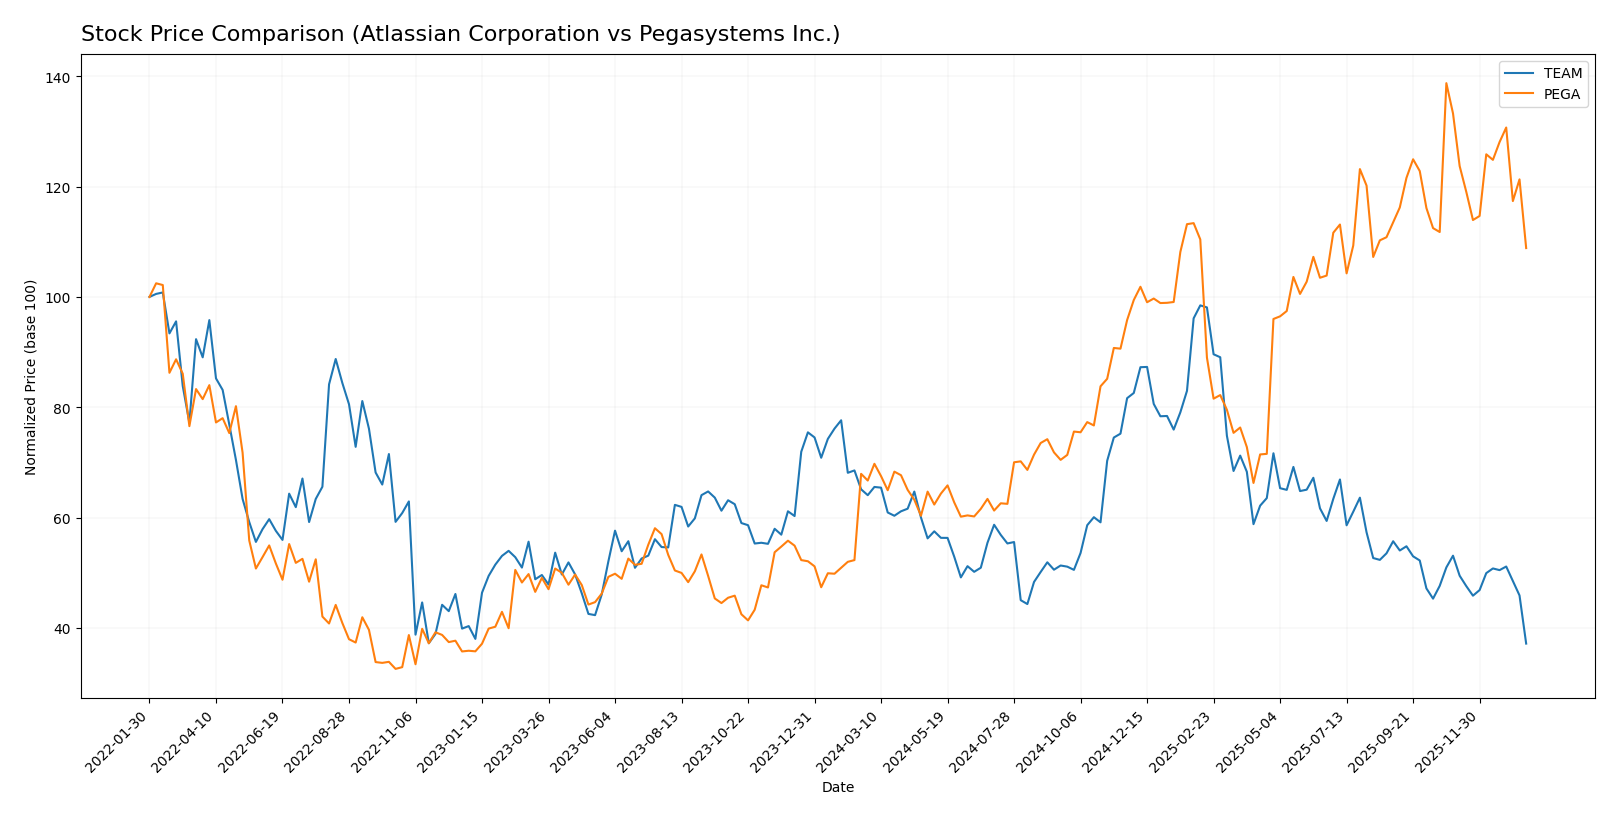
The stock price dynamics over the past 12 months reveal contrasting trajectories: Atlassian Corporation (TEAM) experienced a significant decline, while Pegasystems Inc. (PEGA) posted substantial gains despite recent downward pressure.
Trend Analysis
Atlassian Corporation’s stock showed a bearish trend over the past year with a -42.01% price change and decelerating decline, hitting a high of 314.28 and a low of 118.55. Volatility was high, with a 41.22 standard deviation.
Pegasystems Inc.’s stock exhibited a bullish trend over the same period, rising 63.18% with deceleration in momentum. Its price ranged between 28.73 and 66.27, supported by moderate volatility at a 10.77 standard deviation.
Comparing both, Pegasystems delivered the highest market performance over the past year, outperforming Atlassian’s significant negative return despite short-term downward trends for both stocks.
Target Prices
Analysts present a clear consensus on target prices for Atlassian Corporation and Pegasystems Inc.
| Company | Target High | Target Low | Consensus |
|---|---|---|---|
| Atlassian Corporation | 290 | 185 | 234.14 |
| Pegasystems Inc. | 80 | 67 | 74 |
The consensus target prices for Atlassian and Pegasystems indicate significant upside potential compared to their current prices of 118.55 and 51.99 USD, respectively. Analysts expect both stocks to appreciate notably in the medium term.
Analyst Opinions Comparison
This section compares analysts’ ratings and grades for Atlassian Corporation and Pegasystems Inc.:
Rating Comparison
Atlassian Corporation Rating
- Rating: C, classified as Very Favorable by analysts.
- Discounted Cash Flow Score: 5, indicating a Very Favorable valuation based on future cash flows.
- ROE Score: 1, reflecting Very Unfavorable efficiency in generating profit from equity.
- ROA Score: 1, showing Very Unfavorable asset utilization to generate earnings.
- Debt To Equity Score: 1, signaling Very Unfavorable financial risk from debt.
- Overall Score: 2, assessed as Moderate financial standing.
Pegasystems Inc. Rating
- Rating: B+, classified as Very Favorable by analysts.
- Discounted Cash Flow Score: 3, suggesting a Moderate valuation outlook.
- ROE Score: 5, indicating Very Favorable profit generation efficiency.
- ROA Score: 5, demonstrating Very Favorable asset utilization.
- Debt To Equity Score: 3, indicating Moderate financial risk.
- Overall Score: 3, assessed as Moderate financial standing.
Which one is the best rated?
Based strictly on the provided data, Pegasystems Inc. holds a higher rating (B+) and outperforms Atlassian Corporation in ROE, ROA, and overall score. Atlassian has a stronger discounted cash flow score but weaker profitability and debt metrics.
Scores Comparison
The scores comparison between Atlassian Corporation and Pegasystems Inc. is as follows:
Atlassian Corporation Scores
- Altman Z-Score: 4.7, indicating a safe zone with low bankruptcy risk.
- Piotroski Score: 5, showing average financial strength.
Pegasystems Inc. Scores
- Altman Z-Score: 10.3, indicating a safe zone with very low bankruptcy risk.
- Piotroski Score: 8, indicating very strong financial health.
Which company has the best scores?
Pegasystems Inc. has higher scores in both Altman Z-Score and Piotroski Score compared to Atlassian Corporation. This suggests Pegasystems shows stronger financial stability and health based strictly on the provided data.
Grades Comparison
Here is a detailed comparison of the recent grades issued by established grading companies for both Atlassian Corporation and Pegasystems Inc.:
Atlassian Corporation Grades
The following table summarizes the latest grades from reputable financial institutions for Atlassian Corporation:
| Grading Company | Action | New Grade | Date |
|---|---|---|---|
| BTIG | Maintain | Buy | 2026-01-13 |
| Piper Sandler | Maintain | Overweight | 2026-01-05 |
| Bernstein | Maintain | Outperform | 2025-11-18 |
| Macquarie | Maintain | Outperform | 2025-11-03 |
| Mizuho | Maintain | Outperform | 2025-10-31 |
| Bernstein | Maintain | Outperform | 2025-10-31 |
| TD Cowen | Maintain | Hold | 2025-10-27 |
| BMO Capital | Maintain | Outperform | 2025-10-24 |
| UBS | Maintain | Neutral | 2025-10-24 |
| Keybanc | Maintain | Overweight | 2025-10-23 |
Overall, Atlassian’s grades trend strongly positive, with a majority of “Outperform,” “Buy,” and “Overweight” ratings, indicating general confidence from analysts.
Pegasystems Inc. Grades
The following table presents the latest grades for Pegasystems Inc. from recognized grading companies:
| Grading Company | Action | New Grade | Date |
|---|---|---|---|
| JP Morgan | Maintain | Overweight | 2025-12-05 |
| Wedbush | Maintain | Outperform | 2025-10-23 |
| RBC Capital | Maintain | Outperform | 2025-10-23 |
| Barclays | Maintain | Equal Weight | 2025-10-23 |
| Rosenblatt | Maintain | Buy | 2025-10-23 |
| DA Davidson | Upgrade | Buy | 2025-10-22 |
| Rosenblatt | Maintain | Buy | 2025-10-15 |
| Rosenblatt | Maintain | Buy | 2025-07-24 |
| DA Davidson | Maintain | Neutral | 2025-07-24 |
| Wedbush | Maintain | Outperform | 2025-07-24 |
Pegasystems’ grades show a solid profile with multiple “Buy,” “Outperform,” and “Overweight” ratings, alongside some “Neutral” and “Equal Weight,” reflecting a generally positive but slightly more mixed analyst view.
Which company has the best grades?
Atlassian Corporation has received a higher concentration of “Outperform” and “Buy” grades compared to Pegasystems Inc., which shows a more mixed rating distribution. Investors may interpret Atlassian’s stronger consensus as a sign of greater analyst confidence, potentially influencing portfolio allocation decisions.
Strengths and Weaknesses
Below is a comparative overview of key strengths and weaknesses of Atlassian Corporation (TEAM) and Pegasystems Inc. (PEGA) based on the most recent financial and strategic data.
| Criterion | Atlassian Corporation (TEAM) | Pegasystems Inc. (PEGA) |
|---|---|---|
| Diversification | Strong focus on License and Service with growing revenues; limited diversification outside core offerings | More diversified with Cloud, Consulting, Maintenance, and Subscription segments contributing significantly |
| Profitability | Negative net margin (-4.92%) and ROE (-19.08%); company is currently shedding value | Positive net margin (6.63%) and ROE (16.94%); profitability improving though still slightly unfavorable moat |
| Innovation | High fixed asset turnover (19.02) indicating efficient asset use; innovation impact limited by declining ROIC | Solid innovation reflected in growing ROIC trend and favorable interest coverage ratio (21.87) |
| Global presence | Moderate global reach with steady revenue growth in License and Service | Strong global presence with significant cloud revenue and consulting services |
| Market Share | Large market share in collaboration software but facing profitability challenges | Competitive market share in BPM and CRM markets with improving profitability and growth |
Key takeaways: Atlassian shows strong revenue growth and asset efficiency but struggles with profitability and value creation. Pegasystems demonstrates improving profitability and diversification, making it a slightly more favorable candidate despite some valuation concerns. Both companies warrant cautious consideration with a focus on risk management.
Risk Analysis
Below is a summary table outlining the key risks for Atlassian Corporation (TEAM) and Pegasystems Inc. (PEGA) based on the most recent data from 2025 for TEAM and 2024 for PEGA:
| Metric | Atlassian Corporation (TEAM) | Pegasystems Inc. (PEGA) |
|---|---|---|
| Market Risk | Moderate (Beta 0.888, volatile price range 118-326) | Moderate (Beta 1.084, price range 29.8-68.1) |
| Debt level | Moderate (Debt/Equity 0.92, Debt to Assets 20.5%) | Moderate (Debt/Equity 0.94, Debt to Assets 31.1%) |
| Regulatory Risk | Medium – operates globally with data security focus | Medium – US-based, global operations with sector regulations |
| Operational Risk | Moderate – product complexity, tech innovation demands | Moderate – software platform complexity, customer reliance |
| Environmental Risk | Low – technology sector, limited direct impact | Low – technology sector, limited direct impact |
| Geopolitical Risk | Moderate – Australian HQ, global market exposure | Moderate – US HQ, international market exposure |
The most impactful risks for TEAM stem from its negative profitability metrics and weak financial ratios in 2025, signaling potential operational and financial instability. PEGA maintains stronger financial health with positive returns and a very strong Piotroski score, but faces valuation concerns with a high P/E ratio. Both companies bear moderate market and geopolitical risks due to their global technology operations. Investors should closely monitor profitability and debt management in TEAM, while PEGA’s valuation and regulatory environment warrant attention.
Which Stock to Choose?
Atlassian Corporation (TEAM) shows strong revenue growth of 19.66% in 2025 and favorable gross margin at 82.84%, but suffers from negative profitability metrics including ROE at -19.08% and a declining ROIC below WACC, indicating value destruction. Its financial ratios are slightly unfavorable overall, with a moderate rating C and average financial strength scores.
Pegasystems Inc. (PEGA) reports moderate revenue growth of 4.51% in 2024 with a solid net margin of 6.63% and positive ROE at 16.94%. Although ROIC remains below WACC, it trends upward, signaling improving profitability. Its financial ratios are slightly favorable, supported by a strong rating B+ and strong financial health scores.
Investors prioritizing growth might find Atlassian’s robust income expansion and favorable income statement appealing despite profitability challenges, whereas those valuing financial stability and improving profit metrics may view Pegasystems more favorably given its stronger ratios and rating. The choice could therefore depend on individual risk tolerance and investment strategy.
Disclaimer: Investment carries a risk of loss of initial capital. The past performance is not a reliable indicator of future results. Be sure to understand risks before making an investment decision.
Go Further
I encourage you to read the complete analyses of Atlassian Corporation and Pegasystems Inc. to enhance your investment decisions: