Atlassian Corporation (TEAM) and Paycom Software, Inc. (PAYC) are two prominent players in the software application industry, each driving innovation in their niche markets. While Atlassian focuses on collaboration and project management tools, Paycom specializes in cloud-based human capital management solutions. Their overlapping technological foundations and distinct growth strategies make them compelling candidates for comparison. In this article, I will help you determine which company offers the most attractive investment opportunity.
Table of contents
Companies Overview
I will begin the comparison between Atlassian Corporation and Paycom Software, Inc. by providing an overview of these two companies and their main differences.
Atlassian Corporation Overview
Atlassian Corporation, headquartered in Sydney, Australia, develops and licenses software products globally. Its mission is to improve team collaboration and project management through tools like Jira, Confluence, and Trello. The company offers a wide range of solutions for software development, service management, and enterprise agility, positioning itself as a leader in software applications for technical and business teams.
Paycom Software, Inc. Overview
Paycom Software, based in Oklahoma City, US, delivers cloud-based human capital management (HCM) solutions for small to mid-sized businesses. Its software-as-a-service platform covers talent acquisition, payroll, labor management, and compliance, aiming to streamline the entire employment lifecycle. Paycom’s focus on data analytics and employee self-service tools places it as a key player in the HCM software industry.
Key similarities and differences
Both companies operate in the software application sector and provide cloud-based solutions. Atlassian targets team collaboration and project management across various industries, while Paycom specializes in human capital management for US businesses. Atlassian has a broader global footprint and a diverse product portfolio, whereas Paycom focuses on workforce management with comprehensive payroll and compliance features.
Income Statement Comparison
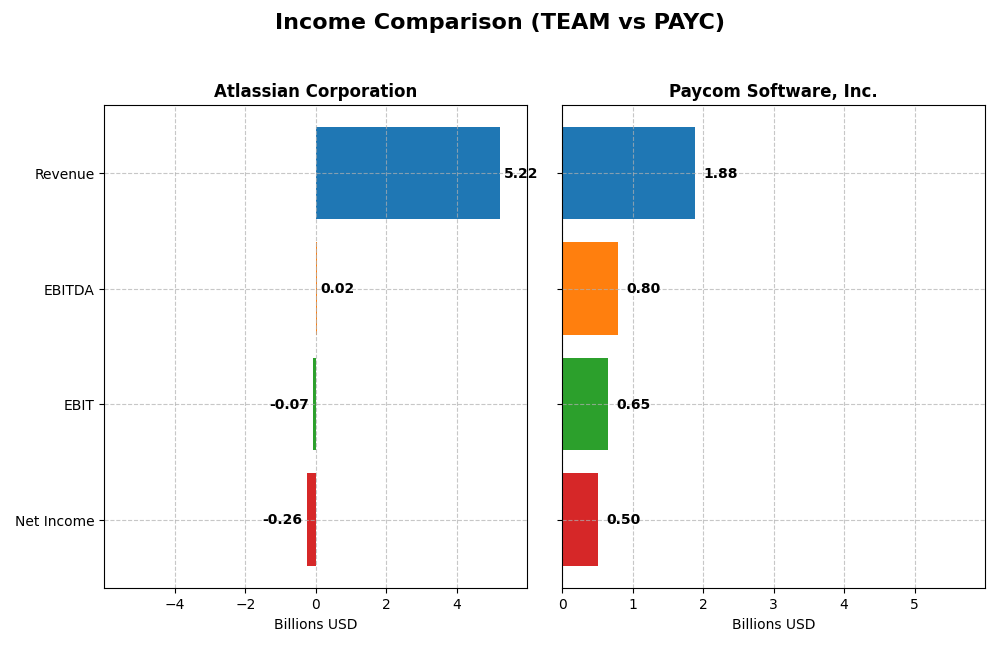
This table compares the latest fiscal year income statement metrics for Atlassian Corporation and Paycom Software, Inc., highlighting their financial performance and profitability.
| Metric | Atlassian Corporation | Paycom Software, Inc. |
|---|---|---|
| Market Cap | 31.1B | 8.3B |
| Revenue | 5.22B | 1.88B |
| EBITDA | 24.0M | 798.3M |
| EBIT | -68.3M | 652.4M |
| Net Income | -257.0M | 502.0M |
| EPS | -0.98 | 8.93 |
| Fiscal Year | 2025 | 2024 |
Income Statement Interpretations
Atlassian Corporation
Atlassian’s revenue grew significantly from $2.09B in 2021 to $5.22B in 2025, reflecting a 149.64% increase over five years. Despite strong gross margins remaining favorable near 83%, net income stayed negative, though losses narrowed from -$579M to -$257M. The latest year showed positive revenue growth of 19.66%, yet EBIT margin declined, indicating rising operating expenses impacting profitability.
Paycom Software, Inc.
Paycom demonstrated consistent revenue growth from $841M in 2020 to $1.88B in 2024, with a 123.81% increase overall. Margins are robust and stable, with an EBIT margin of 34.64% and net margin at 26.66%, all rated favorable. The most recent year saw an 11.19% revenue rise paired with strong net income growth of 32.48%, highlighting improving operational efficiency and profitability.
Which one has the stronger fundamentals?
Paycom exhibits stronger fundamentals, with positive net income, high and stable margins, and consistent growth. Atlassian, although growing revenue rapidly and maintaining gross margins, continues to post losses and a negative EBIT margin, reflecting higher operating costs. Paycom’s comprehensive favorable metrics suggest a more solid income statement performance over the period.
Financial Ratios Comparison
Below is a comparison of key financial ratios for Atlassian Corporation (TEAM) and Paycom Software, Inc. (PAYC) based on their most recent fiscal year data.
| Ratios | Atlassian Corporation (TEAM) FY 2025 | Paycom Software, Inc. (PAYC) FY 2024 |
|---|---|---|
| ROE | -19.1% | 31.9% |
| ROIC | -4.5% | 24.9% |
| P/E | -207.1 | 22.9 |
| P/B | 39.5 | 7.31 |
| Current Ratio | 1.22 | 1.10 |
| Quick Ratio | 1.22 | 1.10 |
| D/E | 0.92 | 0.053 |
| Debt-to-Assets | 20.5% | 1.4% |
| Interest Coverage | -4.27 | 187.0 |
| Asset Turnover | 0.86 | 0.32 |
| Fixed Asset Turnover | 19.0 | 2.93 |
| Payout Ratio | 0% | 16.9% |
| Dividend Yield | 0% | 0.74% |
Interpretation of the Ratios
Atlassian Corporation
Atlassian shows several unfavorable ratios including negative net margin (-4.92%), return on equity (-19.08%), and return on invested capital (-4.48%), indicating weak profitability. However, it has favorable debt to assets (20.51%) and quick ratio (1.22). The company does not pay dividends, likely reflecting reinvestment in growth and product development.
Paycom Software, Inc.
Paycom exhibits strong profitability with favorable net margin (26.66%), return on equity (31.85%), and return on invested capital (24.86%). Most debt-related ratios are favorable, though asset turnover (0.32) is weak. The company pays dividends with a 0.74% yield, but this is considered unfavorable compared to its solid cash flow and growth metrics.
Which one has the best ratios?
Paycom Software displays a more favorable overall ratio profile, with 57.14% favorable metrics versus Atlassian’s 35.71%. Atlassian’s profitability and efficiency ratios are mostly unfavorable, while Paycom demonstrates robust profitability and sound financial health despite some minor concerns.
Strategic Positioning
This section compares the strategic positioning of Atlassian Corporation and Paycom Software, Inc., focusing on market position, key segments, and exposure to technological disruption:
Atlassian Corporation
- Large market cap near 31B, faces competitive pressure in software application industry.
- Diverse software portfolio including project management, collaboration, and developer tools.
- Exposure to tech change through continuous delivery and developer experience platforms.
Paycom Software, Inc.
- Smaller market cap around 8.3B, competes in cloud-based HCM software sector.
- Concentrated on cloud-based human capital management solutions for SMBs in the US.
- Focus on cloud SaaS HCM with proprietary features like Bluetooth-based Microfence.
Atlassian Corporation vs Paycom Software, Inc. Positioning
Atlassian offers a diversified product range across collaboration and development tools, serving broad enterprise needs. Paycom concentrates on US SMBs with integrated HCM software, emphasizing payroll and talent management. Atlassian’s breadth contrasts with Paycom’s focused specialization.
Which has the best competitive advantage?
Paycom demonstrates a strong economic moat with growing ROIC exceeding WACC, indicating durable value creation. Atlassian shows declining ROIC below WACC, signaling value destruction and weaker competitive advantage over recent years.
Stock Comparison
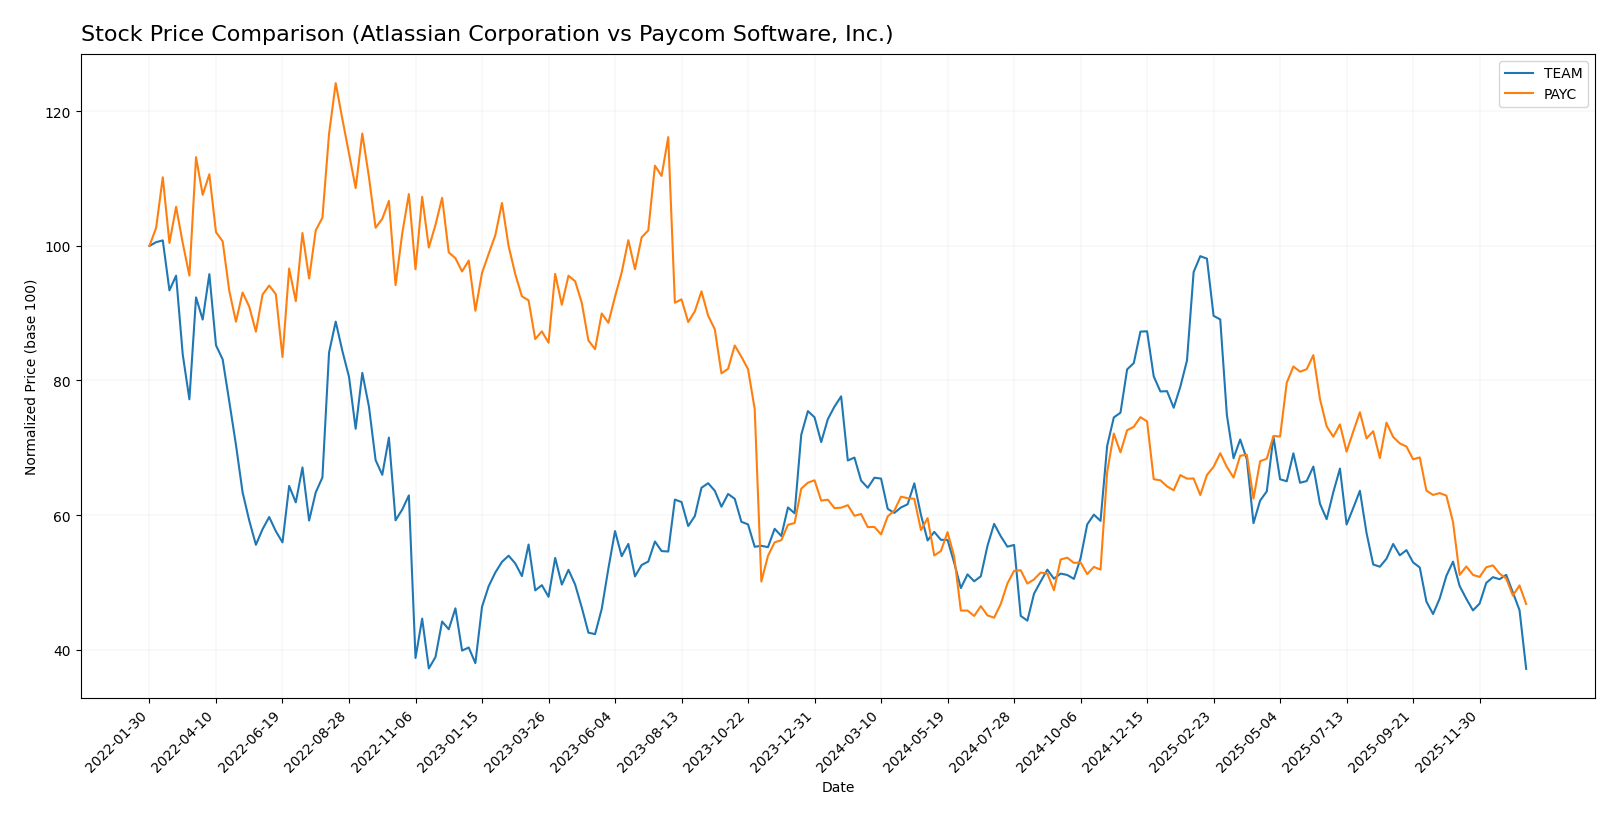
The stock prices of Atlassian Corporation and Paycom Software, Inc. have both exhibited notable declines over the past 12 months, with sustained bearish trends and decelerating momentum.
Trend Analysis
Atlassian Corporation’s stock price decreased by 42.01% over the past year, showing a bearish trend with deceleration. The price ranged between a high of 314.28 and a low of 118.55, with high volatility indicated by a 41.22 standard deviation.
Paycom Software, Inc. experienced a 19.64% decline over the same period, also bearish with deceleration. Its price fluctuated from a high of 265.71 to a low of 141.96, with a standard deviation of 31.92 reflecting moderate volatility.
Comparing both, Atlassian’s stock showed a larger percentage loss and greater volatility, resulting in a lower market performance than Paycom over the past year.
Target Prices
The current analyst consensus indicates optimistic target prices for Atlassian Corporation and Paycom Software, Inc.
| Company | Target High | Target Low | Consensus |
|---|---|---|---|
| Atlassian Corporation | 290 | 185 | 234.14 |
| Paycom Software, Inc. | 290 | 165 | 215 |
Analysts expect Atlassian’s stock to more than double from its current price of $118.55, while Paycom’s consensus target of $215 suggests significant upside from its $148.41 market price. Both stocks present promising potential according to the target price consensus.
Analyst Opinions Comparison
This section compares analysts’ ratings and grades for Atlassian Corporation and Paycom Software, Inc.:
Rating Comparison
TEAM Rating
- Rating: C, classified as Very Favorable overall.
- Discounted Cash Flow Score: 5, indicating a very favorable valuation based on future cash flow.
- ROE Score: 1, showing very unfavorable efficiency in generating profit from equity.
- ROA Score: 1, very unfavorable use of assets to generate earnings.
- Debt To Equity Score: 1, very unfavorable financial risk profile with high leverage.
- Overall Score: 2, moderate financial standing.
PAYC Rating
- Rating: A, classified as Very Favorable overall.
- Discounted Cash Flow Score: 5, also very favorable in assessing undervaluation.
- ROE Score: 5, very favorable efficiency in generating shareholder returns.
- ROA Score: 5, very favorable asset utilization.
- Debt To Equity Score: 4, favorable balance sheet strength with moderate debt levels.
- Overall Score: 4, favorable financial standing.
Which one is the best rated?
Based strictly on the provided data, Paycom Software (PAYC) is better rated overall with an A rating and higher scores in ROE, ROA, debt-to-equity, and overall metrics. Atlassian (TEAM) has a lower C rating and weaker profitability and leverage scores despite a strong discounted cash flow score.
Scores Comparison
Here is a comparison of the Altman Z-Score and Piotroski Score for the two companies:
TEAM Scores
- Altman Z-Score: 4.70, placing Atlassian in safe zone, low bankruptcy risk.
- Piotroski Score: 5, indicating average financial strength.
PAYC Scores
- Altman Z-Score: 3.84, placing Paycom in safe zone, low bankruptcy risk.
- Piotroski Score: 5, indicating average financial strength.
Which company has the best scores?
Both Atlassian and Paycom have Altman Z-Scores in the safe zone, with Atlassian slightly higher at 4.70 versus Paycom’s 3.84. Their Piotroski Scores are identical at 5, showing average financial strength for both companies.
Grades Comparison
Here is the comparison of the latest grades from recognized grading companies for Atlassian Corporation and Paycom Software, Inc.:
Atlassian Corporation Grades
The table below shows recent grades assigned to Atlassian Corporation by various grading firms:
| Grading Company | Action | New Grade | Date |
|---|---|---|---|
| BTIG | Maintain | Buy | 2026-01-13 |
| Piper Sandler | Maintain | Overweight | 2026-01-05 |
| Bernstein | Maintain | Outperform | 2025-11-18 |
| Macquarie | Maintain | Outperform | 2025-11-03 |
| Mizuho | Maintain | Outperform | 2025-10-31 |
| Bernstein | Maintain | Outperform | 2025-10-31 |
| TD Cowen | Maintain | Hold | 2025-10-27 |
| BMO Capital | Maintain | Outperform | 2025-10-24 |
| UBS | Maintain | Neutral | 2025-10-24 |
| Keybanc | Maintain | Overweight | 2025-10-23 |
Atlassian’s grades predominantly reflect strong positive sentiment, with multiple “Outperform” and “Overweight” ratings and no downgrades.
Paycom Software, Inc. Grades
Below is the recent grading data for Paycom Software, Inc. from reputable sources:
| Grading Company | Action | New Grade | Date |
|---|---|---|---|
| Barclays | Maintain | Equal Weight | 2026-01-12 |
| TD Cowen | Maintain | Buy | 2026-01-08 |
| Citigroup | Maintain | Neutral | 2025-12-23 |
| Keybanc | Maintain | Overweight | 2025-11-06 |
| TD Cowen | Maintain | Buy | 2025-11-06 |
| UBS | Maintain | Buy | 2025-11-06 |
| Jefferies | Maintain | Hold | 2025-11-06 |
| JP Morgan | Maintain | Neutral | 2025-11-06 |
| Mizuho | Maintain | Neutral | 2025-11-06 |
| Barclays | Maintain | Equal Weight | 2025-11-06 |
Paycom shows a more mixed grading profile, with a blend of “Buy,” “Hold,” “Neutral,” and “Equal Weight” ratings, indicating varied analyst views.
Which company has the best grades?
Atlassian Corporation has received stronger and more consistent positive grades, mostly “Outperform” and “Overweight,” compared to Paycom Software’s mixed ratings centered around “Buy” and “Hold.” This suggests Atlassian is viewed more favorably by analysts, which could influence investor confidence and portfolio allocation decisions.
Strengths and Weaknesses
The following table summarizes the key strengths and weaknesses of Atlassian Corporation (TEAM) and Paycom Software, Inc. (PAYC) based on recent financial and operational data.
| Criterion | Atlassian Corporation (TEAM) | Paycom Software, Inc. (PAYC) |
|---|---|---|
| Diversification | Moderate, primarily focused on software licenses and services | High, strong recurring revenue with implementation services |
| Profitability | Unfavorable, negative net margin (-4.92%) and ROIC (-4.48%) | Favorable, strong net margin (26.66%) and ROIC (24.86%) |
| Innovation | Moderate, with growing product and service revenue but declining profitability | High, sustained growth and innovation reflected in increasing profitability |
| Global presence | Significant, but value destruction signals caution | Strong, indicated by durable competitive advantage and growing ROIC |
| Market Share | Moderate, but facing value erosion and profitability challenges | Strong, with growing market share supported by high returns and favorable financial ratios |
Key takeaways: Paycom demonstrates a robust competitive position with solid profitability, innovation, and efficient capital use, making it attractive for investors. Atlassian, despite its market presence, is currently experiencing value destruction and profitability issues, warranting caution.
Risk Analysis
Below is a comparative risk assessment table for Atlassian Corporation (TEAM) and Paycom Software, Inc. (PAYC) based on the most recent data available for 2025 and 2024 respectively.
| Metric | Atlassian Corporation (TEAM) | Paycom Software, Inc. (PAYC) |
|---|---|---|
| Market Risk | Moderate beta (0.888), recent price drop -7.7% | Lower beta (0.824), milder price drop -2.9% |
| Debt level | Debt-to-assets 20.51% (favorable), Debt/Equity 0.92 (neutral) | Very low debt-to-assets 1.42% (favorable), Debt/Equity 0.05 (favorable) |
| Regulatory Risk | Moderate, Australian base with global reach | Moderate, US-focused cloud HCM industry |
| Operational Risk | Negative net margin (-4.92%), negative ROE (-19.08%) | Strong profitability (net margin 26.66%), high ROE (31.85%) |
| Environmental Risk | Moderate, technology sector with cloud operations | Moderate, similar tech sector exposure |
| Geopolitical Risk | Exposure to Australian and global markets | Primarily US market exposure, potentially less geopolitical risk |
Synthesis: Atlassian faces significant operational risks due to negative profitability and returns, alongside moderate market and geopolitical risks from its global presence. Paycom shows strong financial health with low debt and robust margins, mitigating operational and market risks. Investors should weigh Atlassian’s financial distress signals against Paycom’s stability.
Which Stock to Choose?
Atlassian Corporation (TEAM) shows favorable revenue growth of 19.66% in 2025 with a strong gross margin of 82.84%, but profitability ratios are mostly unfavorable. The company carries moderate debt and a slightly unfavorable global financial ratio profile, with a very favorable rating of C.
Paycom Software, Inc. (PAYC) presents consistent favorable income growth and profitability, including a 26.66% net margin and 31.85% ROE in 2024. Its debt levels are low, supported by a favorable global ratio evaluation and a very favorable A rating, indicating financial strength and value creation.
Investors focusing on growth might find TEAM’s revenue expansion attractive despite its profitability challenges, while those prioritizing financial stability and value creation could view PAYC’s consistent profitability and strong ratings as more favorable. This interpretation depends on individual risk tolerance and investment strategy.
Disclaimer: Investment carries a risk of loss of initial capital. The past performance is not a reliable indicator of future results. Be sure to understand risks before making an investment decision.
Go Further
I encourage you to read the complete analyses of Atlassian Corporation and Paycom Software, Inc. to enhance your investment decisions: