Atlassian Corporation and PagerDuty, Inc. are two prominent players in the software application industry, each driving innovation in digital collaboration and operations management. While Atlassian offers a broad suite of project management and developer tools, PagerDuty focuses on real-time incident response using machine learning. This article will analyze their market positions and growth strategies to reveal which company holds the greatest potential for investors seeking strong returns.
Table of contents
Companies Overview
I will begin the comparison between Atlassian Corporation and PagerDuty, Inc. by providing an overview of these two companies and their main differences.
Atlassian Corporation Overview
Atlassian Corporation is a technology company headquartered in Sydney, Australia, specializing in software applications that enhance team collaboration and project management. Its offerings include Jira Software, Confluence, Trello, and various developer tools, targeting both technical and business teams worldwide. Founded in 2002, Atlassian aims to improve productivity by connecting workflows and enabling enterprise agility through its diverse software portfolio.
PagerDuty, Inc. Overview
PagerDuty, Inc., based in San Francisco, US, operates a digital operations management platform that uses machine learning to analyze data from software-enabled systems. Founded in 2009, it serves multiple industries such as technology, telecommunications, retail, and financial services. PagerDuty focuses on real-time incident detection and response, providing solutions that predict and address operational issues to enhance business continuity and efficiency.
Key similarities and differences
Both Atlassian and PagerDuty operate in the technology sector within the software application industry, focusing on improving operational efficiency through software solutions. Atlassian offers a broad suite of collaboration and project management tools for diverse teams, whereas PagerDuty specializes in digital operations and incident management with machine learning capabilities. Their business models converge on software innovation but differ in scope—Atlassian targets workflow integration, while PagerDuty emphasizes real-time operational intelligence.
Income Statement Comparison
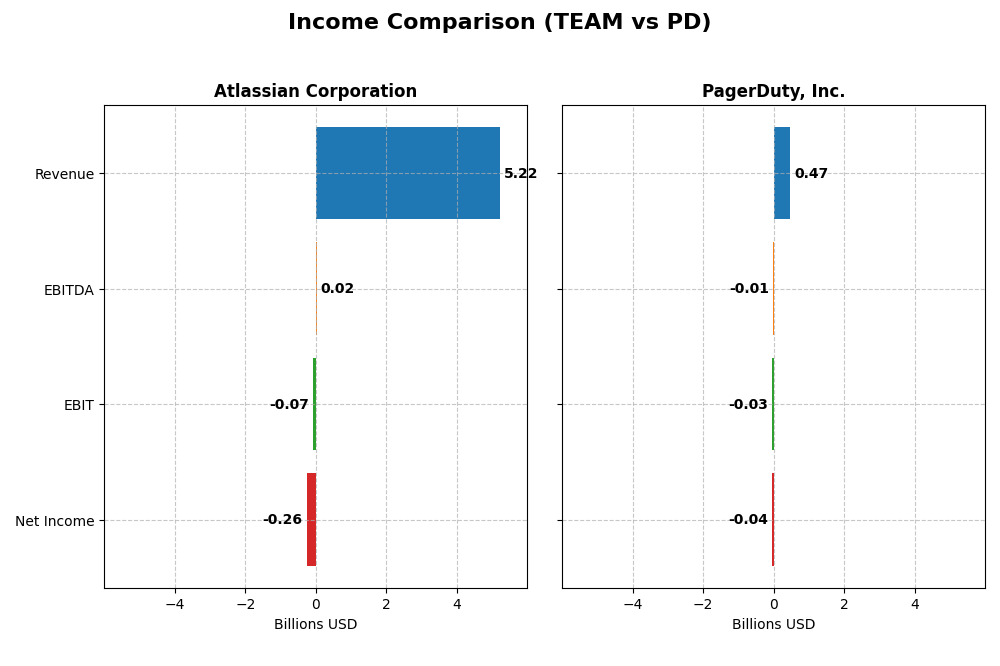
The table below presents a side-by-side comparison of key income statement metrics for Atlassian Corporation and PagerDuty, Inc. for the most recent fiscal year available.
| Metric | Atlassian Corporation (TEAM) | PagerDuty, Inc. (PD) |
|---|---|---|
| Market Cap | 31.1B | 1.03B |
| Revenue | 5.22B | 467.5M |
| EBITDA | 24.0M | -11.9M |
| EBIT | -68.3M | -32.5M |
| Net Income | -257.0M | -54.5M |
| EPS | -0.98 | -0.59 |
| Fiscal Year | 2025 | 2025 |
Income Statement Interpretations
Atlassian Corporation
Atlassian’s revenue has grown significantly from 2.1B in 2021 to 5.2B in 2025, with net income losses narrowing from -579M to -257M. Gross margins remained strong and favorable, above 80%, while net margins improved but stayed negative at -4.92% in 2025. The latest year shows robust revenue growth of 19.66%, but EBIT declined, reflecting increased operating expenses.
PagerDuty, Inc.
PagerDuty’s revenue increased steadily from 214M in 2021 to 467M in 2025, with net losses improving from -69M to -43M. Gross margins held steady near 83%, while net margins remained negative at -9.14%. The most recent year saw moderate revenue growth of 8.54% accompanied by favorable EBIT and net margin improvements, signaling better expense management.
Which one has the stronger fundamentals?
Both companies exhibit favorable gross margins and improving net margins, yet Atlassian’s larger scale and faster revenue growth stand out. PagerDuty shows stronger margin improvements and better EBIT growth rates recently. Atlassian’s higher operating expenses weigh on profits, while PagerDuty manages costs more effectively. Overall, both have favorable income trends with distinct strengths and weaknesses.
Financial Ratios Comparison
The table below presents a side-by-side comparison of key financial ratios for Atlassian Corporation and PagerDuty, Inc. based on their most recent fiscal year data available.
| Ratios | Atlassian Corporation (TEAM) FY 2025 | PagerDuty, Inc. (PD) FY 2025 |
|---|---|---|
| ROE | -19.1% | -32.9% |
| ROIC | -4.5% | -9.7% |
| P/E | -207.1 | -39.9 |
| P/B | 39.5 | 13.1 |
| Current Ratio | 1.22 | 1.87 |
| Quick Ratio | 1.22 | 1.87 |
| D/E (Debt-to-Equity) | 0.92 | 3.57 |
| Debt-to-Assets | 20.5% | 50.0% |
| Interest Coverage | -4.27 | -6.46 |
| Asset Turnover | 0.86 | 0.50 |
| Fixed Asset Turnover | 19.0 | 16.6 |
| Payout Ratio | 0% | 0% |
| Dividend Yield | 0% | 0% |
Interpretation of the Ratios
Atlassian Corporation
Atlassian shows a mixed financial profile with unfavorable net margin (-4.92%), ROE (-19.08%), and ROIC (-4.48%), indicating profitability challenges. However, favorable metrics include a low debt-to-assets ratio (20.51%) and strong fixed asset turnover (19.02). The current and quick ratios suggest adequate short-term liquidity. Atlassian does not pay dividends, likely focusing on reinvestment and growth, with no shareholder returns via dividends.
PagerDuty, Inc.
PagerDuty’s ratios reveal more pronounced weaknesses: net margin at -9.14%, ROE at -32.92%, and ROIC at -9.66%, reflecting deeper profitability issues. Although liquidity ratios are favorable (current and quick ratios at 1.87), its high debt-to-assets ratio (50%) and debt-to-equity (3.57) pose risks. PagerDuty also does not distribute dividends, possibly prioritizing growth and R&D over shareholder payouts.
Which one has the best ratios?
Atlassian exhibits a slightly more balanced ratio profile with fewer unfavorable metrics and better leverage management compared to PagerDuty, whose higher debt levels and greater profitability deficits weigh more heavily. Both companies face profitability pressures, but Atlassian’s liquidity and asset utilization metrics are comparatively stronger, leading to a less unfavorable overall assessment.
Strategic Positioning
This section compares the strategic positioning of Atlassian Corporation and PagerDuty, Inc., covering Market position, Key segments, and Exposure to technological disruption:
Atlassian Corporation
- Large market cap of 31B; operates globally with NASDAQ listing; faces competitive pressure in application software.
- Diverse software portfolio including project management, collaboration, and developer tools driving revenue streams.
- Offers a broad suite of cloud products enhancing security and collaboration; exposure to evolving cloud and AI trends.
PagerDuty, Inc.
- Smaller market cap of 1B; listed on NYSE; competes in digital operations management with niche focus.
- Focuses on digital operations platform using machine learning for multiple industries as key business driver.
- Uses machine learning to process data signals, exposed to AI disruption but concentrated in digital operations.
Atlassian Corporation vs PagerDuty, Inc. Positioning
Atlassian pursues a diversified strategy with a wide software portfolio serving various teams and developers, providing multiple revenue drivers. PagerDuty concentrates on digital operations with machine learning, focusing on fewer segments but leveraging AI for growth opportunities.
Which has the best competitive advantage?
Both companies are currently shedding value with ROIC below WACC. Atlassian shows declining profitability (very unfavorable moat), while PagerDuty has slightly unfavorable moat but improving ROIC, indicating modestly better competitive advantage.
Stock Comparison
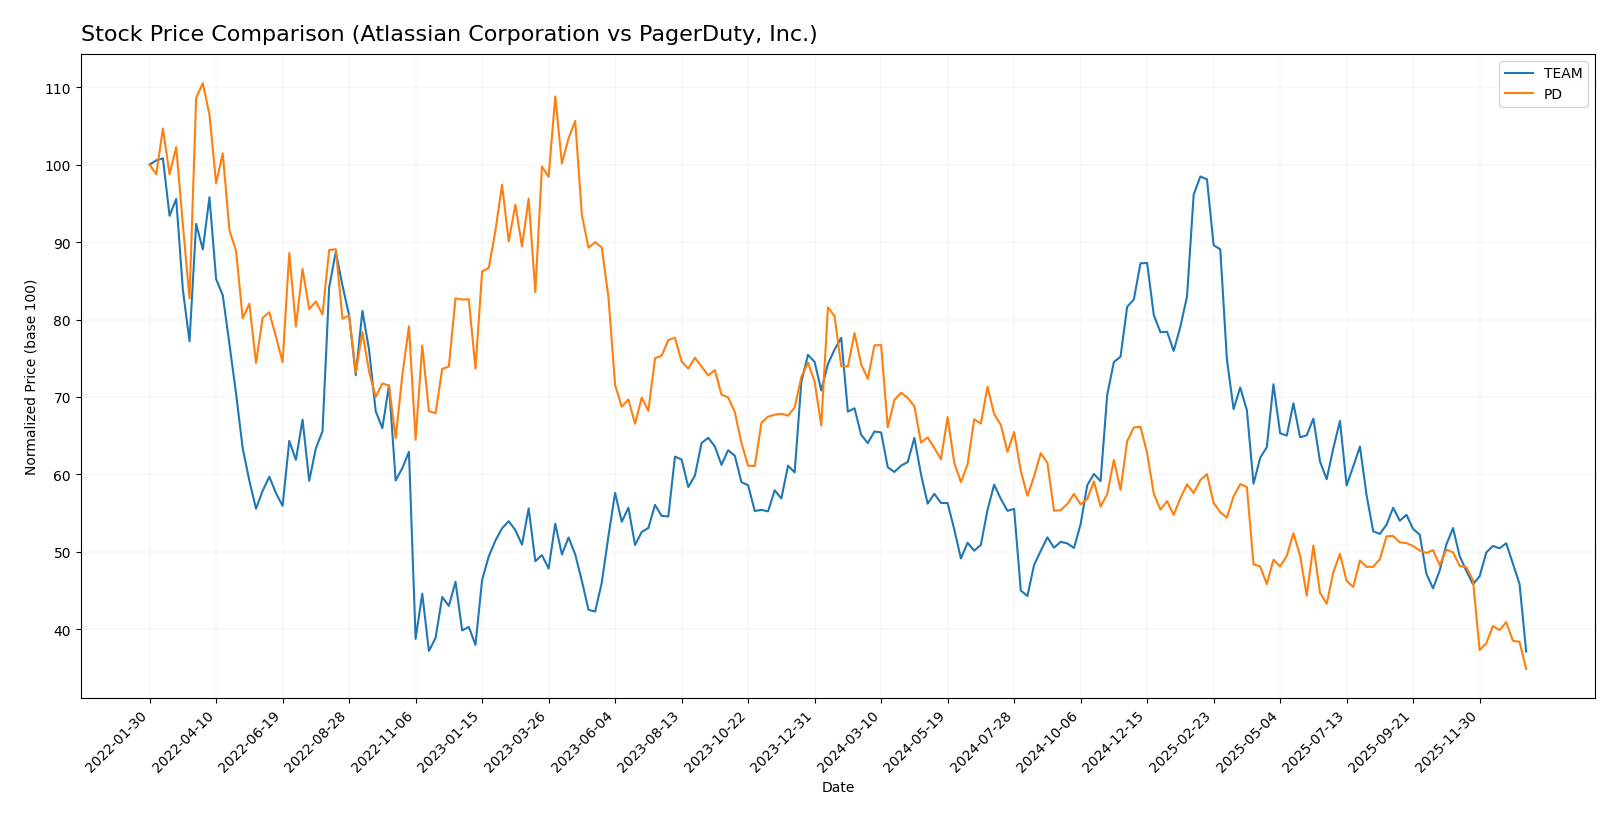
The stock prices of Atlassian Corporation and PagerDuty, Inc. have both exhibited significant declines over the past 12 months, reflecting bearish trends with notable deceleration in downward momentum and varying volatility levels.
Trend Analysis
Atlassian Corporation (TEAM) experienced a bearish trend over the past year with a -42.01% price change, marked by deceleration and high volatility (std. dev. 41.22), reaching a high of 314.28 and a low of 118.55.
PagerDuty, Inc. (PD) also showed a bearish trend with a -51.76% price change over the same period, deceleration in trend, and lower volatility (std. dev. 2.92), with its highest price at 24.66 and lowest at 11.22.
Comparing the two, Atlassian delivered a less severe decline than PagerDuty, indicating a relatively better market performance over the last 12 months.
Target Prices
The current analyst consensus reveals promising upside potential for both Atlassian Corporation and PagerDuty, Inc.
| Company | Target High | Target Low | Consensus |
|---|---|---|---|
| Atlassian Corporation | 290 | 185 | 234.14 |
| PagerDuty, Inc. | 19 | 15 | 16.2 |
Analysts expect Atlassian’s stock to more than double from its current price of $118.55, indicating strong confidence in growth. PagerDuty’s consensus target of $16.2 also suggests moderate upside compared to its current $11.22.
Analyst Opinions Comparison
This section compares analysts’ ratings and grades for Atlassian Corporation and PagerDuty, Inc.:
Rating Comparison
Atlassian Corporation Rating
- Rating: C, considered very favorable overall.
- Discounted Cash Flow Score: 5, indicates very favorable DCF valuation.
- ROE Score: 1, very unfavorable, showing poor equity returns.
- ROA Score: 1, very unfavorable, reflecting weak asset use efficiency.
- Debt To Equity Score: 1, very unfavorable, suggesting higher financial risk.
- Overall Score: 2, moderate overall financial standing.
PagerDuty, Inc. Rating
- Rating: A-, considered very favorable overall.
- Discounted Cash Flow Score: 5, also very favorable DCF valuation.
- ROE Score: 5, very favorable, indicating strong equity returns.
- ROA Score: 5, very favorable, showing effective asset utilization.
- Debt To Equity Score: 1, also very unfavorable, indicating similar debt concerns.
- Overall Score: 4, favorable overall financial standing.
Which one is the best rated?
PagerDuty, Inc. holds a clearly better rating with an A- and higher overall score of 4, supported by strong ROE and ROA scores, while Atlassian’s C rating and overall score of 2 reflect weaker financial metrics.
Scores Comparison
Here is a comparison of the Altman Z-Score and Piotroski Score for the two companies:
Atlassian Corporation Scores
- Altman Z-Score: 4.70, indicating a safe zone status.
- Piotroski Score: 5, representing average financial strength.
PagerDuty, Inc. Scores
- Altman Z-Score: 1.26, indicating a distress zone.
- Piotroski Score: 7, representing strong financial strength.
Which company has the best scores?
Atlassian shows a safer financial position with a high Altman Z-Score, while PagerDuty has a stronger Piotroski Score but is in financial distress by Altman’s measure. Each score highlights different aspects of financial health.
Grades Comparison
Here is the comparison of the latest reliable grades for Atlassian Corporation and PagerDuty, Inc.:
Atlassian Corporation Grades
The table below summarizes recent grades from reputable grading companies for Atlassian Corporation:
| Grading Company | Action | New Grade | Date |
|---|---|---|---|
| BTIG | Maintain | Buy | 2026-01-13 |
| Piper Sandler | Maintain | Overweight | 2026-01-05 |
| Bernstein | Maintain | Outperform | 2025-11-18 |
| Macquarie | Maintain | Outperform | 2025-11-03 |
| Mizuho | Maintain | Outperform | 2025-10-31 |
| Bernstein | Maintain | Outperform | 2025-10-31 |
| TD Cowen | Maintain | Hold | 2025-10-27 |
| BMO Capital | Maintain | Outperform | 2025-10-24 |
| UBS | Maintain | Neutral | 2025-10-24 |
| Keybanc | Maintain | Overweight | 2025-10-23 |
Overall, Atlassian’s grades predominantly indicate strong performance expectations, with most ratings at Outperform or Buy levels.
PagerDuty, Inc. Grades
The table below presents recent grades from verified grading entities for PagerDuty, Inc.:
| Grading Company | Action | New Grade | Date |
|---|---|---|---|
| Truist Securities | Maintain | Buy | 2026-01-07 |
| RBC Capital | Downgrade | Sector Perform | 2026-01-05 |
| TD Cowen | Maintain | Buy | 2025-11-26 |
| Craig-Hallum | Downgrade | Hold | 2025-11-26 |
| Morgan Stanley | Maintain | Equal Weight | 2025-11-26 |
| RBC Capital | Maintain | Outperform | 2025-11-26 |
| Truist Securities | Maintain | Buy | 2025-11-19 |
| Baird | Maintain | Neutral | 2025-09-04 |
| RBC Capital | Maintain | Outperform | 2025-09-04 |
| Canaccord Genuity | Maintain | Buy | 2025-09-04 |
PagerDuty’s ratings show mixed signals with several Buy grades but also downgrades and neutral stances, reflecting a more cautious outlook.
Which company has the best grades?
Atlassian Corporation has received consistently stronger grades, mostly Outperform and Buy, compared to PagerDuty’s more varied ratings including Hold and Sector Perform. This suggests Atlassian is viewed more favorably by analysts, potentially indicating higher confidence for investors.
Strengths and Weaknesses
Below is a comparison of key strengths and weaknesses for Atlassian Corporation (TEAM) and PagerDuty, Inc. (PD) based on the most recent data from 2025.
| Criterion | Atlassian Corporation (TEAM) | PagerDuty, Inc. (PD) |
|---|---|---|
| Diversification | Moderate: Revenue mainly from License & Service with growing Product & Service segments | Limited: Focused primarily on incident management software |
| Profitability | Weak: Negative net margin (-4.92%), ROIC -4.48%, shedding value with declining profitability | Weak: Larger losses with net margin -9.14%, ROIC -9.66%, but improving ROIC trend |
| Innovation | Strong product development in collaboration tools, high fixed asset turnover (19.02) | Moderate innovation, fixed asset turnover (16.61) good but less diversified |
| Global presence | Strong: Large global user base and product adoption | Moderate: Growing presence but smaller scale compared to Atlassian |
| Market Share | Significant in collaboration software market | Niche player in incident response market |
Key takeaways: Atlassian has a stronger global footprint and product diversification, but its profitability and capital efficiency are currently deteriorating. PagerDuty shows weaker financials but a positive ROIC trend, indicating potential for improvement. Both require cautious risk management given ongoing value destruction.
Risk Analysis
Below is a comparison of key risk factors for Atlassian Corporation (TEAM) and PagerDuty, Inc. (PD) based on the most recent 2025 data.
| Metric | Atlassian Corporation (TEAM) | PagerDuty, Inc. (PD) |
|---|---|---|
| Market Risk | Beta 0.888 (moderate) | Beta 0.627 (lower volatility) |
| Debt level | Debt-to-Equity 0.92 (neutral) | Debt-to-Equity 3.57 (high) |
| Regulatory Risk | Moderate (tech sector, global) | Moderate (tech sector, US-focused) |
| Operational Risk | Moderate (complex product suite) | Moderate (digital ops platform) |
| Environmental Risk | Low (software industry) | Low (software industry) |
| Geopolitical Risk | Medium (headquartered in Australia) | Medium (US-based, international exposure) |
In 2025, Atlassian shows moderate market risk with a beta just under 1, indicating average sensitivity to market swings, while PagerDuty has lower market volatility but carries significantly higher debt levels, raising financial risk. Both face typical regulatory and operational risks inherent to tech software companies. Atlassian’s strong Altman Z-score (4.7) suggests a low bankruptcy risk versus PagerDuty’s distress zone score (1.26), highlighting PagerDuty’s elevated financial vulnerability. Investors should weigh PagerDuty’s higher leverage and bankruptcy risk against Atlassian’s valuation challenges.
Which Stock to Choose?
Atlassian Corporation (TEAM) shows favorable income evolution with 19.66% revenue growth in 2025 and strong gross margin at 82.84%, despite negative profitability ratios including a -19.08% ROE. Its debt levels are moderate, supported by a favorable WACC, but overall financial ratios are slightly unfavorable. The company’s rating is very favorable (C), with moderate overall scores.
PagerDuty, Inc. (PD) also presents favorable income trends with 8.54% revenue growth and an 82.96% gross margin. Profitability remains challenged, with a -32.92% ROE and higher debt ratios, reflected in an unfavorable debt-to-equity score. Its rating is very favorable (A-), supported by strong returns and moderate valuation metrics but burdened by higher leverage.
Investors focused on growth might find TEAM’s stronger revenue expansion and moderate leverage appealing, while those prioritizing financial strength and improving profitability could see PD as more favorable given its better return scores and improving ROIC trend. Risk-averse investors might weigh TEAM’s slightly better debt profile, whereas risk-tolerant profiles may consider PD’s improving profitability despite higher leverage.
Disclaimer: Investment carries a risk of loss of initial capital. The past performance is not a reliable indicator of future results. Be sure to understand risks before making an investment decision.
Go Further
I encourage you to read the complete analyses of Atlassian Corporation and PagerDuty, Inc. to enhance your investment decisions: