Atlassian Corporation and monday.com Ltd. are two prominent players in the software application industry, both revolutionizing how teams collaborate and manage work. Atlassian’s extensive suite targets diverse business functions, while monday.com emphasizes a flexible, visual work operating system. Their innovation strategies and market overlap make them natural comparators. In this article, I will analyze both companies to help you decide which presents the most compelling investment opportunity in 2026.

Table of contents
Companies Overview
I will begin the comparison between Atlassian Corporation and monday.com Ltd. by providing an overview of these two companies and their main differences.
Atlassian Corporation Overview
Atlassian Corporation, headquartered in Sydney, Australia, designs and develops a diverse portfolio of software products aimed at enhancing team collaboration and project management. Its offerings include Jira Software, Confluence, and Trello, which connect technical and business teams globally. Established in 2002, Atlassian serves a broad market with enterprise agility, security, and developer tools, positioning itself as a leader in the software application industry with a market cap of $31B.
monday.com Ltd. Overview
monday.com Ltd., based in Tel Aviv, Israel, provides a cloud-based Work OS that enables users to build customized work management tools through modular components. The company targets a wide range of sectors including marketing, CRM, and project management, serving organizations internationally. Founded in 2012, monday.com emphasizes flexibility and visual work organization, with a current market cap of $6.5B, marking its presence in the software applications space.
Key similarities and differences
Both companies operate in the software application sector, focusing on work management and collaboration solutions designed for businesses and teams. Atlassian’s portfolio is broader, covering enterprise-grade tools and security features, while monday.com prioritizes a modular, visual approach to customizable workflows. Atlassian has a significantly larger market cap and workforce compared to monday.com, reflecting differing scales and market penetration strategies.
Income Statement Comparison
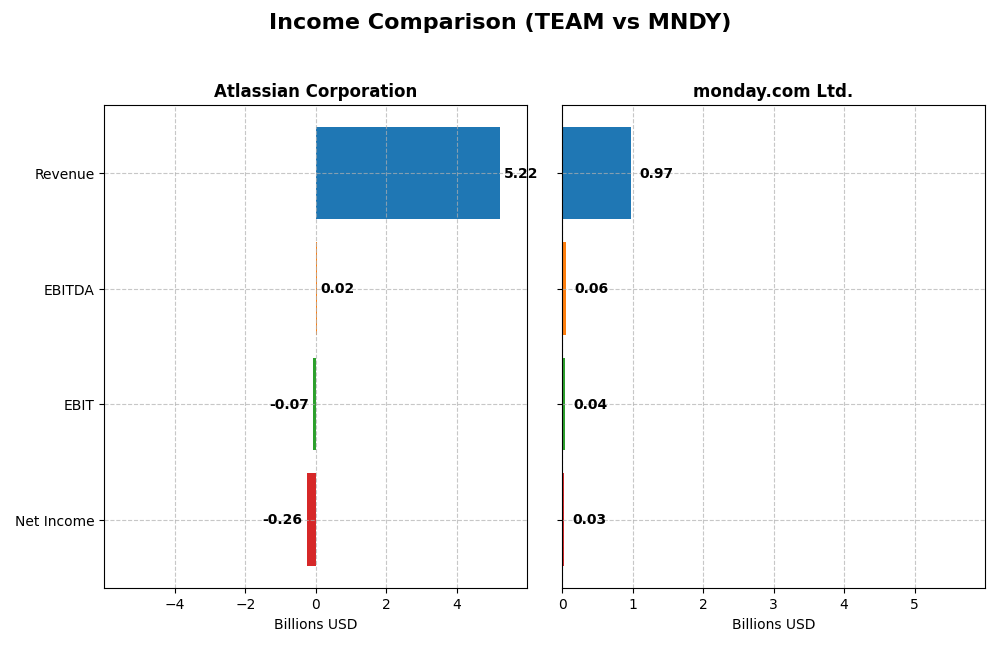
The table below compares key income statement metrics for Atlassian Corporation and monday.com Ltd. based on their most recent fiscal year data.
| Metric | Atlassian Corporation | monday.com Ltd. |
|---|---|---|
| Market Cap | 31.1B | 6.5B |
| Revenue | 5.22B | 972M |
| EBITDA | 24M | 58M |
| EBIT | -68M | 40M |
| Net Income | -257M | 32M |
| EPS | -0.98 | 0.65 |
| Fiscal Year | 2025 | 2024 |
Income Statement Interpretations
Atlassian Corporation
Atlassian’s revenue grew significantly from 2.1B in 2021 to 5.2B in 2025, with net income losses narrowing from -579M to -257M over the same period. Gross margins remained strong at 82.8%, despite persistent negative EBIT and net margins. The 2025 fiscal year showed 19.7% revenue growth and a 28.6% improvement in net margin, signaling a gradual margin recovery amid ongoing operating losses.
monday.com Ltd.
monday.com demonstrated robust revenue growth, rising from 161M in 2020 to 972M in 2024, with net income turning positive at 32M in 2024 after several years of losses. Gross margin was high at 89.3%, with EBIT and net margins improving to slightly positive levels. The latest year reflected a 33.2% revenue increase and substantial gains in EBIT and net margin, indicating accelerating profitability.
Which one has the stronger fundamentals?
Both companies show favorable income growth and strong gross margins, but monday.com exhibits a clearer path to profitability with positive EBIT and net margins in 2024. Atlassian, while growing faster in absolute revenue, continues to report operating losses and negative margins. Thus, monday.com currently presents stronger fundamental income statement improvements, whereas Atlassian retains scale but with ongoing profitability challenges.
Financial Ratios Comparison
The table below presents a side-by-side comparison of key financial ratios for Atlassian Corporation (TEAM) and monday.com Ltd. (MNDY) based on their most recent fiscal year data.
| Ratios | Atlassian Corporation (TEAM) FY 2025 | monday.com Ltd. (MNDY) FY 2024 |
|---|---|---|
| ROE | -19.1% | 3.14% |
| ROIC | -4.48% | -1.73% |
| P/E | -207.1 | 363.0 |
| P/B | 39.5 | 11.4 |
| Current Ratio | 1.22 | 2.66 |
| Quick Ratio | 1.22 | 2.66 |
| D/E | 0.92 | 0.10 |
| Debt-to-Assets | 20.5% | 6.3% |
| Interest Coverage | -4.27 | 0 |
| Asset Turnover | 0.86 | 0.58 |
| Fixed Asset Turnover | 19.0 | 7.13 |
| Payout Ratio | 0 | 0 |
| Dividend Yield | 0 | 0 |
Interpretation of the Ratios
Atlassian Corporation
Atlassian’s financial ratios present a mixed picture with several unfavorable metrics such as negative net margin (-4.92%) and return on equity (-19.08%), indicating profitability challenges. However, its quick ratio (1.22) and debt to assets (20.51%) are favorable, suggesting decent liquidity and moderate leverage. The company does not pay dividends, likely retaining earnings to fund growth and R&D, consistent with its high research and development expenses.
monday.com Ltd.
Monday.com shows a neutral overall ratio profile with some favorable liquidity ratios, such as a current and quick ratio both at 2.66, and very low debt-to-equity (0.1). Yet, it faces profitability issues, with an unfavorable net margin of 3.33% and a high P/E ratio of 362.98, reflecting market expectations amid limited earnings. The company does not distribute dividends, probably focusing on reinvestment and expansion.
Which one has the best ratios?
Comparing the two, monday.com holds a neutral stance with better liquidity and interest coverage ratios, while Atlassian’s ratios skew slightly unfavorable due to negative profitability and return measures. Both companies lack dividend payments, emphasizing growth strategies. Overall, monday.com’s stronger liquidity and lower leverage offer a relatively more balanced ratio profile.
Strategic Positioning
This section compares the strategic positioning of Atlassian Corporation and monday.com Ltd., including their market position, key segments, and exposure to technological disruption:
Atlassian Corporation
- Large market cap (~31B USD) with established presence in software application; faces competitive pressure in tech.
- Diverse product portfolio including project management, collaboration, code development, and security software.
- Provides a wide range of integrated software products, potentially reducing disruption risk.
monday.com Ltd.
- Smaller market cap (~6.5B USD) in software application industry; competes with larger firms and startups.
- Focused on cloud-based visual Work OS and modular tools for marketing, CRM, project management, and software dev.
- Offers modular, cloud-based solutions with flexibility to adapt to evolving work management trends.
Atlassian Corporation vs monday.com Ltd. Positioning
Atlassian pursues a diversified approach with multiple software products spanning collaboration, project management, and security, while monday.com concentrates on a modular cloud-based Work OS focused on work management and CRM. Atlassian’s breadth offers market coverage; monday.com’s focus allows agility but with narrower scope.
Which has the best competitive advantage?
Both companies are currently shedding value as ROIC is below WACC. Atlassian has a very unfavorable moat with declining profitability, whereas monday.com shows slightly unfavorable moat but improving ROIC, indicating a potential for strengthening competitive advantage.
Stock Comparison
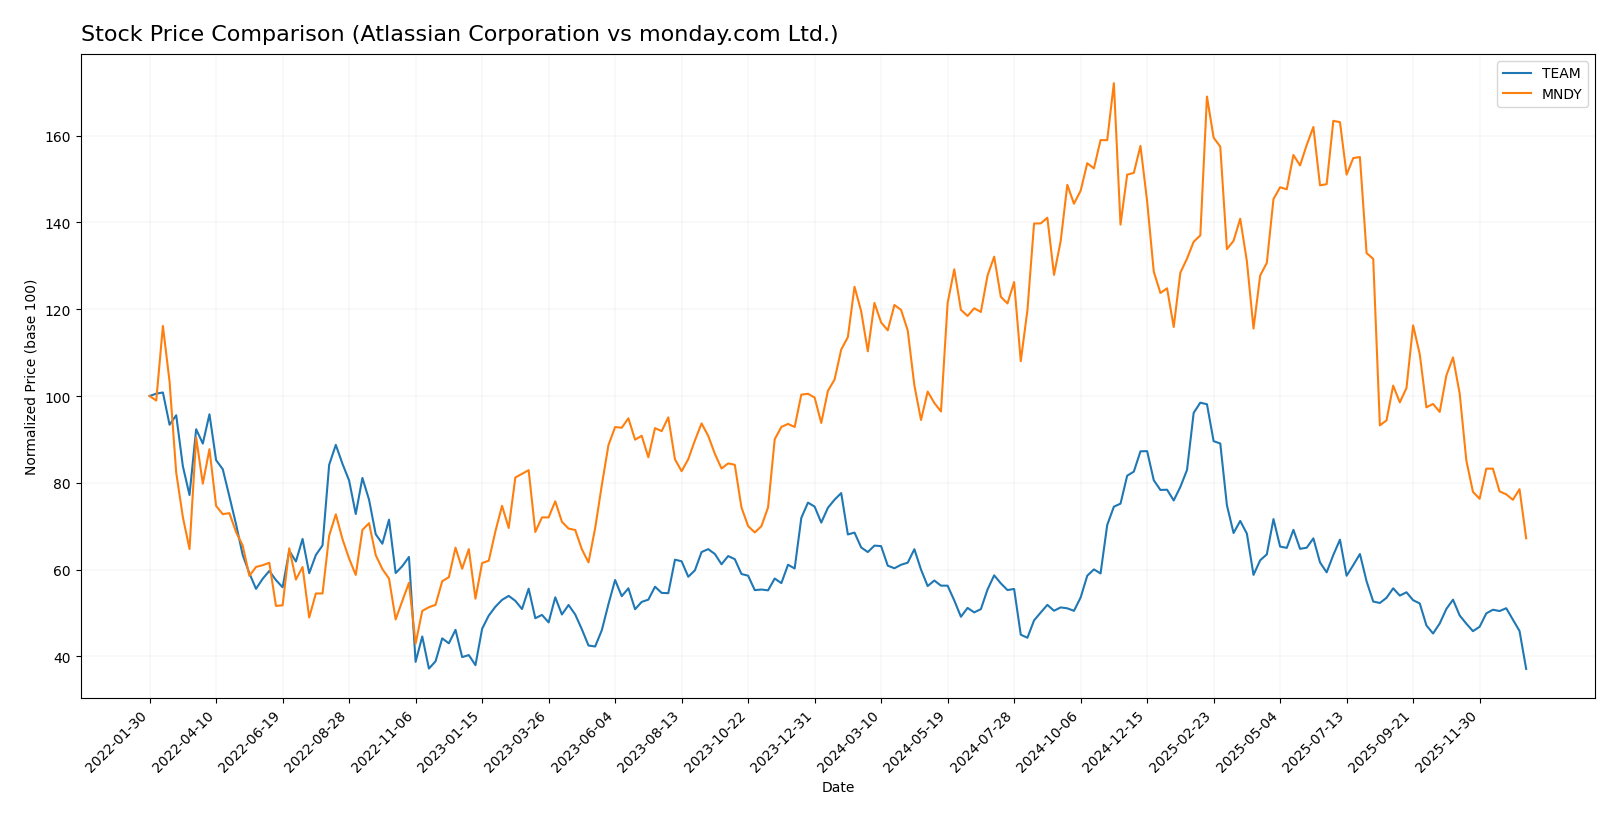
The stock price movements of Atlassian Corporation (TEAM) and monday.com Ltd. (MNDY) over the past year reveal significant declines, with both showing bearish trends and decelerating price reductions amid varying trading volumes.
Trend Analysis
Atlassian Corporation’s stock declined by 42.01% over the past year, confirming a bearish trend with deceleration in losses. The price ranged from a high of 314.28 to a low of 118.55, showing notable volatility with a standard deviation of 41.22.
monday.com Ltd.’s stock also fell sharply by 39.06%, indicating a bearish trend with decelerating declines. The stock price fluctuated between 324.31 and 126.7, exhibiting higher volatility, marked by a standard deviation of 47.32.
Comparing the two, Atlassian’s stock delivered a slightly larger negative return over the past year than monday.com’s. Both experienced bearish trends with deceleration, but monday.com’s higher volatility and lower absolute loss suggest marginally better relative market performance.
Target Prices
The current analyst consensus reveals promising upside potential for both Atlassian Corporation and monday.com Ltd.
| Company | Target High | Target Low | Consensus |
|---|---|---|---|
| Atlassian Corporation | 290 | 185 | 234.14 |
| monday.com Ltd. | 330 | 194 | 264.42 |
Analysts expect significant growth for both stocks, with consensus targets well above current prices: Atlassian at $118.55 and monday.com at $126.7, signaling potential appreciation.
Analyst Opinions Comparison
This section compares analysts’ ratings and grades for Atlassian Corporation and monday.com Ltd.:
Rating Comparison
Atlassian Corporation Rating
- Rating: C, considered very favorable overall by analysts.
- Discounted Cash Flow Score: 5, rated very favorable indicating undervaluation potential.
- ROE Score: 1, very unfavorable, indicating low efficiency in generating profit from equity.
- ROA Score: 1, very unfavorable, reflecting poor asset utilization.
- Debt To Equity Score: 1, very unfavorable, indicating higher financial risk.
- Overall Score: 2, moderate financial standing.
monday.com Ltd. Rating
- Rating: B-, considered very favorable overall by analysts.
- Discounted Cash Flow Score: 4, rated favorable suggesting good valuation.
- ROE Score: 3, moderate rating showing better profitability efficiency.
- ROA Score: 3, moderate rating showing better asset utilization.
- Debt To Equity Score: 3, moderate rating reflecting lower financial risk.
- Overall Score: 3, moderate but higher financial standing than competitor.
Which one is the best rated?
Based strictly on the provided data, monday.com Ltd. holds a better overall rating (B-) and scores higher across ROE, ROA, debt-to-equity, and overall financial standing, while Atlassian excels only in discounted cash flow score.
Scores Comparison
The following table compares the financial health scores of Atlassian Corporation and monday.com Ltd.:
TEAM Scores
- Altman Z-Score: 4.70, in the safe zone, low bankruptcy risk.
- Piotroski Score: 5, indicating average financial strength.
MNDY Scores
- Altman Z-Score: 6.33, in the safe zone, very low bankruptcy risk.
- Piotroski Score: 5, indicating average financial strength.
Which company has the best scores?
Both Atlassian and monday.com are in the safe zone for Altman Z-Score, but monday.com has a higher Z-Score, indicating stronger financial stability. Both have identical average Piotroski Scores of 5.
Grades Comparison
Here is a comparison of the latest reliable grades from recognized grading companies for both Atlassian Corporation and monday.com Ltd.:
Atlassian Corporation Grades
The following table summarizes recent analyst grades for Atlassian Corporation:
| Grading Company | Action | New Grade | Date |
|---|---|---|---|
| BTIG | Maintain | Buy | 2026-01-13 |
| Piper Sandler | Maintain | Overweight | 2026-01-05 |
| Bernstein | Maintain | Outperform | 2025-11-18 |
| Macquarie | Maintain | Outperform | 2025-11-03 |
| Mizuho | Maintain | Outperform | 2025-10-31 |
| Bernstein | Maintain | Outperform | 2025-10-31 |
| TD Cowen | Maintain | Hold | 2025-10-27 |
| BMO Capital | Maintain | Outperform | 2025-10-24 |
| UBS | Maintain | Neutral | 2025-10-24 |
| Keybanc | Maintain | Overweight | 2025-10-23 |
Overall, Atlassian’s grades predominantly range from Hold to Outperform, indicating a generally positive but varied analyst outlook.
monday.com Ltd. Grades
The following table summarizes recent analyst grades for monday.com Ltd.:
| Grading Company | Action | New Grade | Date |
|---|---|---|---|
| BTIG | Maintain | Buy | 2026-01-15 |
| Barclays | Maintain | Overweight | 2026-01-12 |
| Jefferies | Maintain | Buy | 2026-01-05 |
| Citigroup | Maintain | Buy | 2025-12-23 |
| Tigress Financial | Maintain | Buy | 2025-12-11 |
| Baird | Maintain | Outperform | 2025-11-11 |
| Wells Fargo | Maintain | Overweight | 2025-11-11 |
| DA Davidson | Maintain | Buy | 2025-11-11 |
| Morgan Stanley | Maintain | Overweight | 2025-11-11 |
| Piper Sandler | Maintain | Overweight | 2025-11-11 |
monday.com’s grades show a strong consensus toward Buy and Overweight ratings, reflecting a consistently optimistic analyst perspective.
Which company has the best grades?
Both Atlassian Corporation and monday.com Ltd. have a consensus rating of “Buy,” but monday.com exhibits a higher proportion of Buy and Overweight grades, signaling stronger analyst confidence. This could influence investors seeking growth potential based on analyst sentiment.
Strengths and Weaknesses
Below is a comparative overview of key strengths and weaknesses for Atlassian Corporation (TEAM) and monday.com Ltd. (MNDY) based on the most recent financial data and market assessments:
| Criterion | Atlassian Corporation (TEAM) | monday.com Ltd. (MNDY) |
|---|---|---|
| Diversification | Moderate product range with License and Service revenue of 4.93B USD in 2025 | Limited diversification, primarily software platform-focused |
| Profitability | Negative net margin (-4.92%) and ROIC (-4.48%); value destroying | Slightly positive net margin (3.33%) but negative ROIC (-1.73%); improving profitability |
| Innovation | Strong innovation with diversified SaaS offerings and high fixed asset turnover (19.02) | Growing innovation reflected in rising ROIC trend and favorable asset turnover (7.13) |
| Global presence | Established global footprint with strong market presence | Smaller but expanding global reach |
| Market Share | High market share in collaboration software, but profitability concerns | Smaller market share, rapidly growing user base |
Key takeaways: Atlassian shows strong product diversification and market presence but struggles with profitability and value creation. monday.com demonstrates improving profitability and innovation trends but remains less diversified and smaller in scale. Both present investment risks, requiring cautious consideration.
Risk Analysis
Below is a comparative overview of key risks for Atlassian Corporation (TEAM) and monday.com Ltd. (MNDY) based on the most recent data from 2025 and 2024 respectively:
| Metric | Atlassian Corporation (TEAM) | monday.com Ltd. (MNDY) |
|---|---|---|
| Market Risk | Beta 0.888, moderate volatility | Beta 1.255, higher volatility |
| Debt level | Debt-to-Equity 0.92 (neutral), Debt-to-Assets 20.51% (favorable) | Debt-to-Equity 0.1 (favorable), Debt-to-Assets 6.29% (favorable) |
| Regulatory Risk | Moderate due to global operations, especially in Australia and US | Moderate, with exposure in Israel and international markets |
| Operational Risk | Large employee base (12K+), complex product suite | Smaller workforce (~2.5K), rapidly evolving platform |
| Environmental Risk | Limited direct impact, standard tech industry footprint | Similar low impact, but growing pressure on sustainability in tech |
| Geopolitical Risk | Exposure to US-Australia trade and tech policies | Exposure to Middle East geopolitical tensions and global markets |
The most significant risks are market volatility for monday.com given its higher beta and operational complexity for Atlassian due to its extensive product portfolio and larger size. Atlassian’s higher debt level and negative profitability ratios also increase financial risk, while monday.com benefits from a stronger balance sheet but faces valuation concerns with high P/E ratios. Both companies operate in regulated environments with moderate exposure to geopolitical uncertainties.
Which Stock to Choose?
Atlassian Corporation (TEAM) shows favorable income growth with a 19.66% revenue increase in 2025 and strong gross margin of 82.84%, yet suffers from negative profitability metrics, including a -19.08% ROE and unfavorable net margin at -4.92%. Its debt profile is moderate with a 20.51% debt-to-assets ratio, but its overall financial ratios are slightly unfavorable, complemented by a very favorable rating of C.
monday.com Ltd. (MNDY) delivers robust revenue growth of 33.21% in 2024 and a high gross margin of 89.33%, with positive though modest profitability indicators such as a 3.14% ROE and a neutral net margin of 3.33%. The company maintains a low debt burden (6.29% debt-to-assets), favorable liquidity ratios, and a neutral overall financial ratios evaluation, supported by a very favorable B- rating.
Considering ratings and income statements, TEAM’s financials might appeal to investors tolerating higher risk given its strong income growth but unfavorable profitability and slightly unfavorable ratios. Conversely, MNDY could be more attractive for those valuing steady improvement and balanced financial health, reflected by its neutral ratios and favorable rating. Investors focused on growth may find both companies compelling, while those prioritizing stability might lean towards MNDY.
Disclaimer: Investment carries a risk of loss of initial capital. The past performance is not a reliable indicator of future results. Be sure to understand risks before making an investment decision.
Go Further
I encourage you to read the complete analyses of Atlassian Corporation and monday.com Ltd. to enhance your investment decisions: