Atlassian Corporation (TEAM) and Match Group, Inc. (MTCH) are two influential players in the software application industry, each driving innovation in distinct yet overlapping digital domains. Atlassian focuses on collaboration and project management tools, while Match Group excels in online dating platforms. This comparison explores their market strategies, growth potential, and innovation to help you identify the most compelling investment opportunity in 2026. Let’s dive into which company deserves a place in your portfolio.
Table of contents
Companies Overview
I will begin the comparison between Atlassian Corporation and Match Group, Inc. by providing an overview of these two companies and their main differences.
Atlassian Corporation Overview
Atlassian Corporation, headquartered in Sydney, Australia, is a technology company specializing in software applications. It designs, develops, licenses, and maintains a diverse portfolio of collaboration and project management tools such as Jira, Confluence, and Trello. Founded in 2002, Atlassian serves global technical and business teams, focusing on improving teamwork, software development, and enterprise agility.
Match Group, Inc. Overview
Match Group, based in Dallas, Texas, provides dating software products worldwide. Its portfolio includes popular brands like Tinder, Match, OkCupid, and Hinge. Founded in 1986, the company operates primarily in the technology sector, focusing on connecting people through its diverse dating platforms. Match Group emphasizes offering a broad range of dating experiences to various demographics across the globe.
Key similarities and differences
Both companies operate in the software application industry within the technology sector and are listed on NASDAQ. Atlassian focuses on collaboration and enterprise software solutions, targeting business and development teams, while Match Group specializes in consumer-oriented dating products. Atlassian has a significantly larger workforce and market capitalization, reflecting its broader software portfolio and business focus compared to Match Group’s niche market in online dating.
Income Statement Comparison
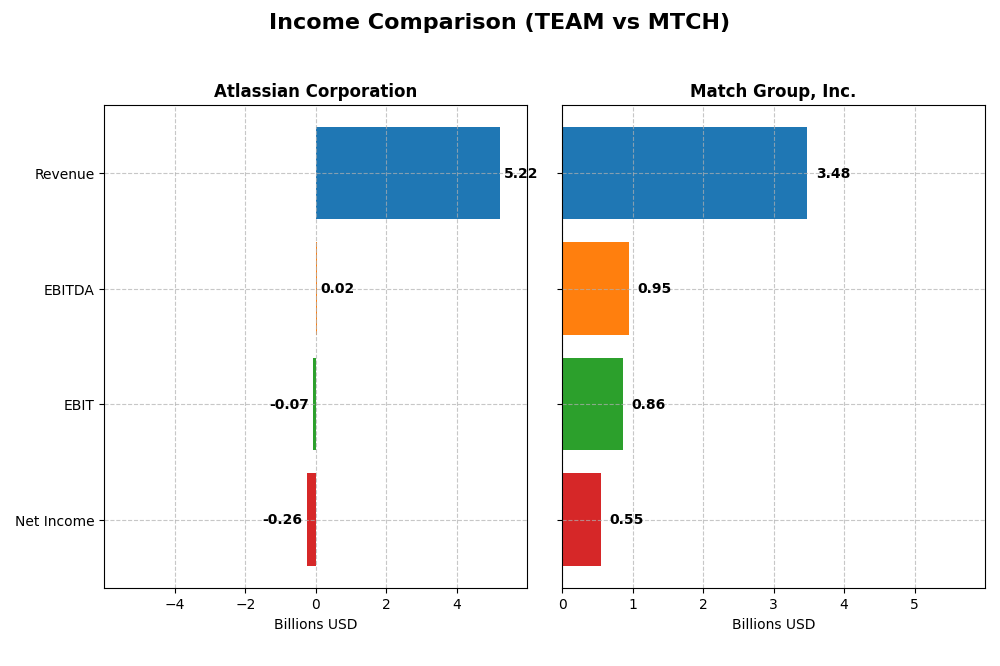
This table compares the most recent fiscal year income statement figures for Atlassian Corporation and Match Group, Inc., highlighting key metrics relevant to investors.
| Metric | Atlassian Corporation (TEAM) | Match Group, Inc. (MTCH) |
|---|---|---|
| Market Cap | 31.1B | 7.4B |
| Revenue | 5.22B | 3.48B |
| EBITDA | 24M | 952M |
| EBIT | -68M | 864M |
| Net Income | -257M | 551M |
| EPS | -0.98 | 2.12 |
| Fiscal Year | 2025 | 2024 |
Income Statement Interpretations
Atlassian Corporation
Atlassian’s revenue grew substantially from $2.1B in 2021 to $5.2B in 2025, with net losses narrowing from -$579M to -$257M. Gross margins remained strong around 83%, but EBIT margins stayed negative, reflecting ongoing high operating expenses. The latest year showed solid revenue growth of 19.7% and improved net margin by 28.6%, despite a 33% EBIT decline.
Match Group, Inc.
Match Group experienced steady revenue growth from $2.4B in 2020 to $3.5B in 2024, with net income rising significantly to $551M. Gross margin was favorable at 71.5%, supported by a strong EBIT margin of 24.8%. However, recent growth slowed, with revenue up only 3.4%, accompanied by declines in EBIT and net margin by 7.7% and 18.2%, respectively.
Which one has the stronger fundamentals?
Both companies show favorable overall income statement evaluations, but Atlassian leads with higher revenue growth and improving net margins despite persistent losses. Match Group demonstrates profitability with solid margins but slower recent growth and margin contraction. The choice depends on preference for growth potential versus current profitability, reflecting differing risk and performance profiles.
Financial Ratios Comparison
The table below presents a side-by-side comparison of key financial ratios for Atlassian Corporation (TEAM) and Match Group, Inc. (MTCH) based on their most recent fiscal year data.
| Ratios | Atlassian Corporation (TEAM) FY 2025 | Match Group, Inc. (MTCH) FY 2024 |
|---|---|---|
| ROE | -19.08% | -865.98% |
| ROIC | -4.48% | 16.38% |
| P/E | -207.1 | 15.44 |
| P/B | 39.51 | -133.75 |
| Current Ratio | 1.22 | 2.54 |
| Quick Ratio | 1.22 | 2.54 |
| D/E (Debt to Equity) | 0.92 | -62.09 |
| Debt-to-Assets | 20.5% | 88.5% |
| Interest Coverage | -4.27 | 5.14 |
| Asset Turnover | 0.86 | 0.78 |
| Fixed Asset Turnover | 19.02 | 22.00 |
| Payout Ratio | 0% | 0% |
| Dividend Yield | 0% | 0% |
Interpretation of the Ratios
Atlassian Corporation
Atlassian shows several unfavorable profitability ratios, including a negative net margin of -4.92% and a return on equity of -19.08%, signaling operational challenges. Its balance sheet metrics are mixed, with a favorable debt-to-assets ratio of 20.51% but a concerning negative interest coverage. The company does not pay dividends, reflecting a likely reinvestment strategy in its high R&D expenses.
Match Group, Inc.
Match Group presents strong operational ratios with a favorable net margin of 15.84% and a solid return on invested capital at 16.38%. Its liquidity ratios are robust, supported by a current ratio of 2.54. However, the company faces a high debt-to-assets ratio of 88.51%, which is unfavorable. It pays dividends, but the yield is zero, indicating limited shareholder payouts despite positive cash flows.
Which one has the best ratios?
Match Group’s ratios are generally more favorable, highlighting better profitability and liquidity compared to Atlassian. Despite its high leverage, Match Group maintains stronger coverage and operating efficiency. Atlassian’s unfavorable profitability and coverage ratios weigh on its profile, resulting in a slightly unfavorable overall evaluation versus Match Group’s favorable stance.
Strategic Positioning
This section compares the strategic positioning of Atlassian Corporation and Match Group, Inc. in terms of market position, key segments, and exposure to technological disruption:
Atlassian Corporation
- Leading software application provider with a 31B market cap, facing moderate competitive pressure.
- Diverse software portfolio including project management, collaboration, developer tools, and service management.
- Exposure centered on software innovation and cloud product security enhancements.
Match Group, Inc.
- Focused dating product provider with a 7.4B market cap, operating in a competitive niche.
- Concentrated on dating platforms with brands like Tinder, Match, and OkCupid driving revenue.
- Technological disruption risk linked to evolving online dating trends and platform innovation.
Atlassian Corporation vs Match Group, Inc. Positioning
Atlassian’s diversified software product range supports multiple business functions, providing broad market reach but complex management. Match Group’s concentrated dating platform focus offers specialization but higher dependency on consumer trends and brand performance.
Which has the best competitive advantage?
Match Group demonstrates a slightly favorable moat with ROIC above WACC indicating value creation despite declining profitability. Atlassian shows a very unfavorable moat with declining ROIC and value destruction, suggesting weaker competitive advantage.
Stock Comparison
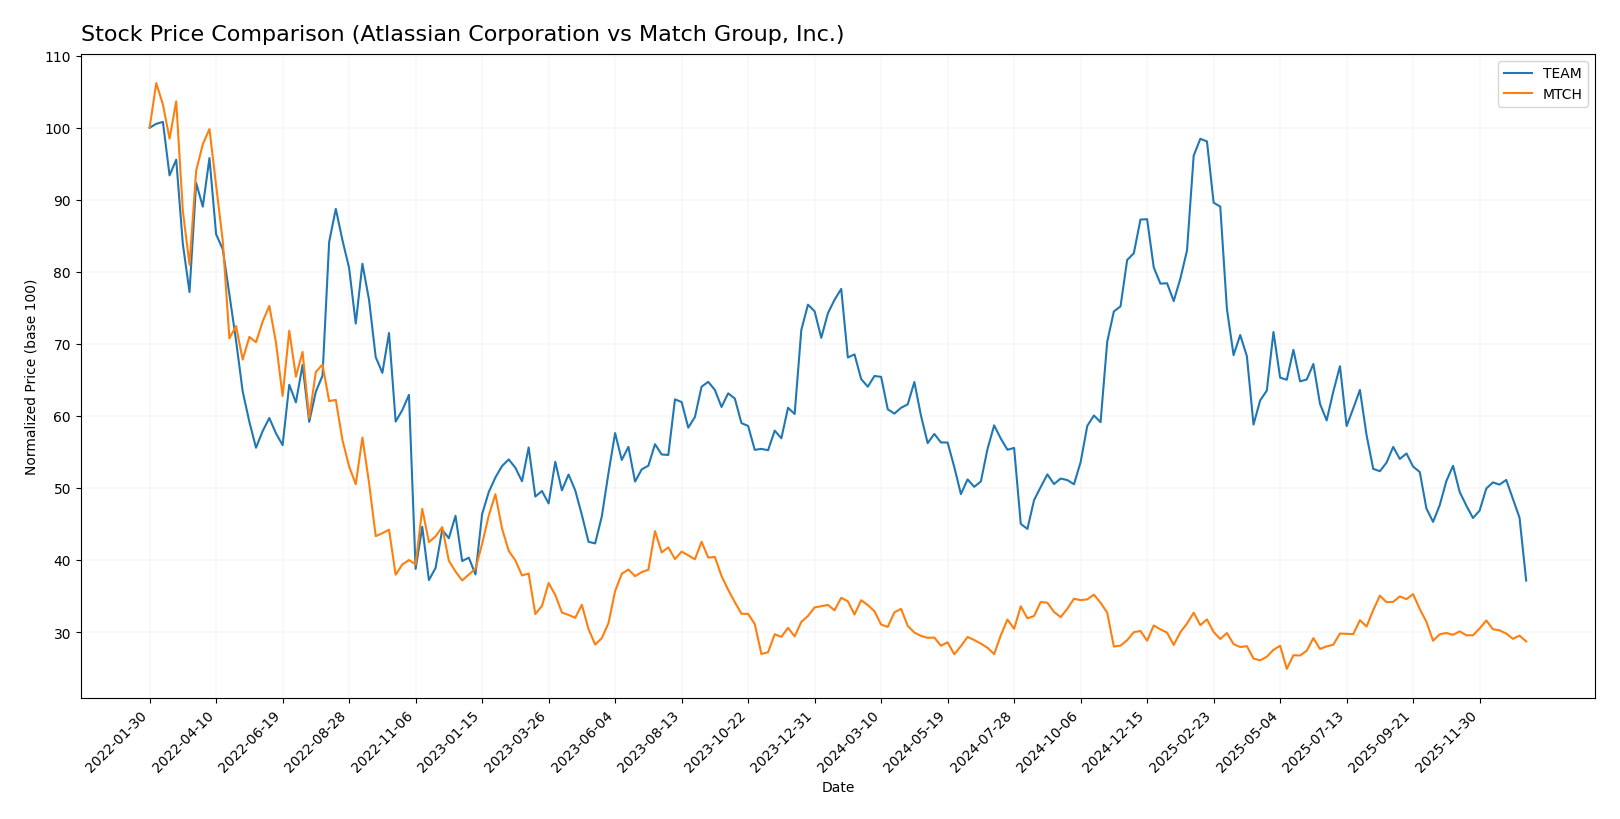
The stock price movements of Atlassian Corporation (TEAM) and Match Group, Inc. (MTCH) over the past 12 months reveal significant bearish trends with notable declines and decelerating momentum, highlighting contrasting volatility levels and trading volumes.
Trend Analysis
Atlassian Corporation’s stock declined by 42.01% over the past year, reflecting a bearish trend with decelerating momentum. The stock showed high volatility, with prices ranging from 314.28 to 118.55 and a standard deviation of 41.22.
Match Group, Inc.’s stock fell by 14.98% over the same period, also bearish with deceleration. Its price fluctuated between 38.51 and 27.18, exhibiting lower volatility with a standard deviation of 2.64.
Comparing the two, Atlassian’s stock delivered the lowest market performance, with a much steeper decline than Match Group, which experienced a more moderate decrease.
Target Prices
The current analyst consensus presents clear target price ranges for Atlassian Corporation and Match Group, Inc.
| Company | Target High | Target Low | Consensus |
|---|---|---|---|
| Atlassian Corporation | 290 | 185 | 234.14 |
| Match Group, Inc. | 43 | 33 | 36.29 |
Analysts expect significant upside for Atlassian, with a consensus target nearly double the current price of $118.55. Match Group’s consensus target at $36.29 also suggests moderate growth above its current $31.34 trading price.
Analyst Opinions Comparison
This section compares analysts’ ratings and grades for Atlassian Corporation and Match Group, Inc.:
Rating Comparison
Atlassian Corporation Rating
- Rating: C, indicating a very favorable overall standing.
- Discounted Cash Flow Score: 5, showing very favorable future cash flow projections.
- ROE Score: 1, reflecting very unfavorable efficiency in generating profit from equity.
- ROA Score: 1, indicating very unfavorable asset utilization.
- Debt To Equity Score: 1, showing very unfavorable financial risk due to debt levels.
- Overall Score: 2, categorized as moderate financial standing.
Match Group Rating
- Rating: B, indicating a very favorable overall standing.
- Discounted Cash Flow Score: 5, showing very favorable future cash flow projections.
- ROE Score: 1, reflecting very unfavorable efficiency in generating profit from equity.
- ROA Score: 5, indicating very favorable asset utilization.
- Debt To Equity Score: 1, showing very unfavorable financial risk due to debt levels.
- Overall Score: 3, categorized as moderate financial standing.
Which one is the best rated?
Match Group holds a higher rating (B) and a better overall score (3) compared to Atlassian’s rating (C) and overall score (2). Match Group also scores significantly better in return on assets, while both share low scores in return on equity and debt to equity.
Scores Comparison
Here is a comparison of the Altman Z-Score and Piotroski Score for Atlassian Corporation and Match Group, Inc.:
TEAM Scores
- Altman Z-Score: 4.70, safe zone indicating low bankruptcy risk.
- Piotroski Score: 5, average financial strength.
MTCH Scores
- Altman Z-Score: 0.52, distress zone indicating high bankruptcy risk.
- Piotroski Score: 8, very strong financial strength.
Which company has the best scores?
Match Group shows a much stronger Piotroski Score at 8 versus Atlassian’s 5, suggesting better financial health. However, Atlassian’s Altman Z-Score is 4.70 in the safe zone, while Match Group’s is low at 0.52, indicating higher bankruptcy risk.
Grades Comparison
Here is a comparison of the latest verified grades for Atlassian Corporation and Match Group, Inc.:
Atlassian Corporation Grades
The following table shows recent grades assigned by reputable financial firms for Atlassian Corporation:
| Grading Company | Action | New Grade | Date |
|---|---|---|---|
| BTIG | Maintain | Buy | 2026-01-13 |
| Piper Sandler | Maintain | Overweight | 2026-01-05 |
| Bernstein | Maintain | Outperform | 2025-11-18 |
| Macquarie | Maintain | Outperform | 2025-11-03 |
| Mizuho | Maintain | Outperform | 2025-10-31 |
| Bernstein | Maintain | Outperform | 2025-10-31 |
| TD Cowen | Maintain | Hold | 2025-10-27 |
| BMO Capital | Maintain | Outperform | 2025-10-24 |
| UBS | Maintain | Neutral | 2025-10-24 |
| Keybanc | Maintain | Overweight | 2025-10-23 |
Atlassian’s grades predominantly indicate a positive outlook with multiple “Outperform” and “Buy” ratings, and no downgrades.
Match Group, Inc. Grades
The table below summarizes verified recent grades for Match Group, Inc.:
| Grading Company | Action | New Grade | Date |
|---|---|---|---|
| Morgan Stanley | Maintain | Equal Weight | 2026-01-13 |
| Truist Securities | Maintain | Hold | 2025-11-05 |
| Evercore ISI Group | Maintain | In Line | 2025-11-05 |
| Wells Fargo | Maintain | Equal Weight | 2025-11-05 |
| Morgan Stanley | Maintain | Equal Weight | 2025-10-20 |
| Susquehanna | Maintain | Positive | 2025-08-07 |
| Evercore ISI Group | Maintain | In Line | 2025-08-06 |
| JP Morgan | Maintain | Neutral | 2025-08-06 |
| UBS | Maintain | Neutral | 2025-07-23 |
| Wells Fargo | Maintain | Equal Weight | 2025-06-27 |
Match Group’s grades mostly reflect a neutral to moderate stance, with “Equal Weight,” “Hold,” and “Neutral” ratings dominating.
Which company has the best grades?
Atlassian Corporation has received notably stronger grades than Match Group, with several “Outperform” and “Buy” ratings versus Match’s largely neutral “Equal Weight” and “Hold” grades. This difference may influence investors’ perception of growth potential and risk profiles.
Strengths and Weaknesses
Below is a comparative overview of key strengths and weaknesses for Atlassian Corporation (TEAM) and Match Group, Inc. (MTCH) based on the most recent data available.
| Criterion | Atlassian Corporation (TEAM) | Match Group, Inc. (MTCH) |
|---|---|---|
| Diversification | Moderate product/service mix; heavy reliance on License and Service (~$4.93B in 2025) with limited other revenue streams | Focused on dating and related services with substantial revenue (~$2.35B in 2020), less diversified |
| Profitability | Negative net margin (-4.92%) and ROIC (-4.48%); value destroying with declining profitability | Positive net margin (15.84%) and ROIC (16.38%); creating value despite some ROIC decline |
| Innovation | Strong product turnover (fixed asset turnover 19.02 suggests efficient asset use); but declining ROIC signals innovation challenges | High fixed asset turnover (22.0) and positive profitability indicate ongoing innovation and operational efficiency |
| Global presence | Global SaaS provider with increasing License and Service revenue, but financial struggles limit expansion capabilities | Global dating platform with strong market penetration, but high debt-to-assets ratio (88.51%) poses risk |
| Market Share | Competitive in collaboration software but losing value; unfavorable price-to-book (39.51) suggests market overvaluation | Strong market share in dating services; favorable price-to-book (-133.75) and price-to-earnings (15.44) ratios |
Key takeaways: Match Group exhibits stronger profitability, value creation, and operational efficiency, albeit with high leverage risks. Atlassian shows solid revenue growth but struggles with profitability and value destruction, signaling caution for investors.
Risk Analysis
Below is a comparative table summarizing the key risk metrics for Atlassian Corporation (TEAM) and Match Group, Inc. (MTCH) based on the most recent data available:
| Metric | Atlassian Corporation (TEAM) | Match Group, Inc. (MTCH) |
|---|---|---|
| Market Risk | Beta 0.89 (moderate volatility) | Beta 1.33 (higher volatility) |
| Debt level | Debt-to-Equity 0.92 (neutral) | Debt-to-Equity -62.09 (unusual negative, likely accounting specifics), Debt-to-Assets 88.51% (high leverage) |
| Regulatory Risk | Moderate (technology sector, global data privacy regulations) | Elevated (online dating sector, subject to changing privacy and content regulations) |
| Operational Risk | Medium (complex software product suite, global operations) | Medium-High (dependency on user engagement and brand reputation) |
| Environmental Risk | Low (software industry, minimal direct environmental impact) | Low (digital services, limited direct environmental footprint) |
| Geopolitical Risk | Moderate (headquartered in Australia with global reach) | Moderate (US-based, global user base, subject to geopolitical tensions affecting international markets) |
The most impactful risks are Match Group’s high leverage and regulatory exposure in a sensitive market, which could affect financial stability and growth. Atlassian’s risks stem mainly from operational complexity and moderate market volatility; however, its strong Altman Z-Score (4.7, safe zone) suggests manageable financial risk. Match Group’s Altman Z-Score (0.52, distress zone) signals elevated bankruptcy risk despite a very strong Piotroski score, highlighting financial distress concerns.
Which Stock to Choose?
Atlassian Corporation (TEAM) shows a favorable income evolution with 19.66% revenue growth in 2025 and a strong gross margin of 82.84%, but profitability ratios like ROE and net margin remain unfavorable. Its debt levels are moderate, with a neutral debt-to-equity ratio and a quick ratio rated favorable. The overall rating is very favorable, tempered by some weak financial ratios and a very unfavorable moat indicating value destruction.
Match Group, Inc. (MTCH) demonstrates a favorable income statement with positive net margin at 15.84% and EBIT margin of 24.84%, supported by solid return on assets and invested capital. Despite a high debt-to-assets ratio rated unfavorable, its liquidity and interest coverage are strong. The rating is very favorable overall, with a slightly favorable moat suggesting value creation despite a declining ROIC trend.
Investors focused on growth may find TEAM’s strong revenue and gross profit momentum attractive despite its profitability challenges, while those prioritizing financial stability and value creation might view MTCH’s favorable income and ratings as more aligned with their strategy. Risk-averse investors could consider MTCH’s stronger financial ratios and safer credit metrics, whereas risk-tolerant investors might see potential in TEAM’s growth metrics despite the unfavorable moat.
Disclaimer: Investment carries a risk of loss of initial capital. The past performance is not a reliable indicator of future results. Be sure to understand risks before making an investment decision.
Go Further
I encourage you to read the complete analyses of Atlassian Corporation and Match Group, Inc. to enhance your investment decisions: