In today’s fast-evolving tech landscape, Intuit Inc. and Atlassian Corporation stand out as leaders in software application solutions. While Intuit focuses on financial management for individuals and businesses, Atlassian excels in collaboration and project management tools. Both companies drive innovation and serve overlapping markets, making them compelling choices for investors. This article will help you decide which stock offers the most promising investment potential in 2026.

Table of contents
Companies Overview
I will begin the comparison between Intuit and Atlassian by providing an overview of these two companies and their main differences.
Intuit Overview
Intuit Inc. focuses on financial management and compliance products for consumers, small businesses, and accounting professionals across the US, Canada, and internationally. It operates four segments, including QuickBooks and TurboTax, offering cloud-based solutions, tax preparation software, payment processing, and personal finance services. Founded in 1983, Intuit is headquartered in Mountain View, California, and has a market cap of $152B.
Atlassian Overview
Atlassian Corporation is a software company specializing in collaboration and project management tools like Jira, Confluence, and Trello. It serves technical and business teams worldwide with products for agile development, service management, and security. Founded in 2002 and based in Sydney, Australia, Atlassian has a market cap of $31B and emphasizes connectivity and workflow optimization for enterprises.
Key similarities and differences
Both Intuit and Atlassian operate in the software application industry focusing on business productivity solutions but target different markets: Intuit centers on financial management and tax services, while Atlassian specializes in project management and team collaboration software. Intuit is larger by market cap and has a longer history, whereas Atlassian offers a broader portfolio of developer and operational tools with a strong emphasis on enterprise agility.
Income Statement Comparison
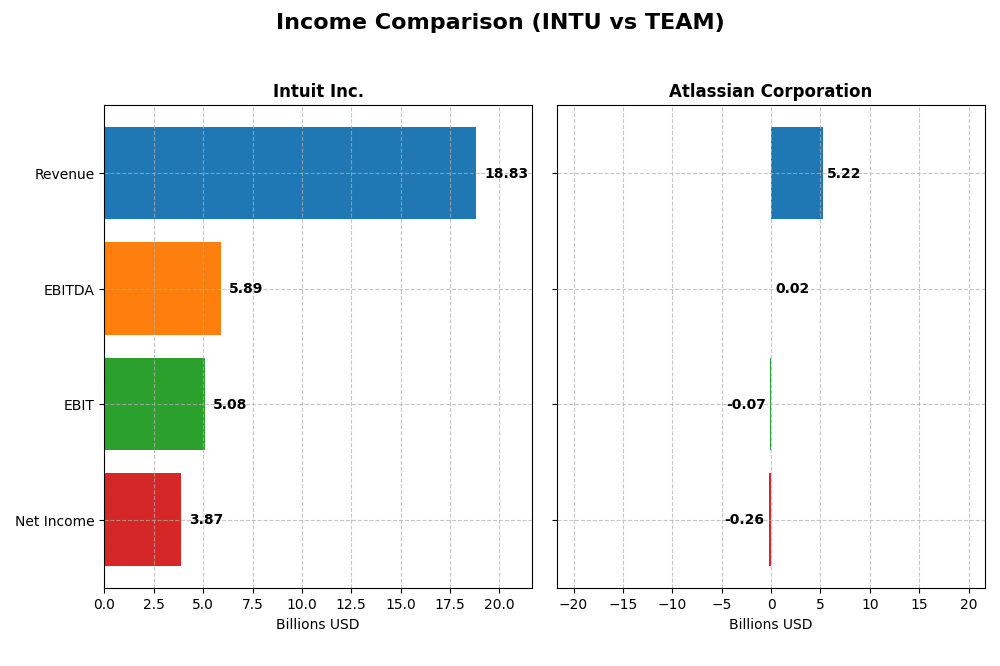
The table below presents a side-by-side comparison of key income statement metrics for Intuit Inc. and Atlassian Corporation for the fiscal year 2025.
| Metric | Intuit Inc. (INTU) | Atlassian Corporation (TEAM) |
|---|---|---|
| Market Cap | 152B | 31.3B |
| Revenue | 18.8B | 5.2B |
| EBITDA | 5.9B | 24M |
| EBIT | 5.1B | -68M |
| Net Income | 3.9B | -257M |
| EPS | 13.82 | -0.98 |
| Fiscal Year | 2025 | 2025 |
Income Statement Interpretations
Intuit Inc.
Intuit’s revenue and net income have shown consistent growth from 2021 to 2025, with revenues rising from $9.63B to $18.83B and net income from $2.06B to $3.87B. Margins remain strong, with gross margin around 80.76% and net margin at 20.55%. The 2025 fiscal year saw a favorable acceleration in EBIT and EPS growth, indicating improved profitability and operational efficiency.
Atlassian Corporation
Atlassian’s revenue increased substantially from $2.09B in 2021 to $5.22B in 2025, with net losses narrowing from -$579M to -$257M. Despite a favorable gross margin of 82.84%, the company reported negative EBIT and net margins, reflecting ongoing profitability challenges. The latest year showed revenue growth of 19.66% and improving net margin, but EBIT declined, signaling margin pressure.
Which one has the stronger fundamentals?
Intuit demonstrates stronger fundamentals with a high percentage of favorable income statement metrics, including solid margins and significant net income growth. Atlassian, while growing revenue rapidly, still faces negative profitability and operational losses, limiting its fundamental strength. Intuit’s consistent net income and margin expansion position it with more stable financial health.
Financial Ratios Comparison
The table below presents the latest available financial ratios for Intuit Inc. and Atlassian Corporation, offering a snapshot of their profitability, liquidity, leverage, efficiency, and shareholder returns.
| Ratios | Intuit Inc. (2025) | Atlassian Corporation (2025) |
|---|---|---|
| ROE | 19.6% | -19.1% |
| ROIC | 14.8% | -4.5% |
| P/E | 56.8 | -207.1 |
| P/B | 11.2 | 39.5 |
| Current Ratio | 1.36 | 1.22 |
| Quick Ratio | 1.36 | 1.22 |
| D/E (Debt-to-Equity) | 0.34 | 0.92 |
| Debt-to-Assets | 18.0% | 20.5% |
| Interest Coverage | 19.9 | -4.3 |
| Asset Turnover | 0.51 | 0.86 |
| Fixed Asset Turnover | 12.5 | 19.0 |
| Payout Ratio | 30.7% | 0% |
| Dividend Yield | 0.54% | 0% |
Interpretation of the Ratios
Intuit Inc.
Intuit shows strong profitability with a favorable net margin of 20.55%, ROE at 19.63%, and ROIC at 14.78%, indicating efficient capital use. Liquidity is adequate with a current ratio of 1.36, and debt levels are well-managed. However, valuation multiples like P/E at 56.82 and P/B at 11.15 appear high. The company pays dividends with a low yield of 0.54%, suggesting cautious shareholder returns.
Atlassian Corporation
Atlassian faces challenges with negative profitability ratios, including a net margin of -4.92% and ROE of -19.08%, reflecting losses and inefficiencies. Liquidity is acceptable but interest coverage is negative, indicating financial stress. The firm does not pay dividends, likely due to reinvestment in growth and R&D, supported by a high research-to-revenue ratio of over 50%.
Which one has the best ratios?
Intuit presents a more favorable ratio profile with strong profitability, solid liquidity, and manageable debt, despite high valuation multiples and modest dividend yield. Atlassian’s ratios reflect operational losses and financial strain, with no dividend payments due to growth prioritization. Overall, Intuit’s ratios are comparatively stronger and more stable.
Strategic Positioning
This section compares the strategic positioning of Intuit Inc. and Atlassian Corporation, including market position, key segments, and exposure to technological disruption:
Intuit Inc.
- Leading financial software provider, faces competitive pressure in fintech and SMB markets.
- Diverse segments: Small Business & Self-Employed, Consumer, Credit Karma, ProConnect tax solutions.
- Moderate exposure through cloud-based financial and payroll solutions, adapting to fintech innovations.
Atlassian Corporation
- Specializes in collaboration and project management software, with competition in SaaS productivity tools.
- Focused on software for teams: Jira, Confluence, Trello, plus enterprise and developer tools.
- Exposed to rapid SaaS and cloud innovation cycles, requiring continuous product evolution.
Intuit Inc. vs Atlassian Corporation Positioning
Intuit has a diversified business model spanning consumer finance, SMB solutions, and tax software, offering multiple revenue streams. Atlassian concentrates on team collaboration and developer tools, which may limit diversification but allows focus on enterprise agility and software innovation.
Which has the best competitive advantage?
Intuit shows a slightly favorable moat with value creation despite declining profitability. Atlassian’s very unfavorable moat indicates value destruction and declining returns, suggesting Intuit currently holds a stronger competitive advantage based on MOAT evaluation.
Stock Comparison
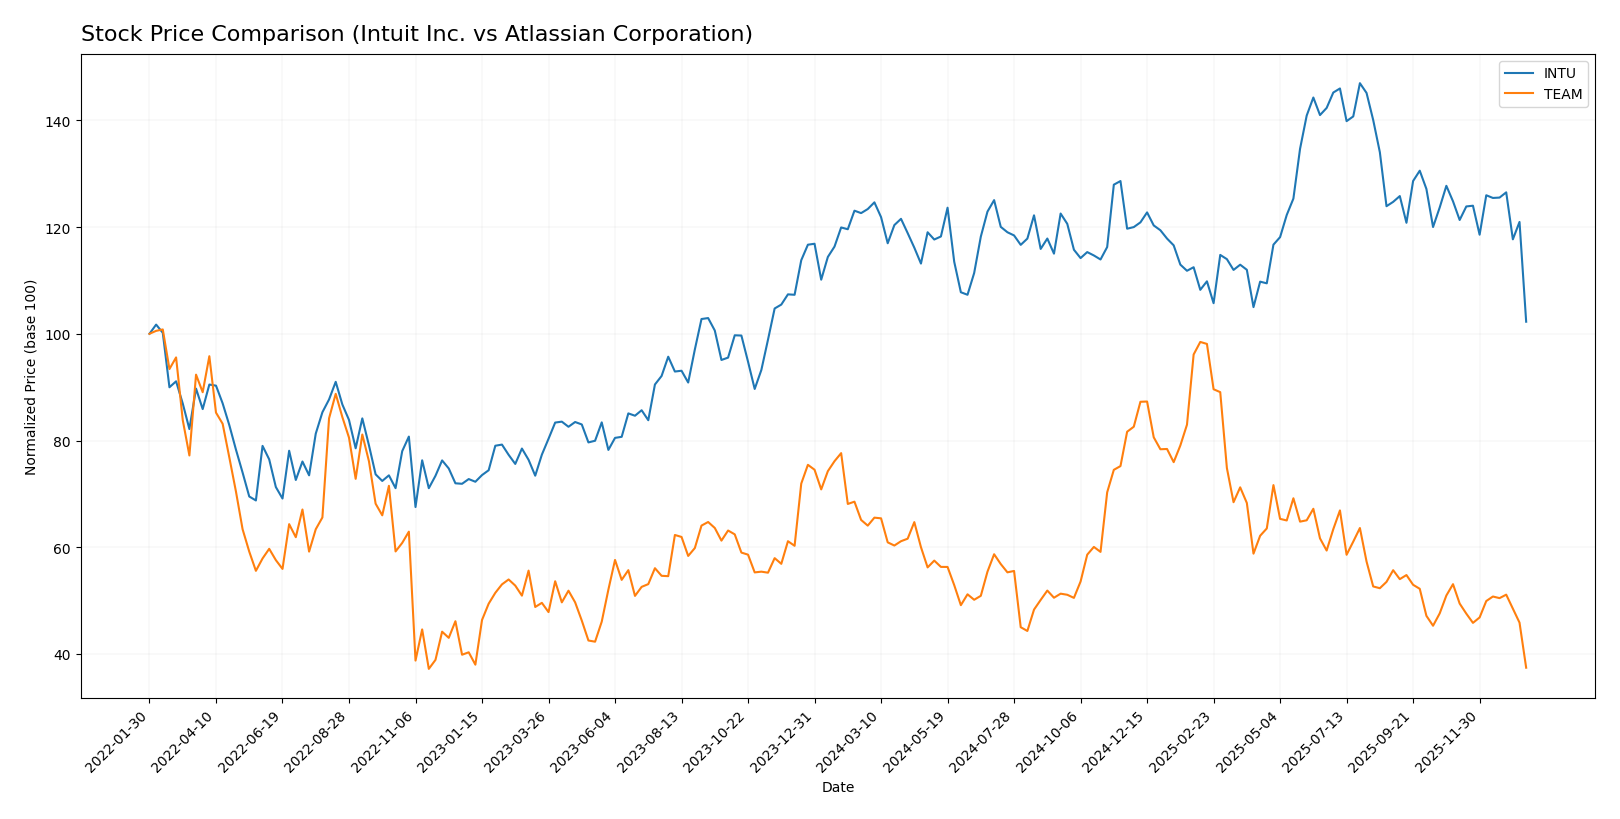
The past year has seen notable bearish trends for both Intuit Inc. and Atlassian Corporation, with significant price declines and decelerating momentum shaping their trading dynamics.
Trend Analysis
Intuit Inc. experienced a 17.11% price decline over the past 12 months, indicating a bearish trend with decelerating downward momentum and a high volatility level as shown by a 51.47 standard deviation.
Atlassian Corporation recorded a steeper 41.57% price decline over the same period, also bearish with deceleration, accompanied by a volatility standard deviation of 41.2, reflecting less price fluctuation than Intuit.
Comparing both, Intuit’s stock outperformed Atlassian’s, delivering a smaller loss and less severe recent price drops, thus showing a relatively better market performance.
Target Prices
The current target price consensus suggests significant upside potential for both Intuit Inc. and Atlassian Corporation.
| Company | Target High | Target Low | Consensus |
|---|---|---|---|
| Intuit Inc. | 880 | 700 | 798.4 |
| Atlassian Corporation | 290 | 185 | 234.14 |
Analysts expect Intuit’s stock to rise substantially from its current price of 546.11 USD, while Atlassian’s target consensus also indicates a strong potential increase from its present 119.25 USD. Both stocks show favorable long-term growth prospects.
Analyst Opinions Comparison
This section compares analysts’ ratings and financial scores for Intuit Inc. and Atlassian Corporation:
Rating Comparison
INTU Rating
- Rating: B, indicating a very favorable status.
- Discounted Cash Flow Score: 4, favorable.
- ROE Score: 4, favorable.
- ROA Score: 5, very favorable.
- Debt To Equity Score: 2, moderate.
- Overall Score: 3, moderate.
TEAM Rating
- Rating: C, indicating a very favorable status.
- Discounted Cash Flow Score: 5, very favorable.
- ROE Score: 1, very unfavorable.
- ROA Score: 1, very unfavorable.
- Debt To Equity Score: 1, very unfavorable.
- Overall Score: 2, moderate.
Which one is the best rated?
Based strictly on the available data, Intuit holds a higher rating (B) and better scores in ROE, ROA, and debt-to-equity metrics. Atlassian has a higher discounted cash flow score but lower overall and financial stability scores.
Scores Comparison
Here is the comparison of the Altman Z-Score and Piotroski Score for Intuit and Atlassian:
Intuit Scores
- Altman Z-Score: 9.35, in the safe zone, indicating very low bankruptcy risk.
- Piotroski Score: 9, classified as very strong financial health.
Atlassian Scores
- Altman Z-Score: 4.70, in the safe zone, indicating low bankruptcy risk.
- Piotroski Score: 5, reflecting average financial strength.
Which company has the best scores?
Intuit shows stronger financial health with a higher Altman Z-Score and a very strong Piotroski Score of 9, compared to Atlassian’s safe zone Z-Score and average Piotroski Score of 5.
Grades Comparison
Here is a detailed comparison of the latest grades assigned to Intuit Inc. and Atlassian Corporation by recognized grading companies:
Intuit Inc. Grades
The following table lists recent grades from well-known financial institutions for Intuit Inc.:
| Grading Company | Action | New Grade | Date |
|---|---|---|---|
| Wells Fargo | Downgrade | Equal Weight | 2026-01-08 |
| Wells Fargo | Maintain | Overweight | 2025-11-21 |
| RBC Capital | Maintain | Outperform | 2025-11-21 |
| BMO Capital | Maintain | Outperform | 2025-11-21 |
| Evercore ISI Group | Maintain | Outperform | 2025-11-18 |
| RBC Capital | Maintain | Outperform | 2025-09-02 |
| RBC Capital | Maintain | Outperform | 2025-08-22 |
| UBS | Maintain | Neutral | 2025-08-22 |
| Morgan Stanley | Maintain | Overweight | 2025-08-22 |
| Barclays | Maintain | Overweight | 2025-08-22 |
Overall, Intuit’s grades mostly reflect a strong positive outlook with multiple “Outperform” and “Overweight” ratings, although a recent downgrade to “Equal Weight” by Wells Fargo indicates some caution.
Atlassian Corporation Grades
Below are recent grades from reputable grading companies for Atlassian Corporation:
| Grading Company | Action | New Grade | Date |
|---|---|---|---|
| BTIG | Maintain | Buy | 2026-01-13 |
| Piper Sandler | Maintain | Overweight | 2026-01-05 |
| Bernstein | Maintain | Outperform | 2025-11-18 |
| Macquarie | Maintain | Outperform | 2025-11-03 |
| Mizuho | Maintain | Outperform | 2025-10-31 |
| Bernstein | Maintain | Outperform | 2025-10-31 |
| TD Cowen | Maintain | Hold | 2025-10-27 |
| BMO Capital | Maintain | Outperform | 2025-10-24 |
| UBS | Maintain | Neutral | 2025-10-24 |
| Keybanc | Maintain | Overweight | 2025-10-23 |
Atlassian’s grades consistently show optimism with numerous “Outperform,” “Buy,” and “Overweight” ratings, alongside a few neutral and hold assessments.
Which company has the best grades?
Both Intuit Inc. and Atlassian Corporation have received predominantly positive grades, with a consensus “Buy” rating each. Atlassian shows a slight edge with more recent “Buy” and “Outperform” ratings, suggesting stronger analyst confidence that may influence investor sentiment positively. Intuit’s recent downgrade to “Equal Weight” introduces some caution despite many “Outperform” ratings.
Strengths and Weaknesses
Below is a comparative table highlighting the key strengths and weaknesses of Intuit Inc. (INTU) and Atlassian Corporation (TEAM) based on their recent financial and operational metrics.
| Criterion | Intuit Inc. (INTU) | Atlassian Corporation (TEAM) |
|---|---|---|
| Diversification | Well-diversified across consumer, business, and professional tax segments with strong revenue streams (e.g., $11.1B in Global Business Solutions segment) | Primarily focused on software licenses and services, less diversified product portfolio |
| Profitability | High profitability with 20.55% net margin and favorable ROIC (14.78%) | Negative profitability with -4.92% net margin and unfavorable ROIC (-4.48%) |
| Innovation | Steady product evolution in financial and business software; moderate innovation pace | Strong innovation in collaboration software but struggling to convert into profits |
| Global presence | Strong global presence, especially in small business and consumer markets | Growing global footprint but still focused on niche enterprise collaboration software |
| Market Share | Leading market positions in tax and small business software segments | Competitive in collaboration tools but facing intense competition |
Key takeaways: Intuit demonstrates solid profitability and effective diversification, making it a value creator despite a slight decline in ROIC. Atlassian, while innovative and growing globally, currently faces profitability challenges and is destroying value. Investors should weigh Intuit’s stable financials against Atlassian’s higher risk profile.
Risk Analysis
Below is a comparative risk table for Intuit Inc. (INTU) and Atlassian Corporation (TEAM) based on the most recent financial year 2025 data.
| Metric | Intuit Inc. (INTU) | Atlassian Corporation (TEAM) |
|---|---|---|
| Market Risk | Beta 1.25; moderate volatility | Beta 0.89; lower volatility |
| Debt level | Low debt/equity 0.34; favorable | Moderate debt/equity 0.92; neutral |
| Regulatory Risk | Moderate, US and international financial compliance | Moderate, Australian and global software regulations |
| Operational Risk | Established cloud-based services; steady operations | Some profitability challenges; operational scaling risk |
| Environmental Risk | Moderate; tech industry standard | Moderate; focus on data centers and energy use |
| Geopolitical Risk | US-based; exposure to global markets | Australia-based; exposure to global markets |
In summary, Intuit presents lower financial and operational risks with strong balance sheet metrics and stable profitability, though its valuation appears stretched. Atlassian faces more significant profitability and leverage concerns amid market volatility. The most impactful risks for Atlassian are financial stability and operational execution, while Intuit’s main risk lies in market valuation and regulatory compliance. Both are in the safe zone for bankruptcy risk.
Which Stock to Choose?
Intuit Inc. (INTU) shows a favorable income evolution with strong revenue and net income growth over 2021-2025, supported by solid profitability and financial ratios. Its debt levels are moderate, and the overall rating is very favorable with a B score. The company creates value with a slightly declining ROIC trend but maintains strong financial health.
Atlassian Corporation (TEAM) exhibits revenue growth but faces unfavorable profitability with negative net margin and ROE. Financial ratios are mixed, with some favorable liquidity but elevated debt risk and a very unfavorable moat status. The rating is very favorable overall but with a C score, reflecting challenges in value creation and financial stability.
Investors seeking stability and strong profitability might find Intuit’s profile more aligned with their goals, while those with higher risk tolerance focusing on growth potential could consider Atlassian’s higher revenue growth despite its profitability challenges. The analysis suggests the choice depends on the investor’s risk preference and strategic focus.
Disclaimer: Investment carries a risk of loss of initial capital. The past performance is not a reliable indicator of future results. Be sure to understand risks before making an investment decision.
Go Further
I encourage you to read the complete analyses of Intuit Inc. and Atlassian Corporation to enhance your investment decisions: