Atlassian Corporation and Figma, Inc. are two influential players in the software application industry, each shaping the way teams collaborate and create. Atlassian offers a broad suite of project management and development tools, while Figma focuses on innovative, browser-based design solutions. Their overlapping markets and distinct innovation strategies make this comparison essential. Let’s explore which company presents the most compelling opportunity for your investment portfolio.
Table of contents
Companies Overview
I will begin the comparison between Atlassian Corporation and Figma, Inc. by providing an overview of these two companies and their main differences.
Atlassian Corporation Overview
Atlassian Corporation, headquartered in Sydney, Australia, designs, develops, licenses, and maintains a broad portfolio of software products that support project management, collaboration, and software development. Its flagship offerings include Jira, Confluence, and Trello, which connect technical and business teams globally. Founded in 2002, Atlassian serves diverse service teams with solutions such as Jira Service Management and Atlassian Access, emphasizing enterprise agility and security.
Figma, Inc. Overview
Figma, Inc., based in San Francisco, California, develops a browser-based collaborative design tool that facilitates user interface design and prototyping. Founded in 2012, Figma focuses on enabling design and development teams to build products through tools like Figma Design, Dev Mode, and FigJam, enhancing workflow and communication. The company also integrates AI-driven features and presentation tools to accelerate product development and creative collaboration.
Key similarities and differences
Both Atlassian and Figma operate in the software application industry, aiming to improve team collaboration and productivity. Atlassian offers a wider suite of products targeting project management, software development, and enterprise security, while Figma specializes in design collaboration and prototyping, primarily through cloud-based, real-time tools. Atlassian’s extensive product range contrasts with Figma’s focused innovation in user interface design and creative workflows.
Income Statement Comparison
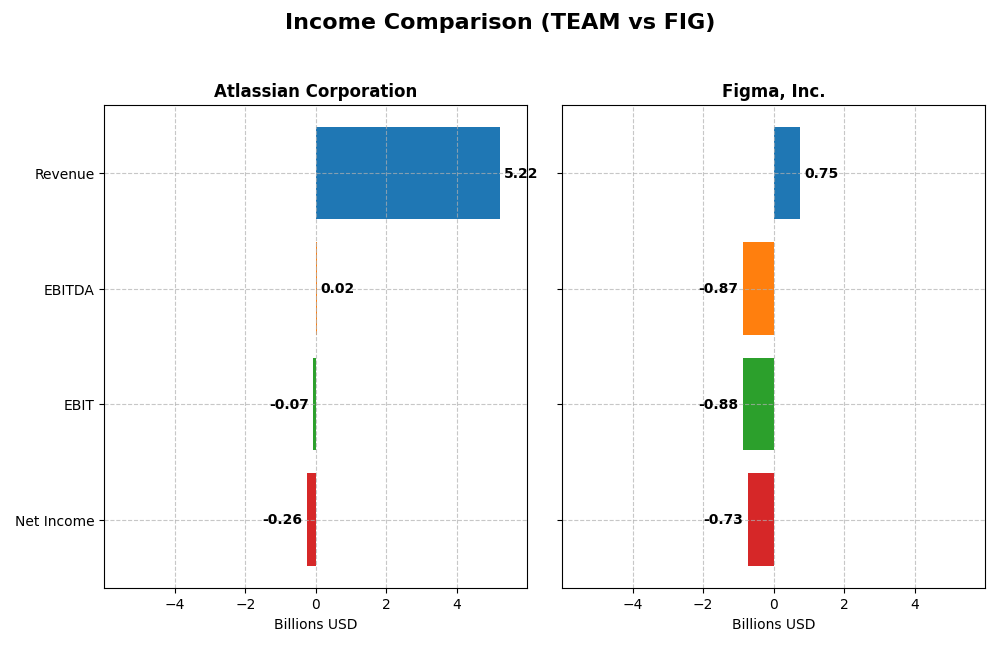
Below is a side-by-side comparison of key income statement metrics for Atlassian Corporation and Figma, Inc. based on their most recent fiscal year data.
| Metric | Atlassian Corporation | Figma, Inc. |
|---|---|---|
| Market Cap | 31.1B | 14.4B |
| Revenue | 5.22B | 749M |
| EBITDA | 24M | -870M |
| EBIT | -68M | -877M |
| Net Income | -257M | -732M |
| EPS | -0.98 | -3.11 |
| Fiscal Year | 2025 | 2024 |
Income Statement Interpretations
Atlassian Corporation
Atlassian Corporation’s revenue grew significantly from 2.09B in 2021 to 5.22B in 2025, with net income losses narrowing from -579M to -257M. Gross margin remained strong at 82.8%, signaling efficient core operations, though EBIT and net margins stayed negative. In 2025, revenue growth slowed modestly, but net margin and EPS improved, reflecting better profitability management despite ongoing losses.
Figma, Inc.
Figma’s revenue expanded rapidly from 505M in 2023 to 749M in 2024, driven by robust demand, but net income plunged from a profit of 286M to a loss of 732M. The gross margin was high at 88.3%, yet EBIT and net margins were deeply negative, indicating heavy operating expenses. The latest year showed strong top-line growth but deteriorating profitability and EPS, signaling rising costs outpacing income.
Which one has the stronger fundamentals?
Atlassian displays stronger fundamentals with consistent revenue and net income growth over five years, a favorable gross margin, and improving profitability metrics despite current losses. Figma’s rapid revenue growth is overshadowed by significant net losses and worsening margins in a shorter timeframe. Overall, Atlassian’s income statement shows more stability and a more balanced progression, suggesting more resilient financial health.
Financial Ratios Comparison
Below is a comparison of key financial ratios for Atlassian Corporation (TEAM) and Figma, Inc. (FIG) based on their most recent fiscal year data.
| Ratios | Atlassian Corporation (TEAM) 2025 | Figma, Inc. (FIG) 2024 |
|---|---|---|
| ROE | -19.1% | -55.3% |
| ROIC | -4.48% | -59.7% |
| P/E | -207.1 | -70.7 |
| P/B | 39.51 | 39.10 |
| Current Ratio | 1.22 | 3.66 |
| Quick Ratio | 1.22 | 3.66 |
| D/E (Debt-to-Equity) | 0.92 | 0.02 |
| Debt-to-Assets | 20.5% | 1.6% |
| Interest Coverage | -4.27 | 0 |
| Asset Turnover | 0.86 | 0.42 |
| Fixed Asset Turnover | 19.02 | 17.09 |
| Payout ratio | 0 | 0 |
| Dividend yield | 0 | 0 |
Interpretation of the Ratios
Atlassian Corporation
Atlassian’s ratios present a mixed picture with several unfavorable metrics such as negative net margin (-4.92%) and return on equity (-19.08%), indicating profitability challenges. However, favorable factors include a low debt-to-assets ratio (20.51%) and a strong quick ratio (1.22). The company does not pay dividends, reflecting reinvestment in growth and a focus on R&D, with no dividend yield.
Figma, Inc.
Figma shows predominantly unfavorable ratios, including a deeply negative net margin (-97.74%) and return on equity (-55.29%), signaling ongoing losses and low profitability. Its low debt level (debt-to-assets 1.6%) and strong quick ratio (3.66) are positive, but weak asset turnover (0.42) indicates inefficiency. Figma also does not pay dividends, consistent with its growth and reinvestment strategy.
Which one has the best ratios?
Comparing both, Atlassian holds a slightly more favorable ratio profile, with a better balance of profitability and leverage metrics despite some weaknesses. Figma’s ratios are more unfavorable overall, dominated by severe losses and lower operational efficiency, making Atlassian the company with relatively stronger financial ratios.
Strategic Positioning
This section compares the strategic positioning of Atlassian and Figma, including market position, key segments, and exposure to disruption:
Atlassian Corporation
- Market leader with 31B market cap, faces competition in software application sector.
- Diverse software portfolio: project management, collaboration, developer tools.
- Moderate exposure via continuous innovation in collaboration and dev platforms.
Figma, Inc.
- Smaller at 14B market cap, newer entrant in design collaboration tools.
- Focused on browser-based UI design and prototyping tools for teams.
- High exposure with AI-driven design tools and browser-based disruption.
Atlassian Corporation vs Figma, Inc. Positioning
Atlassian pursues a diversified approach with multiple software products serving various teams, offering broad market coverage. Figma concentrates on design collaboration, emphasizing innovative, web-native solutions with rapid feature expansion but narrower scope.
Which has the best competitive advantage?
Both companies currently show very unfavorable MOAT evaluations with declining ROIC trends, indicating value destruction and weak competitive advantages based on their recent financial capital efficiency data.
Stock Comparison
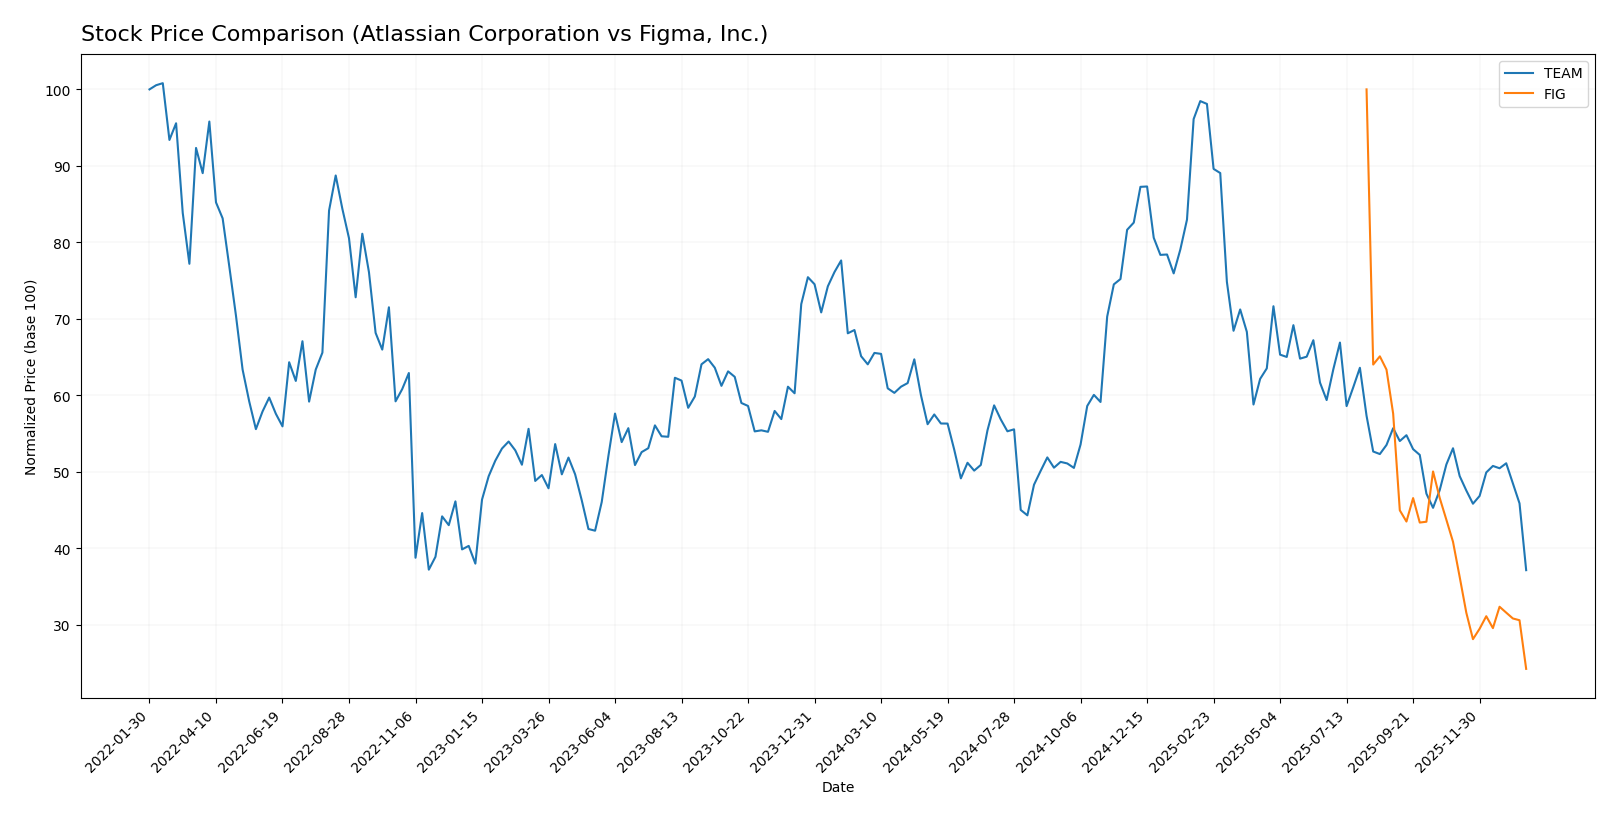
The stock price movements over the past 12 months reveal significant declines for both Atlassian Corporation and Figma, Inc., with varied acceleration patterns and notable volatility impacting trading dynamics.
Trend Analysis
Atlassian Corporation’s stock exhibited a bearish trend with a -42.01% price change over the past year, showing deceleration and high volatility with a 41.22 std deviation. The highest price was 314.28 and the lowest 118.55.
Figma, Inc. experienced a stronger bearish trend with a -75.76% price change, accelerating downward amid moderate volatility (19.95 std deviation). The stock ranged from 122.00 to a low of 29.57.
Comparing the two, Atlassian outperformed Figma, delivering a smaller negative return over the year, despite both stocks trending downward.
Target Prices
The current analyst consensus reveals a significant upside potential for both Atlassian Corporation and Figma, Inc.
| Company | Target High | Target Low | Consensus |
|---|---|---|---|
| Atlassian Corporation | 290 | 185 | 234.14 |
| Figma, Inc. | 52 | 38 | 43.6 |
Analysts expect Atlassian’s stock to rise substantially from its current price of $118.55, indicating strong growth prospects. Similarly, Figma’s consensus target of $43.6 suggests a notable increase from the current price of $29.57, reflecting positive market sentiment.
Analyst Opinions Comparison
This section compares analysts’ ratings and grades for Atlassian Corporation (TEAM) and Figma, Inc. (FIG):
Rating Comparison
TEAM Rating
- Rating: C, considered Very Favorable overall by analysts.
- Discounted Cash Flow Score: 5, indicating a Very Favorable valuation outlook.
- ROE Score: 1, marked as Very Unfavorable for profitability from equity.
- ROA Score: 1, Very Unfavorable in asset utilization efficiency.
- Debt To Equity Score: 1, indicating Very Unfavorable financial risk.
- Overall Score: 2, categorized as Moderate in overall financial strength.
FIG Rating
- Rating: C+, also rated Very Favorable overall.
- Discounted Cash Flow Score: 4, assessed as Favorable for valuation.
- ROE Score: 1, similarly Very Unfavorable for equity profit generation.
- ROA Score: 1, also Very Unfavorable in asset efficiency.
- Debt To Equity Score: 4, Favorable, showing better financial stability.
- Overall Score: 2, also Moderate in overall financial strength.
Which one is the best rated?
Based strictly on the provided data, FIG holds a slightly better overall rating (C+ vs. C) and a stronger debt-to-equity score, indicating better financial stability. TEAM excels in discounted cash flow score but fares worse in financial risk measures.
Scores Comparison
The scores comparison for Atlassian and Figma highlights their financial stability and strength as follows:
Atlassian Scores
- Altman Z-Score: 4.7, indicating a safe zone with low bankruptcy risk.
- Piotroski Score: 5, categorized as average financial strength.
Figma Scores
- Altman Z-Score: 14.3, indicating a safe zone with very low bankruptcy risk.
- Piotroski Score: 4, categorized as average financial strength.
Which company has the best scores?
Figma has a notably higher Altman Z-Score than Atlassian, suggesting stronger financial stability. Both companies have similar Piotroski Scores, reflecting average financial health in this metric.
Grades Comparison
Here is a comparison of the recent grades assigned to Atlassian Corporation and Figma, Inc.:
Atlassian Corporation Grades
The following table shows the recent grades and rating actions from recognized grading companies for Atlassian Corporation:
| Grading Company | Action | New Grade | Date |
|---|---|---|---|
| BTIG | Maintain | Buy | 2026-01-13 |
| Piper Sandler | Maintain | Overweight | 2026-01-05 |
| Bernstein | Maintain | Outperform | 2025-11-18 |
| Macquarie | Maintain | Outperform | 2025-11-03 |
| Mizuho | Maintain | Outperform | 2025-10-31 |
| Bernstein | Maintain | Outperform | 2025-10-31 |
| TD Cowen | Maintain | Hold | 2025-10-27 |
| BMO Capital | Maintain | Outperform | 2025-10-24 |
| UBS | Maintain | Neutral | 2025-10-24 |
| Keybanc | Maintain | Overweight | 2025-10-23 |
Atlassian’s grades predominantly reflect positive sentiment, with multiple “Outperform,” “Buy,” and “Overweight” ratings, indicating a generally favorable outlook.
Figma, Inc. Grades
The following table shows the recent grades and rating actions from recognized grading companies for Figma, Inc.:
| Grading Company | Action | New Grade | Date |
|---|---|---|---|
| Morgan Stanley | Maintain | Equal Weight | 2026-01-15 |
| Wells Fargo | Upgrade | Overweight | 2026-01-08 |
| RBC Capital | Maintain | Sector Perform | 2026-01-05 |
| Goldman Sachs | Maintain | Neutral | 2025-11-07 |
| JP Morgan | Maintain | Neutral | 2025-11-06 |
| Piper Sandler | Maintain | Overweight | 2025-11-06 |
| Wells Fargo | Maintain | Equal Weight | 2025-11-05 |
| Wells Fargo | Maintain | Equal Weight | 2025-09-04 |
| Morgan Stanley | Maintain | Equal Weight | 2025-09-04 |
| RBC Capital | Maintain | Sector Perform | 2025-09-04 |
Figma’s grades trend mostly towards neutral to moderately positive ratings, with several “Equal Weight,” “Neutral,” and some “Overweight” recommendations, reflecting cautious optimism.
Which company has the best grades?
Atlassian Corporation has received more consistently positive and higher grades such as “Outperform” and “Buy,” compared to Figma’s predominantly neutral and “Equal Weight” ratings. This suggests that analysts view Atlassian more favorably, which could influence investor confidence and portfolio positioning.
Strengths and Weaknesses
Below is a comparative overview of key strengths and weaknesses for Atlassian Corporation (TEAM) and Figma, Inc. (FIG) based on their recent financial performance and market positioning.
| Criterion | Atlassian Corporation (TEAM) | Figma, Inc. (FIG) |
|---|---|---|
| Diversification | Moderate; strong in software collaboration with growing product segments but limited beyond core offerings | Limited; focused primarily on collaborative design software with less diversification |
| Profitability | Unfavorable; negative net margin (-4.92%) and ROE (-19.08%), declining ROIC | Unfavorable; steep losses with net margin (-97.74%) and ROE (-55.29%), very steep ROIC decline |
| Innovation | Strong product innovation in collaboration tools, steady revenue growth from licenses and services | Strong innovation in UI/UX design software but profitability and capital efficiency issues persist |
| Global presence | Well-established global customer base with diversified revenue streams | Growing global presence but smaller scale and less mature market penetration |
| Market Share | Significant in software collaboration space, consistent revenue increase in licenses and services | Emerging player with niche market share, still building scale and customer base |
Key takeaways: Both companies face profitability challenges with negative returns on capital, but Atlassian benefits from broader diversification and a more established global presence. Figma shows strong innovation but is in an earlier growth phase with higher financial risk. Caution is warranted, particularly regarding their ability to generate sustainable profits.
Risk Analysis
Below is a comparative overview of key risks for Atlassian Corporation (TEAM) and Figma, Inc. (FIG) based on the most recent data:
| Metric | Atlassian Corporation (TEAM) | Figma, Inc. (FIG) |
|---|---|---|
| Market Risk | Beta 0.89 (moderate volatility) | Beta -3.80 (highly volatile) |
| Debt level | Debt/Equity 0.92 (moderate) | Debt/Equity 0.02 (very low) |
| Regulatory Risk | Moderate (operates globally, subject to data/security laws) | Moderate (US-based, IPO in 2025, regulatory scrutiny possible) |
| Operational Risk | Medium (diverse product portfolio, tech challenges) | Medium (newer company, reliance on innovation) |
| Environmental Risk | Low (software industry, limited direct impact) | Low (software industry, limited direct impact) |
| Geopolitical Risk | Moderate (headquartered in Australia, global presence) | Moderate (US-based with global clients, sensitive to US policy) |
In synthesis, Figma faces the most impactful risk from extreme market volatility (negative beta of -3.80) and unfavorable profitability metrics, which could affect investor confidence and stock stability. Atlassian shows moderate market risk with stronger operational scale but suffers from profitability and interest coverage challenges. Both companies have low debt risk but face typical regulatory and geopolitical uncertainties inherent to global tech firms. Caution is advised when considering their exposure to market swings and operational execution.
Which Stock to Choose?
Atlassian Corporation (TEAM) shows favorable income growth with a 19.66% revenue increase in 2025 and positive long-term trends. Its financial ratios are slightly unfavorable overall, marked by negative profitability and high price-to-book ratio, but with a strong liquidity position. The company carries moderate debt and holds a very favorable rating despite challenges, though it is shedding value with declining ROIC.
Figma, Inc. (FIG) experiences strong revenue growth of 48.36% in 2024 but suffers from unfavorable profitability and financial ratios, including a very high price-to-sales ratio and weak asset turnover. It has low debt levels and a high current ratio but is also shedding value with deteriorating ROIC. Its rating is very favorable, mainly supported by liquidity and manageable debt.
Investors prioritizing growth and income improvements might find TEAM’s steady revenue and earnings growth, alongside a strong rating, indicative of potential. Conversely, risk-tolerant investors focusing on liquidity and low leverage could consider FIG’s rapid revenue expansion despite profitability challenges and unfavorable ratios. Both companies show value destruction, implying cautious interpretation.
Disclaimer: Investment carries a risk of loss of initial capital. The past performance is not a reliable indicator of future results. Be sure to understand risks before making an investment decision.
Go Further
I encourage you to read the complete analyses of Atlassian Corporation and Figma, Inc. to enhance your investment decisions: