Atlassian Corporation and Elastic N.V. are two prominent players in the software application industry, each driving innovation with unique approaches. Atlassian focuses on collaboration and project management tools, while Elastic specializes in real-time search and data analytics solutions. Their overlapping markets and commitment to cloud technology make this comparison particularly relevant. Join me as we explore which company presents the most compelling investment opportunity in 2026.
Table of contents
Companies Overview
I will begin the comparison between Atlassian Corporation and Elastic N.V. by providing an overview of these two companies and their main differences.
Atlassian Corporation Overview
Atlassian Corporation, founded in 2002 and headquartered in Sydney, Australia, designs and develops a wide range of software products aimed at improving team collaboration and project management. Its portfolio includes Jira, Confluence, Trello, and several developer tools such as Bitbucket and Opsgenie. The company serves diverse teams in IT, legal, HR, and software development, focusing on enhancing productivity and agile business responses.
Elastic N.V. Overview
Elastic N.V., incorporated in 2012 and based in Mountain View, California, specializes in search technology solutions that operate in multi-cloud environments. Its flagship Elastic Stack includes Elasticsearch, Kibana, Beats, and Logstash, which enable data ingestion, search, analysis, and visualization. Elastic serves customers needing real-time data insights across various applications, including logging, metrics, and synthetic monitoring.
Key similarities and differences
Both Atlassian and Elastic operate in the software application industry, focusing on enhancing business operations through technology. Atlassian emphasizes collaboration and project management tools, while Elastic centers on data search and analytics platforms. Atlassian’s broader product suite targets teamwork and workflow integration, whereas Elastic provides infrastructure for data processing and real-time insights, highlighting their distinct but complementary business models.
Income Statement Comparison
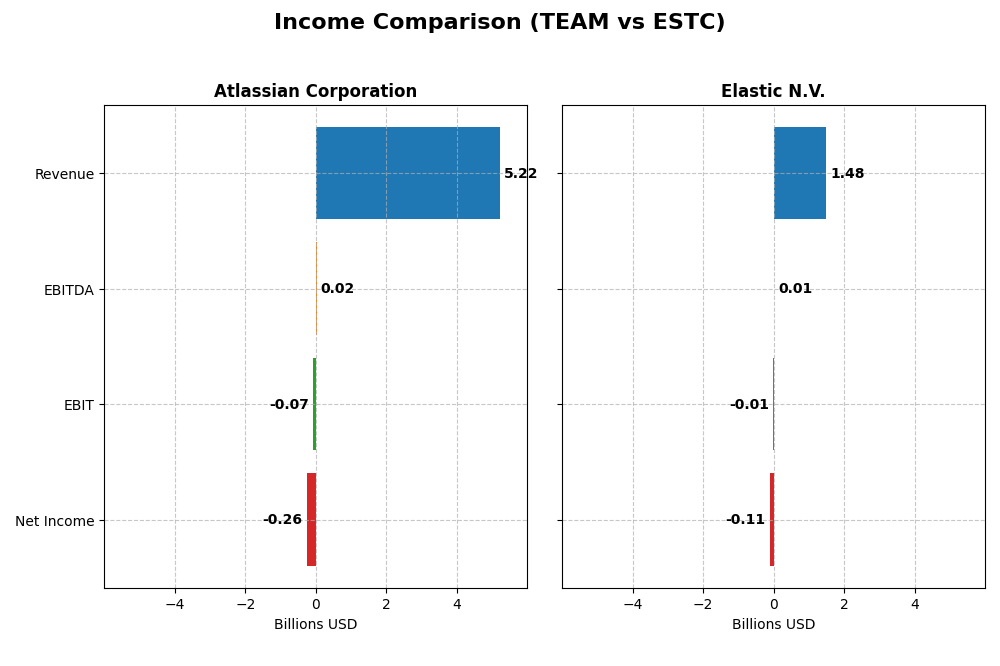
The following table presents a side-by-side comparison of key income statement metrics for Atlassian Corporation and Elastic N.V. based on their most recent fiscal year data.
| Metric | Atlassian Corporation | Elastic N.V. |
|---|---|---|
| Market Cap | 31.1B | 7.5B |
| Revenue | 5.22B | 1.48B |
| EBITDA | 24.0M | 6.1M |
| EBIT | -68.3M | -6.3M |
| Net Income | -257M | -108M |
| EPS | -0.98 | -1.04 |
| Fiscal Year | 2025 | 2025 |
Income Statement Interpretations
Atlassian Corporation
Atlassian’s revenue steadily increased from 2.1B in 2021 to 5.2B in 2025, showing a strong growth trajectory. Net income, while negative throughout, improved from -579M in 2021 to -257M in 2025. Gross margins remained robust at 82.8% in 2025, but EBIT and net margins stayed unfavorable. The latest year saw revenue growth slow slightly, with mixed margin improvements.
Elastic N.V.
Elastic’s revenue grew from 608M in 2021 to 1.48B in 2025, indicating solid expansion. Net income fluctuated, turning positive in 2024 (61.7M) but declining to -108M in 2025. Gross margin was favorable at 74.4% in 2025, though EBIT and net margins remained negative. The most recent year showed revenue growth continuing, but net margin and EPS deteriorated significantly.
Which one has the stronger fundamentals?
Both companies exhibit favorable gross margins and revenue growth over the period. Atlassian shows more consistent net income improvement despite ongoing losses, while Elastic’s net income volatility raises concerns. Atlassian’s higher gross margin and steady EPS growth contrast with Elastic’s recent net margin and EPS declines, reflecting mixed fundamentals for both firms.
Financial Ratios Comparison
The following table compares key financial ratios for Atlassian Corporation (TEAM) and Elastic N.V. (ESTC) based on their most recent fiscal year data.
| Ratios | Atlassian Corporation (TEAM) FY 2025 | Elastic N.V. (ESTC) FY 2025 |
|---|---|---|
| ROE | -19.1% | -11.7% |
| ROIC | -4.5% | -3.4% |
| P/E | -207.1 | -82.7 |
| P/B | 39.5 | 9.64 |
| Current Ratio | 1.22 | 1.92 |
| Quick Ratio | 1.22 | 1.92 |
| D/E (Debt to Equity) | 0.92 | 0.64 |
| Debt-to-Assets | 20.5% | 22.9% |
| Interest Coverage | -4.27 | -2.17 |
| Asset Turnover | 0.86 | 0.57 |
| Fixed Asset Turnover | 19.0 | 51.3 |
| Payout ratio | 0% | 0% |
| Dividend yield | 0% | 0% |
Interpretation of the Ratios
Atlassian Corporation
Atlassian’s financial ratios reveal mixed signals with a slightly unfavorable global assessment. Key weaknesses include negative net margin (-4.92%) and return on equity (-19.08%), indicating profitability challenges. Its debt-to-assets ratio is favorable at 20.51%, and liquidity ratios show moderate stability. The company does not pay dividends, likely reflecting reinvestment in growth and R&D priorities.
Elastic N.V.
Elastic presents a neutral overall ratios evaluation, balancing favorable liquidity ratios such as a current ratio of 1.92 with unfavorable profitability metrics like a net margin of -7.29% and negative return on equity of -11.66%. The company’s dividend yield is zero, consistent with a reinvestment strategy during growth phases, supported by a solid debt-to-assets ratio of 22.95%.
Which one has the best ratios?
Elastic holds a neutral stance, slightly better than Atlassian’s slightly unfavorable profile, due to stronger liquidity and lower leverage concerns. Both companies face profitability challenges and do not distribute dividends, but Elastic’s higher proportion of favorable ratios and better current ratio suggest a more balanced financial position in 2025.
Strategic Positioning
This section compares the strategic positioning of Atlassian Corporation and Elastic N.V., including market position, key segments, and exposure to technological disruption:
Atlassian Corporation
- Large market cap of 31B with moderate competitive pressure in software application industry.
- Diverse product portfolio including project management, collaboration, and developer tools driving revenue.
- Exposure to technological disruption managed through integrated cloud services and enterprise security products.
Elastic N.V.
- Smaller market cap of 7.5B, facing competitive pressure in cloud-based software search solutions.
- Focused on Elastic Stack products for search, analytics, and data ingestion across multi-cloud environments.
- Technological disruption addressed via continuous innovation in real-time search and analytics platforms.
Atlassian Corporation vs Elastic N.V. Positioning
Atlassian’s strategy is diversified across multiple software collaboration and development tools, offering broad market coverage. Elastic is more concentrated on search and analytics software, focusing on multi-cloud environments. Atlassian’s scale provides wider market reach, Elastic emphasizes platform specialization.
Which has the best competitive advantage?
Both companies are currently shedding value relative to their cost of capital, but Elastic shows a positive ROIC trend indicating improving profitability. Atlassian faces declining ROIC, reflecting deteriorating value creation despite its larger scale.
Stock Comparison
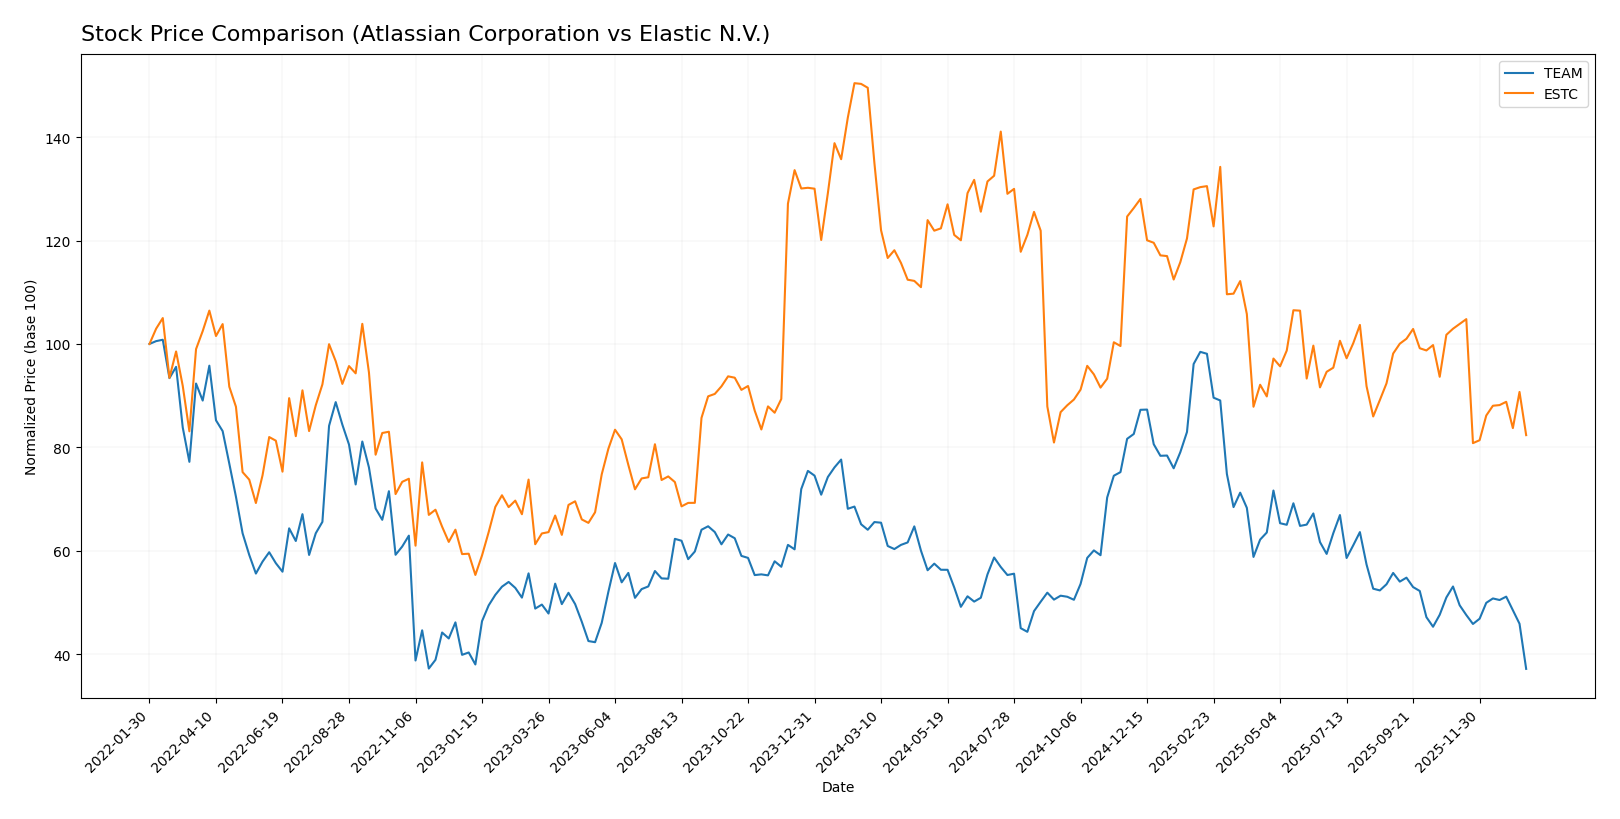
The past year reveals significant bearish trends for both Atlassian Corporation and Elastic N.V., marked by steep price declines and decelerating momentum, with varying investor volume dynamics shaping their trading patterns.
Trend Analysis
Atlassian Corporation (TEAM) experienced a bearish trend with a -42.01% price change over the past 12 months, accompanied by a deceleration in trend and high volatility, peaking at 314.28 and bottoming at 118.55.
Elastic N.V. (ESTC) also faced a bearish trend, with a -44.93% price drop over the same period, showing deceleration and moderate volatility, hitting a high of 129.62 and a low of 70.04.
Comparing both, Atlassian Corporation delivered a slightly better market performance than Elastic N.V., with a less severe overall price decline over the past year.
Target Prices
Analysts present a clear target price consensus for both Atlassian Corporation and Elastic N.V.
| Company | Target High | Target Low | Consensus |
|---|---|---|---|
| Atlassian Corporation | 290 | 185 | 234.14 |
| Elastic N.V. | 134 | 76 | 108 |
The target consensus for Atlassian at 234.14 USD is nearly double its current price of 118.55 USD, indicating strong upside potential. Elastic’s consensus target of 108 USD also suggests a significant premium over the current price of 71.38 USD, reflecting optimistic analyst expectations.
Analyst Opinions Comparison
This section compares analysts’ ratings and grades for Atlassian Corporation and Elastic N.V., highlighting key financial evaluation metrics:
Rating Comparison
Atlassian Corporation Rating
- Rating: C, considered Very Favorable by analysts.
- Discounted Cash Flow Score: 5, indicating a very favorable DCF.
- ROE Score: 1, reflecting very unfavorable efficiency in equity.
- ROA Score: 1, signaling very unfavorable asset utilization.
- Debt To Equity Score: 1, marking very unfavorable financial risk.
- Overall Score: 2, a moderate overall financial standing.
Elastic N.V. Rating
- Rating: C-, also Very Favorable according to analysts.
- Discounted Cash Flow Score: 3, showing a moderate valuation.
- ROE Score: 1, also very unfavorable in equity efficiency.
- ROA Score: 1, equally very unfavorable asset use.
- Debt To Equity Score: 1, similarly very unfavorable risk.
- Overall Score: 1, a very unfavorable comprehensive rating.
Which one is the best rated?
Atlassian Corporation holds a higher overall score (2 vs. 1) and a superior discounted cash flow score compared to Elastic N.V., making it the better rated company based solely on the provided analyst data.
Scores Comparison
Here is a comparison of the financial health scores for Atlassian Corporation and Elastic N.V.:
Atlassian Corporation Scores
- Altman Z-Score: 4.70, indicating a safe zone, low bankruptcy risk.
- Piotroski Score: 5, classified as average financial strength.
Elastic N.V. Scores
- Altman Z-Score: 3.51, also in safe zone with low bankruptcy risk.
- Piotroski Score: 4, also considered average financial strength.
Which company has the best scores?
Atlassian Corporation shows a higher Altman Z-Score and a slightly better Piotroski Score compared to Elastic N.V. Both are in the safe zone for bankruptcy risk, but Atlassian’s scores suggest marginally stronger financial health based on the provided data.
Grades Comparison
Here is a comparison of the latest grades from recognized grading companies for Atlassian Corporation and Elastic N.V.:
Atlassian Corporation Grades
This table summarizes the recent grades assigned by reputable firms for Atlassian Corporation.
| Grading Company | Action | New Grade | Date |
|---|---|---|---|
| BTIG | Buy | Buy | 2026-01-13 |
| Piper Sandler | Buy | Overweight | 2026-01-05 |
| Bernstein | Buy | Outperform | 2025-11-18 |
| Macquarie | Buy | Outperform | 2025-11-03 |
| Mizuho | Buy | Outperform | 2025-10-31 |
| Bernstein | Buy | Outperform | 2025-10-31 |
| TD Cowen | Hold | Hold | 2025-10-27 |
| BMO Capital | Buy | Outperform | 2025-10-24 |
| UBS | Hold | Neutral | 2025-10-24 |
| Keybanc | Buy | Overweight | 2025-10-23 |
Atlassian’s grades mostly indicate strong buy or outperform ratings, with a few hold and neutral assessments, showing a positive consensus trend.
Elastic N.V. Grades
This table presents the latest grades given by recognized grading firms for Elastic N.V.
| Grading Company | Action | New Grade | Date |
|---|---|---|---|
| Barclays | Buy | Overweight | 2026-01-12 |
| RBC Capital | Buy | Outperform | 2026-01-05 |
| Jefferies | Buy | Buy | 2026-01-05 |
| Citigroup | Buy | Buy | 2025-11-24 |
| Wedbush | Buy | Outperform | 2025-11-21 |
| B of A Securities | Hold | Neutral | 2025-11-21 |
| Guggenheim | Buy | Buy | 2025-11-21 |
| Wells Fargo | Hold | Equal Weight | 2025-11-21 |
| RBC Capital | Buy | Outperform | 2025-11-21 |
| Canaccord Genuity | Buy | Buy | 2025-11-21 |
Elastic’s grades show a strong bias toward buy and outperform ratings, with a minority of hold or neutral ratings, indicating a solid positive outlook.
Which company has the best grades?
Both Atlassian Corporation and Elastic N.V. have predominantly buy and outperform grades from reliable sources, reflecting strong market confidence. Atlassian shows slightly more “Outperform” ratings, while Elastic has a higher number of pure “Buy” grades; this may influence investors’ perceptions of growth potential and risk tolerance.
Strengths and Weaknesses
Below is a comparative overview of key strengths and weaknesses for Atlassian Corporation (TEAM) and Elastic N.V. (ESTC) based on recent financial and operational data:
| Criterion | Atlassian Corporation (TEAM) | Elastic N.V. (ESTC) |
|---|---|---|
| Diversification | Moderate: Revenue mainly from License and Service (4.93B USD in 2025) with some Product/Service other segments | Moderate: Revenue primarily from Subscription (1.38B USD in 2025) and Professional Services |
| Profitability | Unfavorable: Negative net margin (-4.92%), ROIC (-4.48%), and ROE (-19.08%) indicate value destruction | Unfavorable: Negative net margin (-7.29%), ROIC (-3.45%), and ROE (-11.66%) but improving ROIC trend |
| Innovation | Moderate: Strong product turnover (fixed asset turnover 19.02) but declining ROIC trend suggests challenges | Favorable: Very high fixed asset turnover (51.28) and growing ROIC trend indicate improving innovation efficiency |
| Global presence | Strong: Large scale with significant License and Service revenue growth over years | Growing: Subscription and services revenue have shown consistent growth, indicating expanding footprint |
| Market Share | Large player in collaboration software but facing profitability pressure | Niche leader in search and analytics with growing profitability potential |
Key takeaways: Both companies face profitability challenges, with Atlassian currently shedding value and Elastic showing signs of recovery. Elastic’s growing ROIC and strong asset efficiency suggest better innovation leverage, while Atlassian’s larger scale offers diversification benefits but under pressure to improve returns.
Risk Analysis
Below is a comparative table highlighting key risk factors for Atlassian Corporation (TEAM) and Elastic N.V. (ESTC) based on the most recent data from 2025:
| Metric | Atlassian Corporation (TEAM) | Elastic N.V. (ESTC) |
|---|---|---|
| Market Risk | Moderate beta 0.888, recent price drop -7.7% | Moderate beta 0.925, recent price drop -2.0% |
| Debt level | Debt-to-Equity 0.92 (neutral), Debt-to-Assets 20.5% (favorable) | Debt-to-Equity 0.64 (neutral), Debt-to-Assets 23.0% (favorable) |
| Regulatory Risk | Moderate, operates globally with tech regulations | Moderate, US-based with data privacy regulations |
| Operational Risk | High, complex software portfolio and integration | Medium, focused on Elastic Stack products |
| Environmental Risk | Low, software sector with limited physical footprint | Low, software sector with limited physical footprint |
| Geopolitical Risk | Moderate, headquartered in Australia, global presence | Moderate, US-based, impacted by international trade policies |
In synthesis, both companies face moderate market and geopolitical risks typical for global tech firms, with Atlassian experiencing a sharper recent stock decline. Operational risks are higher for Atlassian due to its broader product suite complexity. Debt levels are manageable for both, but profitability challenges persist as indicated by negative net margins. Investors should prioritize risk management around market volatility and operational execution.
Which Stock to Choose?
Atlassian Corporation (TEAM) has shown favorable income growth with a 19.66% revenue increase in 2025 and a 71.43% favorable income statement rating. However, profitability remains challenged, with negative returns on equity (-19.08%) and assets (-4.25%), and a slightly unfavorable overall financial ratio evaluation. Its debt levels are moderate with a 20.51% debt-to-assets ratio, but the company is considered to be shedding value with a very unfavorable moat rating.
Elastic N.V. (ESTC) also presents favorable income growth, including a 17.04% revenue increase and a 71.43% favorable income statement rating for 2025. Profitability indicators are weak, with negative returns on equity (-11.66%) and assets (-4.17%), but its financial ratios are evaluated as neutral overall. Debt metrics are reasonable with a 22.95% debt-to-assets ratio. The company is shedding value but shows improving profitability trends, earning a slightly unfavorable moat rating.
Investors with a tolerance for risk and an interest in companies showing improving profitability might view Elastic N.V.’s profile as more favorable due to its neutral financial ratios and growing return on invested capital. Conversely, those prioritizing established scale and stronger income growth could interpret Atlassian’s higher revenue growth and favorable income trends as more appealing, despite its value destruction concerns.
Disclaimer: Investment carries a risk of loss of initial capital. The past performance is not a reliable indicator of future results. Be sure to understand risks before making an investment decision.
Go Further
I encourage you to read the complete analyses of Atlassian Corporation and Elastic N.V. to enhance your investment decisions: