Atlassian Corporation and Dayforce Inc. are two prominent players in the software application industry, each offering innovative solutions that cater to business productivity and human capital management. Atlassian focuses on collaboration and project management tools, while Dayforce specializes in cloud-based human resources and payroll platforms. Their overlapping market sectors and distinct innovation strategies make them compelling candidates for comparison. In this article, I will help you determine which company stands out as the more attractive investment opportunity.
Table of contents
Companies Overview
I will begin the comparison between Atlassian Corporation and Dayforce Inc by providing an overview of these two companies and their main differences.
Atlassian Corporation Overview
Atlassian Corporation, founded in 2002 and headquartered in Sydney, Australia, develops and maintains a wide range of software products aimed at improving team collaboration and project management. Its portfolio includes Jira, Confluence, Trello, and multiple software development tools, positioning it as a leader in application software that connects technical and business teams globally.
Dayforce Inc Overview
Dayforce Inc, based in Minneapolis, Minnesota, and incorporated in 2013, operates as a human capital management (HCM) software provider. It delivers cloud-based HCM solutions such as Dayforce and Powerpay, offering payroll, benefits, workforce, and talent management services mainly in the US, Canada, and internationally, targeting both enterprise and small business markets.
Key similarities and differences
Both Atlassian and Dayforce operate within the software application industry, focusing on cloud-based solutions. Atlassian emphasizes collaborative project management and software development tools, while Dayforce specializes in HCM and payroll software. Atlassian has a larger market cap of 31.1B USD compared to Dayforce’s 11.1B USD, reflecting their differing scales and market focuses, with Atlassian targeting broader team collaboration and Dayforce focusing on workforce management.
Income Statement Comparison
The table below compares key income statement metrics for Atlassian Corporation and Dayforce Inc for their most recent fiscal years, highlighting differences in revenue, profitability, and earnings per share.
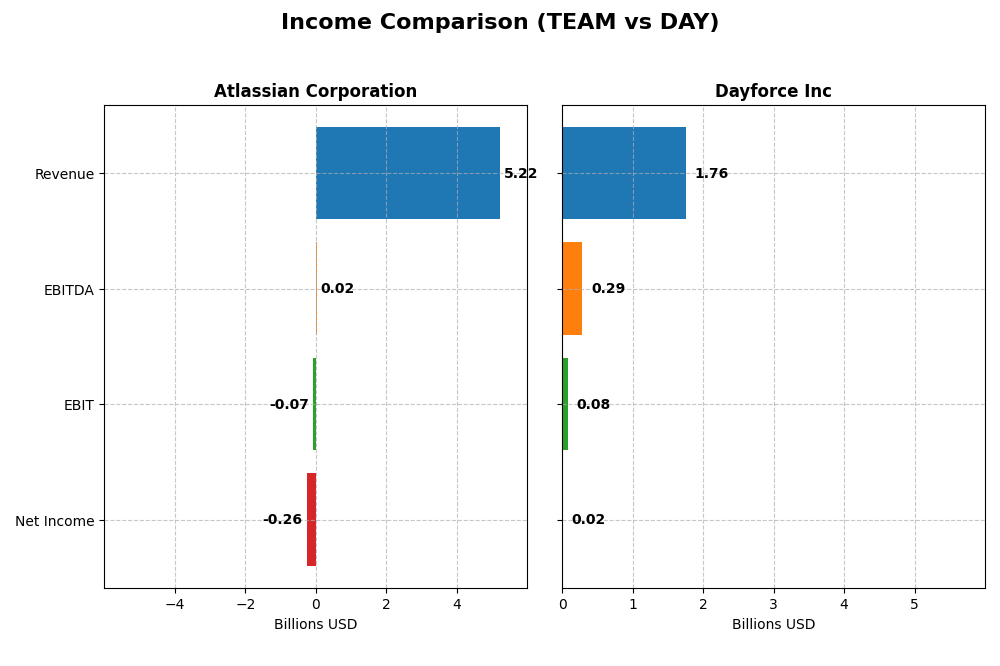
| Metric | Atlassian Corporation (TEAM) | Dayforce Inc (DAY) |
|---|---|---|
| Market Cap | 31.1B | 11.1B |
| Revenue | 5.22B | 1.76B |
| EBITDA | 24.0M | 288.0M |
| EBIT | -68.3M | 78.2M |
| Net Income | -257.0M | 18.1M |
| EPS | -0.98 | 0.11 |
| Fiscal Year | 2025 | 2024 |
Income Statement Interpretations
Atlassian Corporation
Atlassian showed a strong revenue growth of nearly 150% from 2021 to 2025, with revenue reaching $5.22B in 2025. Net income improved by over 55% overall but remained negative at -$257M in 2025. Gross margins stayed favorable around 83%, though EBIT and net margins were negative. The latest year saw revenue and gross profit increase over 19%, but EBIT declined by 33%.
Dayforce Inc
Dayforce’s revenue increased steadily by 109% over 2020-2024, hitting $1.76B in 2024. Net income turned positive, reaching $18.1M, with a net margin just above 1%. Gross margin was favorable at 46%. While revenue and gross profit grew strongly in 2024, EBIT dropped 41% and net margin fell, indicating some margin pressure in the most recent year.
Which one has the stronger fundamentals?
Atlassian presents robust top-line growth and consistently high gross margins, but persistent negative profitability pressures its fundamentals. Dayforce, while smaller, achieved positive net income and modest margins, though recent margin declines warrant caution. Both companies exhibit favorable revenue growth, yet profitability metrics suggest contrasting operational efficiencies for investors to consider.
Financial Ratios Comparison
The table below presents a side-by-side comparison of key financial ratios for Atlassian Corporation (TEAM) and Dayforce Inc (DAY) based on their most recent fiscal year data.
| Ratios | Atlassian Corporation (TEAM) FY 2025 | Dayforce Inc (DAY) FY 2024 |
|---|---|---|
| ROE | -19.1% | 0.71% |
| ROIC | -4.48% | 1.31% |
| P/E | -207.1 | 633.3 |
| P/B | 39.5 | 4.50 |
| Current Ratio | 1.22 | 1.13 |
| Quick Ratio | 1.22 | 1.13 |
| D/E (Debt-to-Equity) | 0.92 | 0.48 |
| Debt-to-Assets | 20.5% | 13.5% |
| Interest Coverage | -4.27 | 2.56 |
| Asset Turnover | 0.86 | 0.19 |
| Fixed Asset Turnover | 19.0 | 7.46 |
| Payout ratio | 0 | 0 |
| Dividend yield | 0 | 0 |
Interpretation of the Ratios
Atlassian Corporation
Atlassian shows a mixed ratio profile with several unfavorable metrics such as negative net margin (-4.92%) and return on equity (-19.08%), indicating profitability challenges. However, its debt-to-assets ratio (20.51%) and fixed asset turnover (19.02) are favorable, suggesting efficient asset use and moderate leverage. The company does not pay dividends, likely reflecting reinvestment in growth and R&D priorities.
Dayforce Inc
Dayforce exhibits mostly unfavorable ratios, including low net margin (1.03%), return on equity (0.71%), and a high price-to-earnings ratio (633.29), which could imply overvaluation or low earnings. Favorable ratios like debt-to-equity (0.48) and fixed asset turnover (7.46) indicate conservative leverage and decent asset use. It also does not pay dividends, consistent with a growth or reinvestment strategy.
Which one has the best ratios?
Atlassian’s ratios appear slightly more balanced, with a higher proportion of favorable metrics (35.71%) compared to Dayforce’s 28.57%. Although both companies face profitability issues, Atlassian’s stronger asset turnover and moderate leverage contrast with Dayforce’s more unfavorable earnings and valuation ratios. Overall, Atlassian’s financial ratios seem marginally more favorable.
Strategic Positioning
This section compares the strategic positioning of Atlassian Corporation and Dayforce Inc on market position, key segments, and exposure to technological disruption:
Atlassian Corporation
- Leading software application provider with global reach, facing moderate competitive pressure in project management.
- Focused on project management, collaboration, developer tools, and IT service management driving revenue growth.
- Exposure to cloud-based software trends and developer tools innovation, with continuous delivery and security offerings.
Dayforce Inc
- Mid-cap HCM software company with US and international presence, competing in human capital management.
- Concentrated on cloud HCM platform including HR, payroll, workforce, and talent management solutions.
- Cloud-native HCM solutions subject to evolving SaaS technologies and integration with payroll and HR services.
Atlassian Corporation vs Dayforce Inc Positioning
Atlassian pursues a diversified software portfolio spanning project management and developer tools, offering broader market coverage. Dayforce concentrates on cloud-based human capital management, focusing on workforce and payroll solutions, resulting in a narrower but specialized business approach.
Which has the best competitive advantage?
Both companies are currently shedding value as ROIC is below WACC; Atlassian’s declining profitability contrasts with Dayforce’s improving ROIC trend, indicating Dayforce may have a slightly stronger emerging competitive position despite current challenges.
Stock Comparison
The stock prices of Atlassian Corporation and Dayforce Inc have exhibited significant movements over the past year, with Atlassian showing a steep decline and Dayforce a modest decrease, both accompanied by evolving trading volumes and buyer-seller dynamics.
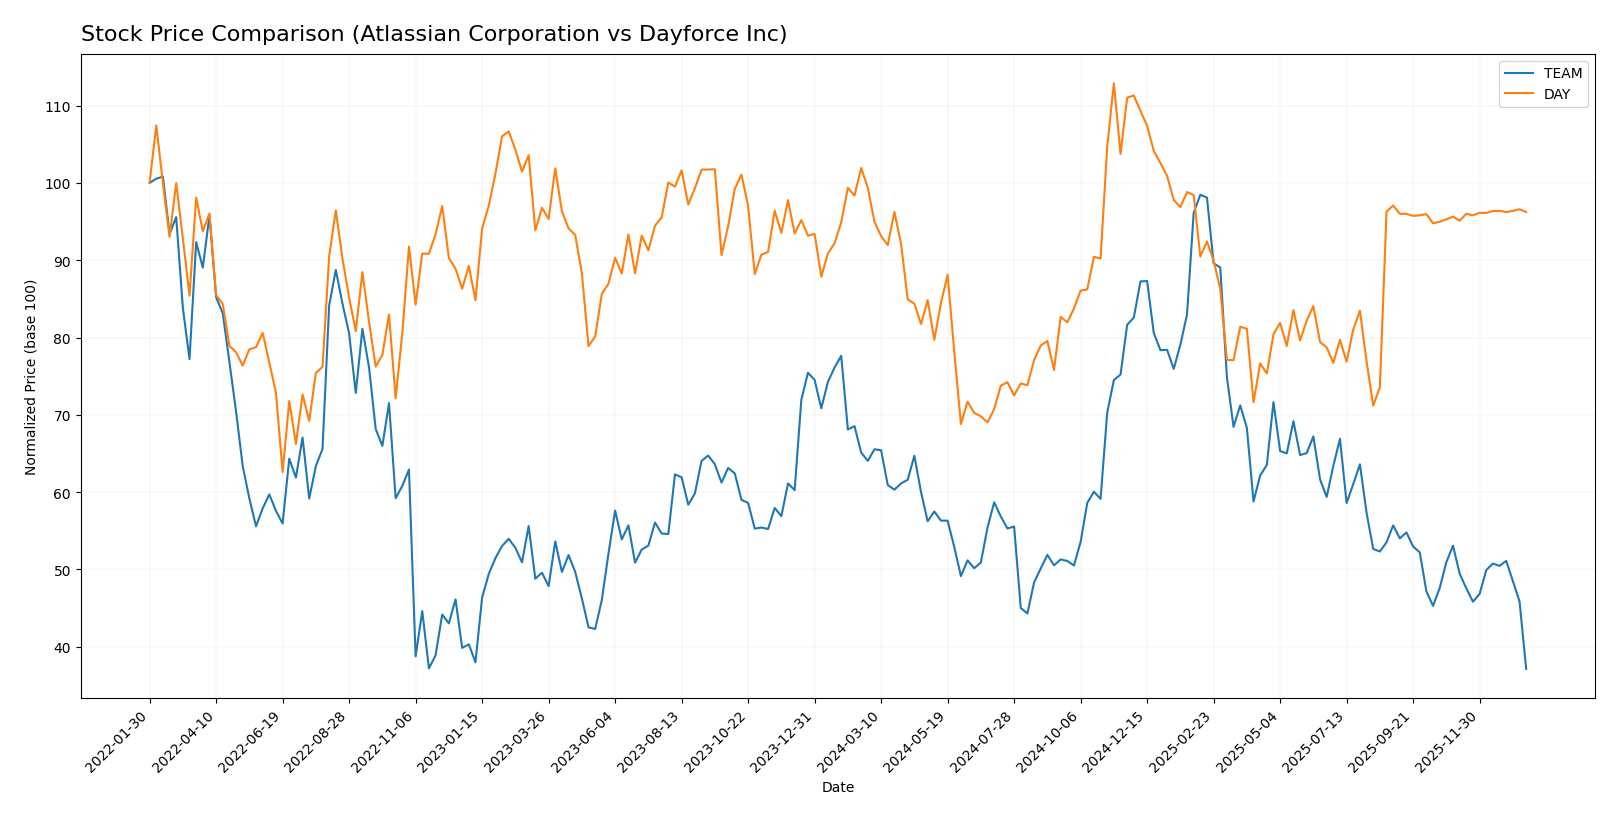
Trend Analysis
Atlassian Corporation’s stock experienced a bearish trend over the past 12 months, dropping by 42.01% with a deceleration in decline and notable volatility marked by a 41.22 standard deviation. The highest price reached was 314.28, and the lowest was 118.55.
Dayforce Inc also showed a bearish trend in the same period, with a 3.16% decrease and deceleration. The stock displayed lower volatility at 7.84 standard deviation, with prices ranging from 49.46 to 81.14. Its recent trend slightly improved with a 0.61% gain.
Comparing both, Atlassian’s stock underperformed Dayforce’s, delivering the lowest market performance over the past year despite higher volatility and trading volume. Dayforce’s stock maintained relative stability and a slight recent upward momentum.
Target Prices
The current target price consensus for Atlassian Corporation and Dayforce Inc reflects moderate to strong upside potential.
| Company | Target High | Target Low | Consensus |
|---|---|---|---|
| Atlassian Corporation | 290 | 185 | 234.14 |
| Dayforce Inc | 70 | 70 | 70 |
Atlassian’s consensus target price of 234.14 USD significantly exceeds its current price of 118.55 USD, suggesting strong analyst optimism. Dayforce’s consensus target of 70 USD is slightly above its current price of 69.16 USD, indicating a stable market expectation.
Analyst Opinions Comparison
This section compares analysts’ ratings and grades for Atlassian Corporation and Dayforce Inc:
Rating Comparison
Atlassian Corporation Rating
- Rating: C, considered Very Favorable by analysts.
- Discounted Cash Flow Score: 5, indicating a Very Favorable valuation.
- ROE Score: 1, seen as Very Unfavorable for profitability generation.
- ROA Score: 1, Very Unfavorable in asset utilization efficiency.
- Debt To Equity Score: 1, categorized as Very Unfavorable reflecting higher risk.
- Overall Score: 2, assessed as Moderate overall financial standing.
Dayforce Inc Rating
- Rating: C-, also rated Very Favorable.
- Discounted Cash Flow Score: 2, rated Moderate for valuation.
- ROE Score: 1, also Very Unfavorable in profitability.
- ROA Score: 1, similarly Very Unfavorable on asset usage.
- Debt To Equity Score: 2, Moderate risk level compared to Atlassian.
- Overall Score: 1, considered Very Unfavorable in overall evaluation.
Which one is the best rated?
Based strictly on the provided data, Atlassian Corporation holds a higher overall score (2 vs. 1) and a stronger discounted cash flow rating, despite both companies sharing very unfavorable profitability and asset efficiency scores. Dayforce shows a better debt-to-equity score but is otherwise rated lower overall.
Scores Comparison
Here is a comparison of the Altman Z-Score and Piotroski Score for Atlassian Corporation and Dayforce Inc:
TEAM Scores
- Altman Z-Score: 4.70, in safe zone, low bankruptcy risk.
- Piotroski Score: 5, indicating average financial strength.
DAY Scores
- Altman Z-Score: 1.24, in distress zone, high bankruptcy risk.
- Piotroski Score: 5, indicating average financial strength.
Which company has the best scores?
TEAM has a significantly higher Altman Z-Score, placing it in the safe zone versus DAY’s distress zone. Both have equal Piotroski Scores, reflecting average financial strength. Overall, TEAM shows stronger financial stability based on these scores.
Grades Comparison
Here is a comparison of the most recent and reliable grades for Atlassian Corporation and Dayforce Inc:
Atlassian Corporation Grades
The following table summarizes recent grades from reputable financial institutions for Atlassian Corporation:
| Grading Company | Action | New Grade | Date |
|---|---|---|---|
| BTIG | Maintain | Buy | 2026-01-13 |
| Piper Sandler | Maintain | Overweight | 2026-01-05 |
| Bernstein | Maintain | Outperform | 2025-11-18 |
| Macquarie | Maintain | Outperform | 2025-11-03 |
| Mizuho | Maintain | Outperform | 2025-10-31 |
| Bernstein | Maintain | Outperform | 2025-10-31 |
| TD Cowen | Maintain | Hold | 2025-10-27 |
| BMO Capital | Maintain | Outperform | 2025-10-24 |
| UBS | Maintain | Neutral | 2025-10-24 |
| Keybanc | Maintain | Overweight | 2025-10-23 |
Atlassian’s grades consistently reflect a positive outlook, with most ratings in the Buy, Overweight, and Outperform categories.
Dayforce Inc Grades
The following table summarizes recent grades from reputable financial institutions for Dayforce Inc:
| Grading Company | Action | New Grade | Date |
|---|---|---|---|
| Needham | Maintain | Hold | 2025-10-30 |
| Stifel | Downgrade | Hold | 2025-09-19 |
| Citigroup | Downgrade | Neutral | 2025-09-17 |
| Wells Fargo | Upgrade | Equal Weight | 2025-08-22 |
| BMO Capital | Downgrade | Market Perform | 2025-08-22 |
| Keybanc | Downgrade | Sector Weight | 2025-08-22 |
| Needham | Downgrade | Hold | 2025-08-22 |
| Barclays | Maintain | Equal Weight | 2025-08-22 |
| Deutsche Bank | Maintain | Hold | 2025-08-22 |
| Jefferies | Maintain | Hold | 2025-08-21 |
Dayforce’s grades show a general trend toward Hold and Neutral ratings, with several recent downgrades.
Which company has the best grades?
Atlassian Corporation has received stronger and more positive grades compared to Dayforce Inc, with a consensus leaning toward Buy and Outperform versus Dayforce’s consensus Hold. This suggests Atlassian is viewed more favorably by analysts, which may influence investor confidence and portfolio decisions.
Strengths and Weaknesses
Below is a comparative overview of key strengths and weaknesses for Atlassian Corporation (TEAM) and Dayforce Inc (DAY), based on their latest financial and operational data.
| Criterion | Atlassian Corporation (TEAM) | Dayforce Inc (DAY) |
|---|---|---|
| Diversification | Moderate: Primarily software licenses and services, with growing subscription revenue (4.9B License and Service in 2025) | Moderate: Focused on cloud recurring services and professional services (1.5B recurring revenue in 2024) |
| Profitability | Weak: Negative net margin (-4.92%), negative ROIC (-4.48%), shedding value | Weak: Slightly positive net margin (1.03%), low ROIC (1.31%), value destruction but improving |
| Innovation | Moderate: High fixed asset turnover (19.02) suggests efficient asset use; declining ROIC trend a concern | Moderate: Growing ROIC trend, but overall financial ratios unfavorable, innovation impact unclear |
| Global presence | Strong: Large revenue base and diversified product lines support international reach | Moderate: Cloud services indicate scalable presence, but smaller revenue base than TEAM |
| Market Share | Strong in collaboration software, but facing profitability challenges | Niche focus in cloud HR/payroll market, with growth in recurring revenues |
Key takeaways: Atlassian shows strong market presence and revenue scale but struggles with profitability and declining capital efficiency. Dayforce has improving profitability trends but remains less profitable overall with a smaller scale. Both require cautious monitoring of financial health and operational execution.
Risk Analysis
Below is a comparative overview of key risks for Atlassian Corporation (TEAM) and Dayforce Inc (DAY) based on the most recent data available:
| Metric | Atlassian Corporation (TEAM) | Dayforce Inc (DAY) |
|---|---|---|
| Market Risk | Moderate (beta 0.89) | Higher (beta 1.18) |
| Debt level | Moderate (DE 0.92, 20.5% debt-to-assets) | Lower (DE 0.48, 13.5% debt-to-assets) |
| Regulatory Risk | Moderate (operates globally, software sector) | Moderate (US-based, HCM software) |
| Operational Risk | Moderate (complex product portfolio, innovation needed) | Moderate (cloud platform dependency) |
| Environmental Risk | Low (software industry, low direct impact) | Low (software industry, low direct impact) |
| Geopolitical Risk | Moderate (headquartered in Australia, global exposure) | Moderate (US-based, international customers) |
Atlassian’s slightly lower beta suggests less market volatility compared to Dayforce, but its negative profitability and coverage ratios indicate operational and financial challenges. Dayforce faces higher market risk and financial distress signals with an Altman Z-Score in the distress zone, posing greater bankruptcy risk. Investors should weigh Atlassian’s scaling challenges against Dayforce’s financial instability.
Which Stock to Choose?
Atlassian Corporation (TEAM) shows a favorable income evolution with 19.66% revenue growth in 2025 and a strong gross margin of 82.84%, despite negative profitability ratios including a -19.08% ROE and -4.48% ROIC. Its debt levels are moderate with a debt-to-assets ratio of 20.51%, and the overall financial ratios are slightly unfavorable. The company holds a very favorable rating status “C” but displays value destruction with a very unfavorable moat.
Dayforce Inc (DAY) presents steady income growth with 16.27% revenue increase in 2024 and a moderate gross margin of 46.14%. Profitability remains low but positive with a 0.71% ROE and 1.31% ROIC. Its financial leverage is lighter, reflected in a 13.52% debt-to-assets ratio, although many ratios are unfavorable. The rating is very favorable at “C-” but the firm shows a slightly unfavorable moat with improving profitability.
Investors seeking growth might find Atlassian’s robust income growth and favorable income statement attractive despite its value destruction signals, while those prioritizing improving profitability and lower financial risk may view Dayforce’s profile as more suitable. The rating and ratio evaluations suggest different risk tolerances and investment styles could influence stock preference.
Disclaimer: Investment carries a risk of loss of initial capital. The past performance is not a reliable indicator of future results. Be sure to understand risks before making an investment decision.
Go Further
I encourage you to read the complete analyses of Atlassian Corporation and Dayforce Inc to enhance your investment decisions: