In the dynamic world of software applications, Cadence Design Systems, Inc. (CDNS) and Atlassian Corporation (TEAM) stand out as influential innovators shaping technology’s future. Both companies operate in the application software sector but target distinct yet overlapping markets—Cadence focuses on integrated circuit design and verification, while Atlassian excels in collaboration and project management tools. This article will analyze their strengths and strategies to identify the most compelling investment opportunity for you.
Table of contents
Companies Overview
I will begin the comparison between Cadence Design Systems and Atlassian Corporation by providing an overview of these two companies and their main differences.
Cadence Design Systems Overview
Cadence Design Systems, Inc. provides software, hardware, and services for integrated circuit (IC) design worldwide. Founded in 1987 and based in San Jose, California, Cadence offers solutions for functional verification, digital IC design, custom IC simulation, and system analysis. It serves markets such as 5G communications, aerospace, automotive, and healthcare, positioning itself as a key player in electronic design automation with a market cap of 86.4B USD.
Atlassian Corporation Overview
Atlassian Corporation, founded in 2002 and headquartered in Sydney, Australia, develops and licenses software products that enhance team collaboration and project management. Its portfolio includes Jira, Confluence, Trello, and Bitbucket, targeting IT, legal, HR, and software development teams globally. With a market cap of 31.1B USD, Atlassian focuses on enabling agile workflows and enterprise security across its cloud-based software solutions.
Key similarities and differences
Both companies operate in the software application industry and provide specialized tools addressing distinct aspects of the technology sector. Cadence focuses on hardware design and verification software primarily for chipmakers and system engineers, while Atlassian targets software development and business teams with collaboration and project management platforms. Their customer bases and product scopes differ significantly, reflecting their complementary roles within the broader technology ecosystem.
Income Statement Comparison
The table below compares key income statement metrics for Cadence Design Systems, Inc. and Atlassian Corporation for their most recent fiscal years, providing a snapshot of their financial performance.
| Metric | Cadence Design Systems, Inc. (2024) | Atlassian Corporation (2025) |
|---|---|---|
| Market Cap | 86.4B | 31.1B |
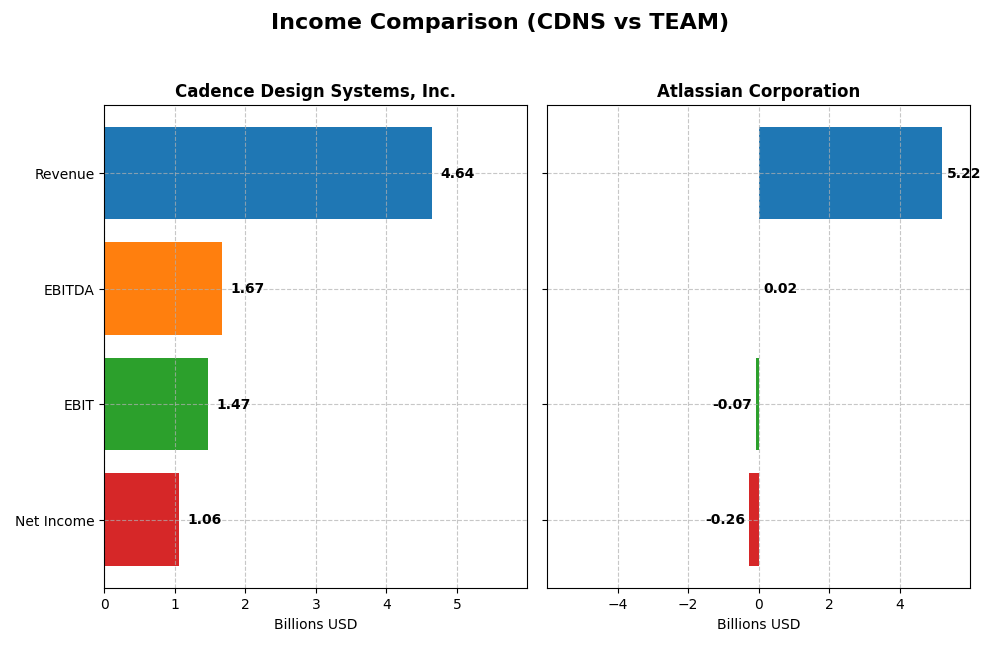
| Revenue | 4.64B | 5.22B |
| EBITDA | 1.67B | 24.0M |
| EBIT | 1.47B | -68.3M |
| Net Income | 1.06B | -257M |
| EPS | 3.89 | -0.98 |
| Fiscal Year | 2024 | 2025 |
Income Statement Interpretations
Cadence Design Systems, Inc.
Cadence Design Systems showed a consistent upward trend in revenue, growing from $2.68B in 2020 to $4.64B in 2024, with net income rising from $590M to $1.06B over the same period. Margins remained stable and favorable, with a gross margin of 86.05% and net margin of 22.74% in 2024. The most recent year saw strong revenue growth of 13.48%, while net margin dipped slightly by 10.66%.
Atlassian Corporation
Atlassian’s revenue expanded significantly from $2.09B in 2021 to $5.22B in 2025, accompanied by persistent net losses, though net income improved from -$579M to -$257M. Gross margin stayed robust at 82.84%, but EBIT and net margins were negative in 2025 at -1.31% and -4.92%, respectively. The latest year showed strong revenue and gross profit growth, but operating expenses grew unfavorably, impacting profitability.
Which one has the stronger fundamentals?
Cadence Design Systems demonstrates stronger fundamentals with consistent profitability, high and stable margins, and positive net income growth. Atlassian shows impressive revenue growth but struggles with profitability and negative margins, despite improving net losses. The higher percentage of favorable income statement metrics for Cadence contrasts with Atlassian’s mixed results, reflecting more robust earnings quality and margin control for Cadence.
Financial Ratios Comparison
This table compares key financial ratios for Cadence Design Systems, Inc. (CDNS) and Atlassian Corporation (TEAM) using the most recent full fiscal year data available.
| Ratios | Cadence Design Systems, Inc. (CDNS) 2024 | Atlassian Corporation (TEAM) 2025 (Jun) |
|---|---|---|
| ROE | 22.6% | -19.1% |
| ROIC | 13.4% | -4.5% |
| P/E | 77.2 | -207.1 |
| P/B | 17.4 | 39.5 |
| Current Ratio | 2.93 | 1.22 |
| Quick Ratio | 2.74 | 1.22 |
| D/E (Debt-to-Equity) | 0.55 | 0.92 |
| Debt-to-Assets | 28.8% | 20.5% |
| Interest Coverage | 17.8 | -4.3 |
| Asset Turnover | 0.52 | 0.86 |
| Fixed Asset Turnover | 7.68 | 19.0 |
| Payout Ratio | 0 | 0 |
| Dividend Yield | 0 | 0 |
Interpretation of the Ratios
Cadence Design Systems, Inc.
Cadence Design Systems shows strong financial health with favorable net margin (22.74%), ROE (22.58%), and ROIC (13.43%), supported by a solid current ratio of 2.93. However, its high P/E ratio of 77.2 and P/B ratio of 17.44 raise valuation concerns. The company does not pay dividends, likely focusing on reinvestment and growth.
Atlassian Corporation
Atlassian’s financial ratios reflect challenges, with unfavorable net margin (-4.92%), ROE (-19.08%), and ROIC (-4.48%), despite a favorable WACC (7.85%) and fixed asset turnover (19.02). The current ratio is neutral at 1.22. Atlassian also does not pay dividends, suggesting a reinvestment strategy in its growth phase.
Which one has the best ratios?
Cadence Design Systems exhibits a more favorable overall ratio profile, with a majority of metrics positive and only valuation ratios unfavorable. Atlassian faces more unfavorable ratios, particularly in profitability and interest coverage, leading to a slightly unfavorable global ratio opinion. Thus, Cadence’s ratios are comparatively stronger.
Strategic Positioning
This section compares the strategic positioning of Cadence Design Systems, Inc. and Atlassian Corporation including market position, key segments, and exposure to technological disruption:
Cadence Design Systems, Inc.
- Leading software provider in IC design with strong competitive pressure in semiconductor tools.
- Key segments include IC design software, functional verification, IP products, and technology services.
- Exposure to technological disruption through innovation in chip design and verification platforms.
Atlassian Corporation
- Software application leader focused on collaboration and project management facing moderate competition.
- Key segments cover project management, collaboration tools, IT service management, and developer tools.
- Exposure through cloud-based collaboration and developer platform innovations in dynamic business environments.
Cadence Design Systems, Inc. vs Atlassian Corporation Positioning
Cadence offers a diversified product portfolio spanning software, hardware, and services in semiconductor design, while Atlassian concentrates on software collaboration and project management tools. Cadence’s broader industry reach contrasts with Atlassian’s focused enterprise software approach.
Which has the best competitive advantage?
Cadence holds a slightly favorable moat by creating value despite declining profitability, whereas Atlassian shows a very unfavorable moat with declining ROIC, indicating value destruction and weaker competitive advantage.
Stock Comparison
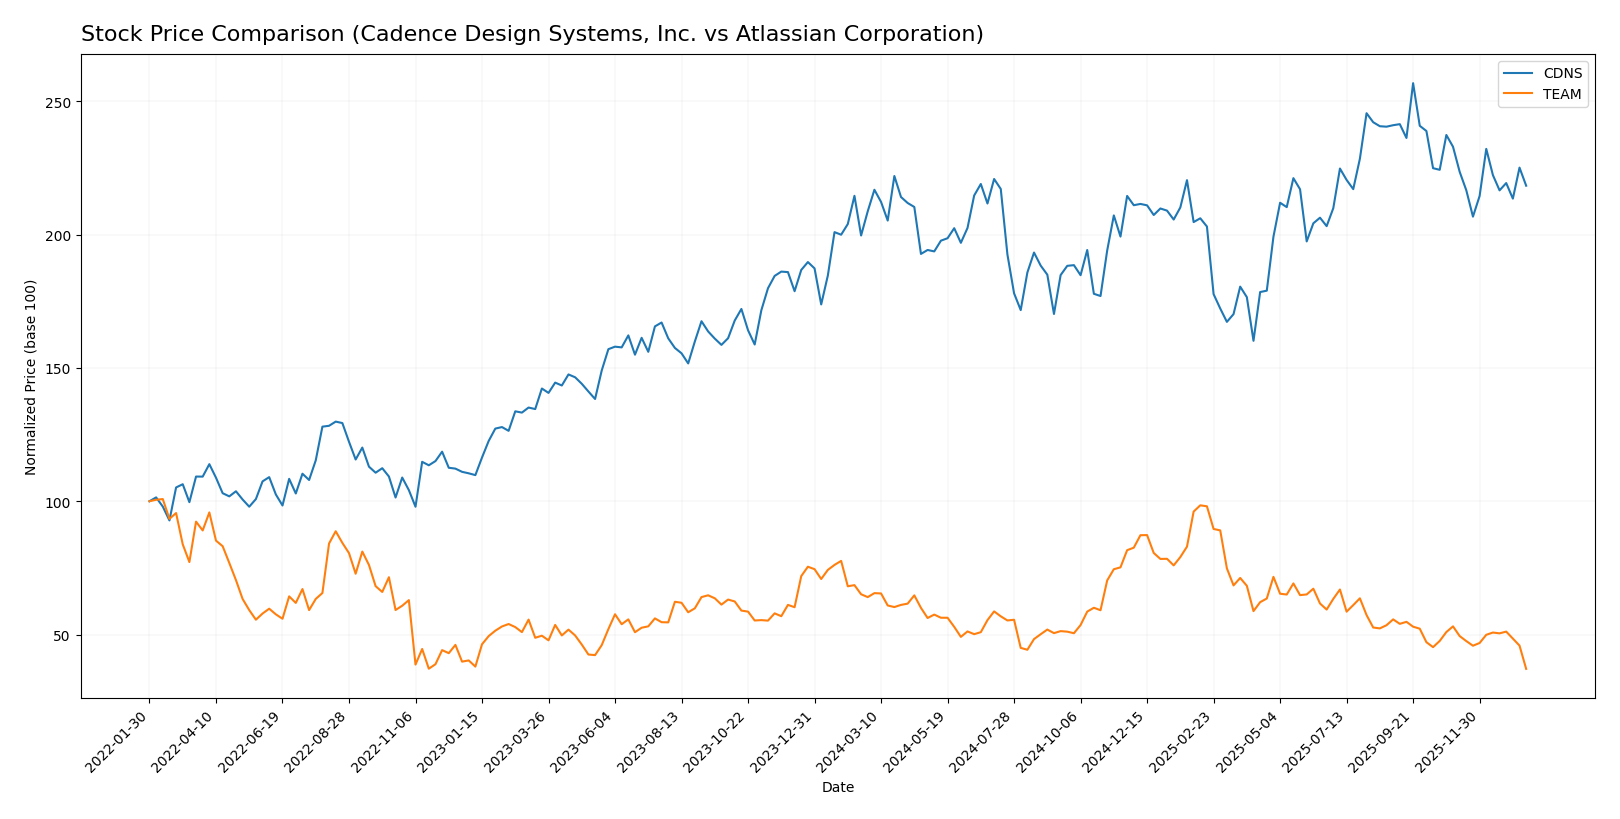
The stock prices of Cadence Design Systems, Inc. (CDNS) and Atlassian Corporation (TEAM) have displayed contrasting dynamics over the past 12 months, with CDNS showing moderate gains amid decelerating momentum, while TEAM experienced a pronounced decline and high volatility.
Trend Analysis
Cadence Design Systems, Inc. (CDNS) exhibited a bullish trend over the past year with a 4.59% price increase, though the trend shows deceleration. The stock ranged between 232.88 and 373.35, with overall volatility measured by a 29.12 standard deviation.
Atlassian Corporation (TEAM) showed a bearish trend with a 42.01% price decline over the same period, accompanied by decelerating momentum and elevated volatility, reflected in a 41.22 standard deviation. The stock’s price fluctuated between 118.55 and 314.28.
Comparing the two, CDNS delivered the highest market performance with a positive return, whereas TEAM suffered a significant loss, indicating divergent investor sentiment and market reception.
Target Prices
The current analyst consensus indicates optimistic price targets for both Cadence Design Systems, Inc. and Atlassian Corporation.
| Company | Target High | Target Low | Consensus |
|---|---|---|---|
| Cadence Design Systems, Inc. | 418 | 275 | 381 |
| Atlassian Corporation | 290 | 185 | 234.14 |
Analysts foresee Cadence Design Systems’ stock potentially rising above its current price of $317.45, with a consensus target near $381. Atlassian’s target prices also suggest upside from its current $118.55, with a consensus around $234.14.
Analyst Opinions Comparison
This section compares analysts’ ratings and grades for Cadence Design Systems, Inc. (CDNS) and Atlassian Corporation (TEAM):
Rating Comparison
CDNS Rating
- Rating: B indicating a very favorable evaluation of financial standing.
- Discounted Cash Flow Score: Moderate at 3, suggesting average valuation.
- ROE Score: Favorable at 4, showing efficient profit generation from equity.
- ROA Score: Very favorable at 5, demonstrating excellent asset utilization.
- Debt To Equity Score: Moderate at 2, indicating moderate financial risk.
- Overall Score: Moderate at 3, reflecting average overall financial health.
TEAM Rating
- Rating: C, also marked as very favorable by analysts.
- Discounted Cash Flow Score: Very favorable at 5, indicating strong valuation.
- ROE Score: Very unfavorable at 1, reflecting low profit efficiency.
- ROA Score: Very unfavorable at 1, indicating poor asset earnings efficiency.
- Debt To Equity Score: Very unfavorable at 1, suggesting higher financial risk.
- Overall Score: Moderate at 2, slightly lower than CDNS’s overall financial health.
Which one is the best rated?
Based strictly on the provided data, CDNS holds a better overall rating (B vs. C) and superior scores in ROE, ROA, and debt-to-equity. TEAM excels only in discounted cash flow, but its other scores are notably weaker.
Scores Comparison
Here is a comparison of the Altman Z-Score and Piotroski Score for Cadence Design Systems, Inc. and Atlassian Corporation:
CDNS Scores
- Altman Z-Score: 14.51, indicating a safe zone status
- Piotroski Score: 7, reflecting strong financial health
TEAM Scores
- Altman Z-Score: 4.70, indicating a safe zone status
- Piotroski Score: 5, reflecting average financial health
Which company has the best scores?
Cadence Design Systems has a significantly higher Altman Z-Score, indicating stronger financial stability, and a better Piotroski Score compared to Atlassian, suggesting stronger overall financial health based on the provided data.
Grades Comparison
The following presents the recent grades assigned by reputable grading companies for Cadence Design Systems, Inc. and Atlassian Corporation:
Cadence Design Systems, Inc. Grades
Here are the latest grades from established financial analysts for Cadence Design Systems, Inc.:
| Grading Company | Action | New Grade | Date |
|---|---|---|---|
| Needham | Maintain | Buy | 2025-12-22 |
| Wells Fargo | Maintain | Overweight | 2025-10-28 |
| Baird | Maintain | Outperform | 2025-10-28 |
| Needham | Maintain | Buy | 2025-10-28 |
| JP Morgan | Maintain | Overweight | 2025-10-28 |
| Oppenheimer | Maintain | Underperform | 2025-10-28 |
| Rosenblatt | Maintain | Neutral | 2025-10-28 |
| Rosenblatt | Maintain | Neutral | 2025-10-22 |
| Needham | Maintain | Buy | 2025-07-29 |
| Loop Capital | Maintain | Buy | 2025-07-29 |
Grades for Cadence Design Systems show a predominance of Buy, Overweight, and Outperform recommendations with some Neutral and a single Underperform rating, indicating mostly positive analyst sentiment.
Atlassian Corporation Grades
The following table summarizes the recent grades from credible grading entities for Atlassian Corporation:
| Grading Company | Action | New Grade | Date |
|---|---|---|---|
| BTIG | Maintain | Buy | 2026-01-13 |
| Piper Sandler | Maintain | Overweight | 2026-01-05 |
| Bernstein | Maintain | Outperform | 2025-11-18 |
| Macquarie | Maintain | Outperform | 2025-11-03 |
| Mizuho | Maintain | Outperform | 2025-10-31 |
| Bernstein | Maintain | Outperform | 2025-10-31 |
| TD Cowen | Maintain | Hold | 2025-10-27 |
| BMO Capital | Maintain | Outperform | 2025-10-24 |
| UBS | Maintain | Neutral | 2025-10-24 |
| Keybanc | Maintain | Overweight | 2025-10-23 |
Atlassian Corporation’s ratings mostly consist of Buy, Overweight, and Outperform grades with some Hold and Neutral ratings, reflecting a broadly favorable outlook by analysts.
Which company has the best grades?
Both companies maintain a consensus “Buy” rating, but Atlassian shows a higher frequency of Outperform grades compared to Cadence, which has more Buy and Overweight ratings. This suggests Atlassian may be viewed as having stronger growth potential, potentially affecting investor confidence and portfolio allocation.
Strengths and Weaknesses
Below is a comparative table highlighting key strengths and weaknesses of Cadence Design Systems, Inc. (CDNS) and Atlassian Corporation (TEAM) based on recent financial and operational data.
| Criterion | Cadence Design Systems, Inc. (CDNS) | Atlassian Corporation (TEAM) |
|---|---|---|
| Diversification | Focused on electronic design automation; steady growth in product and maintenance revenue (4.21B in 2024). | Primarily software and collaboration tools; revenue growth driven by license and service (4.93B in 2025). |
| Profitability | Strong profitability with 22.74% net margin and 13.43% ROIC; creating value but ROIC is declining. | Negative profitability; net margin at -4.92%, ROIC -4.48%; value destroying with declining profitability. |
| Innovation | Consistent investment in technology services; moderate innovation reflected in favorable fixed asset turnover. | Innovation driven by cloud and subscription models; however, financials indicate challenges in converting to profitability. |
| Global presence | Established international footprint with solid financial ratios and favorable liquidity (current ratio 2.93). | Growing global reach, but weaker liquidity (current ratio 1.22) and higher debt levels affect stability. |
| Market Share | Strong position in electronic design automation; stable and growing product revenue. | Leading in collaboration software with expanding subscription base, though profitability issues may hinder growth. |
Key takeaways: Cadence exhibits solid profitability and value creation despite a slight decline in ROIC, supported by strong liquidity and focus on core products. Atlassian shows impressive revenue growth but struggles with profitability and value destruction, posing higher risk for investors.
Risk Analysis
Below is a comparative risk table for Cadence Design Systems, Inc. (CDNS) and Atlassian Corporation (TEAM) based on the latest 2024-2025 data:
| Metric | Cadence Design Systems, Inc. (CDNS) | Atlassian Corporation (TEAM) |
|---|---|---|
| Market Risk | Beta 1.02, moderate volatility | Beta 0.89, lower volatility |
| Debt level | Debt-to-Equity 0.55 (neutral) | Debt-to-Equity 0.92 (neutral) |
| Regulatory Risk | Moderate, US tech sector exposure | Moderate, Australian & US markets |
| Operational Risk | Low, strong software product portfolio | Moderate, profitability challenges |
| Environmental Risk | Low, primarily software industry | Low, primarily software industry |
| Geopolitical Risk | Moderate, US-based with global clients | Moderate, exposed to global demand fluctuations |
In synthesis, Cadence Design Systems exhibits moderate market and regulatory risks but benefits from strong operational stability and financial health, including a safe Altman Z-score of 14.5. Atlassian faces higher operational risk due to negative profitability and slightly higher debt levels, despite a lower market volatility. Investors should weigh Atlassian’s growth potential against its financial challenges and Cadence’s more balanced risk profile.
Which Stock to Choose?
Cadence Design Systems, Inc. (CDNS) shows a favorable income evolution with strong revenue and net income growth over 2020-2024. Its profitability ratios like net margin (22.74%) and ROE (22.58%) are favorable, supported by low debt levels and a solid B rating, reflecting financial strength and stability.
Atlassian Corporation (TEAM) exhibits a favorable revenue growth trend but reports negative net margins (-4.92%) and ROE (-19.08%) in 2025, indicating profitability challenges. Despite manageable debt and a C rating, its financial ratios are slightly unfavorable, signaling operational and profitability risks.
Considering ratings and overall financial evaluations, CDNS might appear more favorable for investors prioritizing consistent profitability and financial stability, while TEAM could be of interest to those focused on growth potential despite higher risk and operational challenges.
Disclaimer: Investment carries a risk of loss of initial capital. The past performance is not a reliable indicator of future results. Be sure to understand risks before making an investment decision.
Go Further
I encourage you to read the complete analyses of Cadence Design Systems, Inc. and Atlassian Corporation to enhance your investment decisions: