In the rapidly evolving software industry, Autodesk, Inc. (ADSK) and Atlassian Corporation (TEAM) stand out as leaders driving innovation in application software. Autodesk specializes in 3D design and engineering solutions, while Atlassian excels in collaborative project management tools. Their overlapping focus on enhancing productivity through technology makes this comparison essential. Join me as we analyze which company offers the most compelling investment opportunity in 2026.
Table of contents
Companies Overview
I will begin the comparison between Autodesk and Atlassian by providing an overview of these two companies and their main differences.
Autodesk Overview
Autodesk, Inc. specializes in 3D design, engineering, and entertainment software and services worldwide. Its products include AutoCAD, BIM 360, and Fusion 360, catering to professionals in architecture, engineering, construction, manufacturing, and media industries. Incorporated in 1982 and headquartered in San Rafael, CA, Autodesk commands a market cap of $56.6B and employs around 15,300 people.
Atlassian Overview
Atlassian Corporation designs and licenses software products focused on project management, collaboration, and software development. Its portfolio features Jira, Confluence, Trello, and Bitbucket, targeting technical and business teams globally. Founded in 2002 and based in Sydney, Australia, Atlassian has a market cap of $31.1B and employs approximately 12,200 people.
Key similarities and differences
Both Autodesk and Atlassian operate in the technology sector, specifically in application software, serving global customers with cloud-based and licensed products. Autodesk focuses on 3D design and engineering tools for creative industries, while Atlassian emphasizes collaboration and project management software for technical teams. Their employee sizes and market caps differ, reflecting distinct market positions and product specialization.
Income Statement Comparison
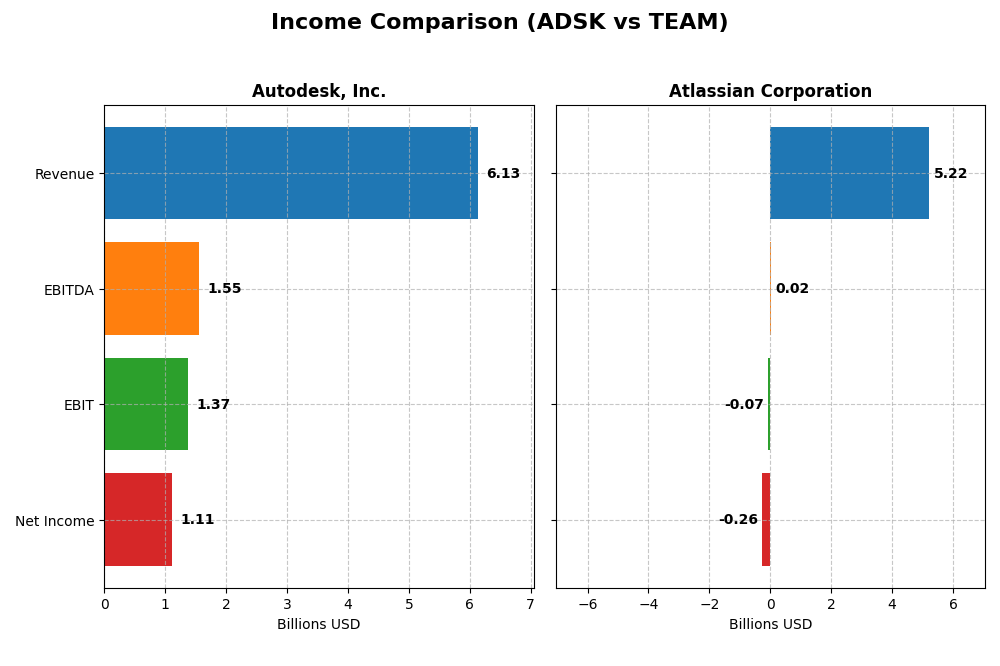
This table presents a side-by-side comparison of key income statement metrics for Autodesk, Inc. and Atlassian Corporation for their most recent fiscal years.
| Metric | Autodesk, Inc. (ADSK) | Atlassian Corporation (TEAM) |
|---|---|---|
| Market Cap | 56.6B | 31.1B |
| Revenue | 6.13B | 5.22B |
| EBITDA | 1.55B | 24.0M |
| EBIT | 1.37B | -68.3M |
| Net Income | 1.11B | -257M |
| EPS | 5.17 | -0.98 |
| Fiscal Year | 2025 | 2025 |
Income Statement Interpretations
Autodesk, Inc.
Autodesk’s revenue steadily increased from $3.79B in 2021 to $6.13B in 2025, with net income showing some volatility, notably peaking at $1.21B in 2021 before settling at $1.11B in 2025. Gross and EBIT margins remained favorable, with a 90.57% gross margin and 22.33% EBIT margin in 2025. The latest year reflected solid revenue growth of 12.7% and improved net margin to 18.14%.
Atlassian Corporation
Atlassian’s revenue surged from $2.09B in 2021 to $5.22B in 2025, supported by consistent gross margin above 80%. However, EBIT margin remained negative at -1.31% in 2025, reflecting ongoing operating losses despite revenue growth of 19.66%. Net income losses narrowed to -$257M in 2025, showing improvement compared to prior years though net margin stayed negative at -4.92%.
Which one has the stronger fundamentals?
Autodesk exhibits stronger fundamentals with consistently positive net income, high and stable margins, and favorable growth in revenues and earnings per share despite some net income decline over five years. Atlassian shows high revenue growth and improving net margin from negative territory but still posts losses and negative EBIT margins, suggesting a less stable profitability profile over the period.
Financial Ratios Comparison
This table presents a side-by-side comparison of key financial ratios for Autodesk, Inc. (ADSK) and Atlassian Corporation (TEAM) based on their most recent fiscal year data.
| Ratios | Autodesk, Inc. (ADSK) | Atlassian Corporation (TEAM) |
|---|---|---|
| ROE | 42.4% | -19.1% |
| ROIC | 18.0% | -4.5% |
| P/E | 60.2 | -207.1 |
| P/B | 25.5 | 39.5 |
| Current Ratio | 0.68 | 1.22 |
| Quick Ratio | 0.68 | 1.22 |
| D/E (Debt-to-Equity) | 0.98 | 0.92 |
| Debt-to-Assets | 23.6% | 20.5% |
| Interest Coverage | 0 | -4.3 |
| Asset Turnover | 0.57 | 0.86 |
| Fixed Asset Turnover | 21.4 | 19.0 |
| Payout Ratio | 0 | 0 |
| Dividend Yield | 0 | 0 |
Interpretation of the Ratios
Autodesk, Inc.
Autodesk shows strong profitability with a net margin of 18.14% and a high return on equity at 42.43%, indicating efficient use of shareholder capital. However, liquidity ratios are weak, with a current ratio of 0.68, suggesting potential short-term financial stress. The company does not pay dividends, likely reinvesting earnings to support growth and innovation.
Atlassian Corporation
Atlassian’s ratios reveal challenges, with negative net margin (-4.92%) and return on equity (-19.08%), reflecting current unprofitability. Liquidity appears stable with a current ratio of 1.22 and a favorable quick ratio. It pays no dividends, presumably prioritizing reinvestment and product development during its growth phase, supported by positive free cash flow.
Which one has the best ratios?
Autodesk demonstrates overall stronger profitability and capital returns, despite weaker liquidity metrics. Atlassian struggles with negative profitability and coverage ratios but maintains better liquidity and invests heavily in growth. The evaluations suggest Autodesk’s ratios are more favorable, while Atlassian’s are slightly unfavorable in comparison.
Strategic Positioning
This section compares the strategic positioning of Autodesk and Atlassian, covering Market position, Key segments, and exposure to technological disruption:
Autodesk, Inc.
- Strong market presence in software for 3D design, engineering, and entertainment; faces competitive pressure in AEC and manufacturing sectors.
- Key segments include Architecture, Engineering & Construction, AutoCAD products, and Manufacturing software; drivers are professional design and construction solutions.
- Exposed to disruption through cloud-based construction management and 3D CAD innovations; must continuously evolve digital design technologies.
Atlassian Corporation
- Significant player in software collaboration and project management with competitive pressure in cloud and agile tools.
- Key business drivers are project management, collaboration tools like Jira, Confluence, Trello, and enterprise agility solutions.
- Faces disruption risks in cloud security, agile development platforms, and enterprise collaboration innovations.
Autodesk vs Atlassian Positioning
Autodesk has a diversified product base across architecture, manufacturing, and media software, benefiting from steady demand in professional design sectors. Atlassian focuses more narrowly on software collaboration and project management, with strengths in cloud and agile tools but greater exposure to intense competition.
Which has the best competitive advantage?
Autodesk shows a very favorable moat with growing ROIC above WACC, indicating durable competitive advantage and value creation. Atlassian’s declining ROIC and value destruction suggest a very unfavorable moat and weaker competitive positioning.
Stock Comparison
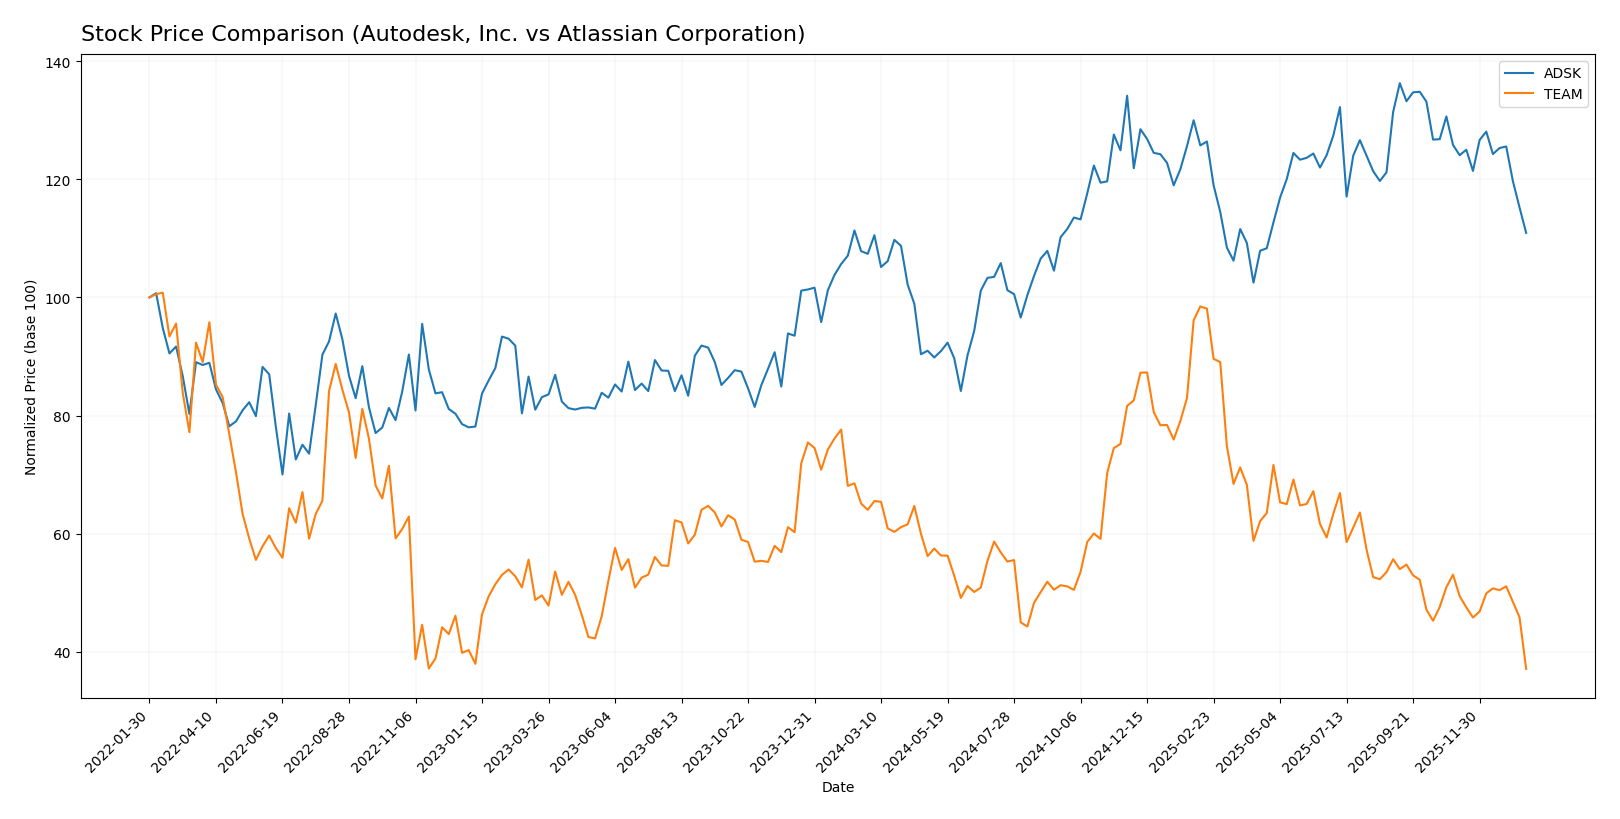
The stock price movements over the past 12 months reveal contrasting trajectories for Autodesk, Inc. and Atlassian Corporation, characterized by Autodesk’s moderate gains amid decelerating momentum and Atlassian’s pronounced decline with sustained volatility.
Trend Analysis
Autodesk, Inc. (ADSK) exhibited a bullish trend with a 3.3% price increase over the past year, despite decelerating momentum and a recent short-term drop of 11.83%. Price volatility was significant, with a 29.87 standard deviation.
Atlassian Corporation (TEAM) faced a bearish trend, declining 42.01% over the same period, with decelerating losses and a recent steep 30.03% drop. Volatility was high, reflected by a 41.22 standard deviation.
Comparing the two, Autodesk delivered higher market performance with a positive price change, whereas Atlassian’s stock suffered substantial depreciation.
Target Prices
Here is the consensus target price outlook from verified analysts for Autodesk, Inc. and Atlassian Corporation.
| Company | Target High | Target Low | Consensus |
|---|---|---|---|
| Autodesk, Inc. | 400 | 343 | 373 |
| Atlassian Corporation | 290 | 185 | 234.14 |
Analysts expect Autodesk to trade significantly above its current price of $265.69, indicating strong growth potential. Atlassian’s target consensus of $234.14 also suggests substantial upside from its current value of $118.55.
Analyst Opinions Comparison
This section compares analysts’ ratings and grades for Autodesk, Inc. and Atlassian Corporation:
Rating Comparison
ADSK Rating
- Rating: B- indicating a very favorable overall evaluation.
- Discounted Cash Flow Score: Moderate at 3, suggesting balanced valuation.
- ROE Score: Very favorable at 5, reflecting efficient profit generation.
- ROA Score: Favorable at 4, showing good asset utilization.
- Debt To Equity Score: Very unfavorable at 1, signaling high financial risk.
- Overall Score: Moderate at 3, a balanced overall financial standing.
TEAM Rating
- Rating: C, also classified as very favorable overall evaluation.
- Discounted Cash Flow Score: Very favorable at 5, indicating strong value.
- ROE Score: Very unfavorable at 1, showing weak efficiency in profit use.
- ROA Score: Very unfavorable at 1, indicating poor asset utilization.
- Debt To Equity Score: Very unfavorable at 1, also indicating high risk.
- Overall Score: Moderate at 2, slightly lower overall financial standing.
Which one is the best rated?
Based strictly on the provided ratings and scores, Autodesk, Inc. holds a better overall rating and stronger profitability metrics (ROE and ROA) despite similar financial risk. Atlassian shows a better discounted cash flow score but lags in profitability and overall score.
Scores Comparison
Here is a comparison of Autodesk and Atlassian scores based on Altman Z-Score and Piotroski Score:
ADSK Scores
- Altman Z-Score: 5.05, in the safe zone, low risk
- Piotroski Score: 8, very strong financial health
TEAM Scores
- Altman Z-Score: 4.70, in the safe zone, low risk
- Piotroski Score: 5, average financial health
Which company has the best scores?
Autodesk has higher scores overall, with a stronger Piotroski Score (8 vs. 5) and a slightly better Altman Z-Score (5.05 vs. 4.70). Both are in the safe zone for bankruptcy risk.
Grades Comparison
Here is a detailed comparison of the recent grades and ratings for Autodesk, Inc. and Atlassian Corporation:
Autodesk, Inc. Grades
The following table summarizes Autodesk’s recent grades from various reputable grading companies:
| Grading Company | Action | New Grade | Date |
|---|---|---|---|
| Barclays | Maintain | Overweight | 2025-11-26 |
| Wells Fargo | Maintain | Overweight | 2025-11-26 |
| Deutsche Bank | Upgrade | Buy | 2025-11-26 |
| B of A Securities | Maintain | Neutral | 2025-11-26 |
| Rosenblatt | Maintain | Buy | 2025-11-26 |
| Macquarie | Maintain | Outperform | 2025-11-26 |
| BMO Capital | Maintain | Market Perform | 2025-11-26 |
| Baird | Maintain | Outperform | 2025-11-26 |
| Rosenblatt | Maintain | Buy | 2025-11-24 |
| Baird | Maintain | Outperform | 2025-11-18 |
Autodesk’s grades mostly indicate a positive outlook, with multiple “Buy,” “Overweight,” and “Outperform” ratings, reflecting a generally bullish analyst sentiment.
Atlassian Corporation Grades
The following table shows Atlassian’s recent grades from reputable grading companies:
| Grading Company | Action | New Grade | Date |
|---|---|---|---|
| BTIG | Maintain | Buy | 2026-01-13 |
| Piper Sandler | Maintain | Overweight | 2026-01-05 |
| Bernstein | Maintain | Outperform | 2025-11-18 |
| Macquarie | Maintain | Outperform | 2025-11-03 |
| Mizuho | Maintain | Outperform | 2025-10-31 |
| Bernstein | Maintain | Outperform | 2025-10-31 |
| TD Cowen | Maintain | Hold | 2025-10-27 |
| BMO Capital | Maintain | Outperform | 2025-10-24 |
| UBS | Maintain | Neutral | 2025-10-24 |
| Keybanc | Maintain | Overweight | 2025-10-23 |
Atlassian’s grades are predominantly “Outperform,” “Buy,” and “Overweight,” with a few “Hold” and “Neutral” ratings, indicating a strong but slightly more mixed analyst stance.
Which company has the best grades?
Both Autodesk and Atlassian have received predominantly positive grades, with consensus ratings of “Buy.” Autodesk shows a wider range of “Buy” and “Outperform” ratings, while Atlassian’s grades lean more consistently toward “Outperform.” For investors, this suggests both stocks are viewed favorably, though Atlassian’s more uniform high ratings might indicate slightly stronger analyst confidence.
Strengths and Weaknesses
Below is a comparison of key strengths and weaknesses of Autodesk, Inc. (ADSK) and Atlassian Corporation (TEAM) based on the most recent financial and operational data.
| Criterion | Autodesk, Inc. (ADSK) | Atlassian Corporation (TEAM) |
|---|---|---|
| Diversification | Strong product diversification across Architecture, Manufacturing, Media, and CAD software segments totaling over $6B in revenue for 2025 | Concentrated revenue primarily from License and Service (~$4.9B in 2025) with smaller contributions from other segments |
| Profitability | High profitability with 18.14% net margin and 42.43% ROE, creating value with ROIC 18.01% exceeding WACC 10.42% | Negative profitability, net margin -4.92%, ROE -19.08%, ROIC -4.48%, shedding value with declining profitability |
| Innovation | Demonstrates durable competitive advantage with growing ROIC trend (+15.4%), supporting ongoing innovation | Declining ROIC trend (-132.5%) indicates challenges in maintaining innovation and competitive edge |
| Global presence | Established global footprint with broad industry applications in construction, manufacturing, and media | Strong presence in software collaboration tools but narrower market scope compared to ADSK |
| Market Share | Leading market share in CAD and engineering software segments with steady revenue growth | Significant market share in team collaboration software but experiencing financial stress impacting growth potential |
Key takeaways: Autodesk shows a robust financial and operational profile with diversified revenues and a strong economic moat, making it a value creator. Atlassian, while influential in its niche, faces profitability and value destruction challenges, requiring cautious consideration.
Risk Analysis
Below is a comparison table summarizing key risk factors for Autodesk, Inc. (ADSK) and Atlassian Corporation (TEAM) based on the latest data from 2025-2026.
| Metric | Autodesk, Inc. (ADSK) | Atlassian Corporation (TEAM) |
|---|---|---|
| Market Risk | High beta (1.47) implies volatility; Tech sector exposure | Moderate beta (0.89); tech sector but less volatile |
| Debt Level | Debt-to-assets 23.6%, moderate leverage (D/E 0.98) | Debt-to-assets 20.5%, similar leverage (D/E 0.92) |
| Regulatory Risk | Moderate, US-based with tech compliance standards | Moderate, Australia-based with global operations |
| Operational Risk | High due to complex product portfolio and cloud reliance | Moderate; service-based but affected by product integration |
| Environmental Risk | Low; limited direct environmental impact | Low; software services with minimal footprint |
| Geopolitical Risk | Moderate, US-China tensions may affect supply chains | Moderate, global presence with exposure to regional instability |
Autodesk faces the highest market risk due to its elevated beta and premium valuation metrics, while Atlassian’s negative profitability and interest coverage ratios signal operational and financial risks. Both companies maintain moderate debt levels, but Autodesk’s stronger profitability and financial scores suggest better risk absorption. Investors should weigh Autodesk’s valuation risks against Atlassian’s profitability challenges.
Which Stock to Choose?
Autodesk, Inc. (ADSK) shows a favorable income evolution with 12.7% revenue growth in 2025 and strong profitability metrics, including an 18.14% net margin and 42.43% ROE. Its debt profile is moderate, and the company holds a very favorable B- rating overall.
Atlassian Corporation (TEAM) has experienced robust revenue growth of 19.66% in 2025 but posts negative profitability, reflected in a -4.92% net margin and -19.08% ROE. The company carries less debt and has a very favorable C rating, though financial ratios lean slightly unfavorable.
Investors focused on value creation and profitability might find Autodesk’s very favorable moat and stable financial ratios more appealing, while those prioritizing growth potential despite current losses may interpret Atlassian’s stronger revenue expansion as attractive, albeit with higher risk implied by its negative returns and declining profitability.
Disclaimer: Investment carries a risk of loss of initial capital. The past performance is not a reliable indicator of future results. Be sure to understand risks before making an investment decision.
Go Further
I encourage you to read the complete analyses of Autodesk, Inc. and Atlassian Corporation to enhance your investment decisions: