Home > Comparison > Communication Services > T vs VZ
The strategic rivalry between AT&T Inc. and Verizon Communications Inc. defines the current trajectory of the Communication Services sector. AT&T operates as a diversified telecom and media conglomerate, blending wireless, broadband, and content delivery. Verizon focuses on high-quality network infrastructure and premium consumer and business connectivity services. This analysis pits diversification against network excellence to identify which path offers superior risk-adjusted returns for a balanced portfolio.
Table of contents
Companies Overview
AT&T Inc. and Verizon Communications Inc. dominate the U.S. telecommunications landscape, shaping connectivity and media consumption.
AT&T Inc.: Telecommunications and Media Powerhouse
AT&T Inc. stands as a leading provider of telecommunications, media, and technology services worldwide. Its core revenue derives from wireless voice and data services, broadband fiber, and legacy telephony, marketed under brands like AT&T and Cricket. In 2026, AT&T focuses strategically on expanding its broadband fiber footprint and enhancing cloud and security services for business clients.
Verizon Communications Inc.: Network and Technology Innovator
Verizon Communications Inc. commands a robust market position through wireless voice, data plans, and fixed residential connectivity like Fios. It generates revenue from consumer wireless services and a growing business segment offering private networking and security solutions. Verizon’s 2026 strategy centers on strengthening its 5G network and expanding enterprise cloud and IoT services.
Strategic Collision: Similarities & Divergences
Both companies emphasize wireless connectivity but differ in approach: AT&T blends media content and broadband expansion, while Verizon prioritizes network infrastructure and enterprise solutions. Their primary battleground is wireless market share and business services growth. Investors face distinct profiles—AT&T’s media integration contrasts with Verizon’s network-centric, technology-driven model.
Income Statement Comparison
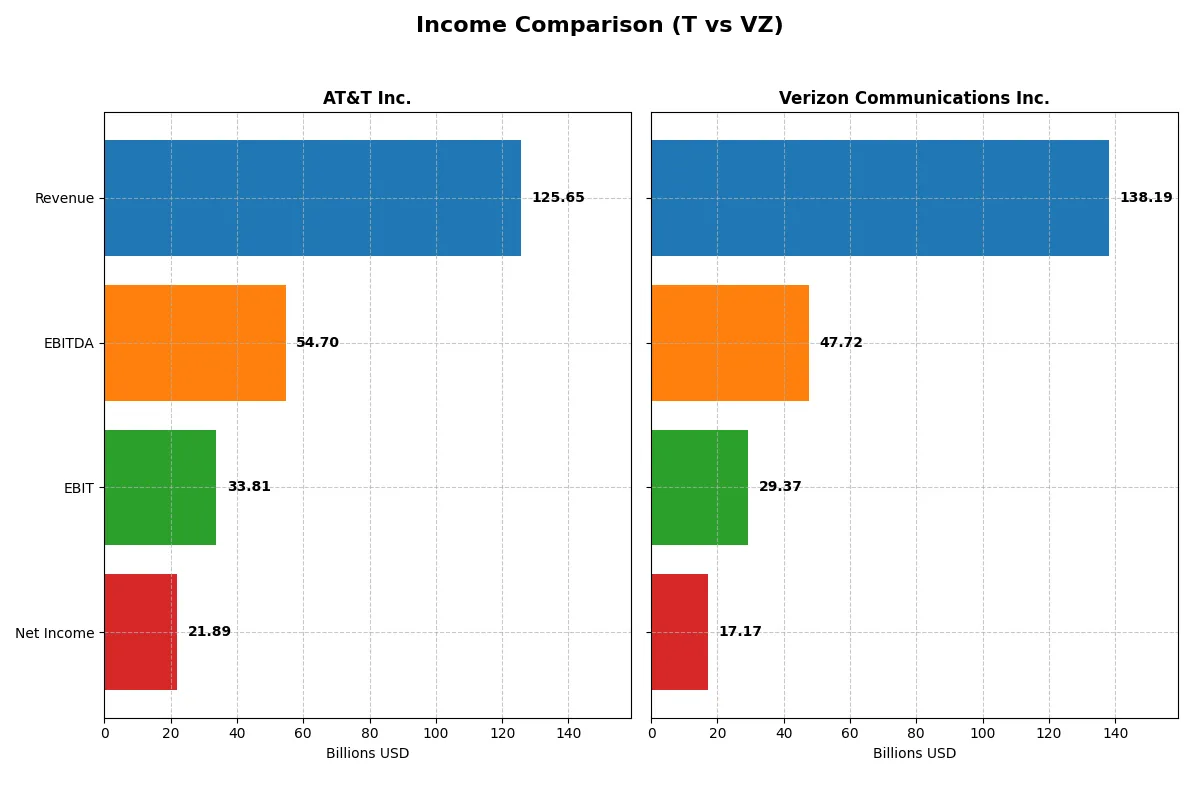
This data dissects the core profitability and scalability of both corporate engines to reveal who dominates the bottom line:
| Metric | AT&T Inc. (T) | Verizon Communications Inc. (VZ) |
|---|---|---|
| Revenue | 126B | 138B |
| Cost of Revenue | 25.4B | 75.1B |
| Operating Expenses | 76.1B | 33.8B |
| Gross Profit | 100.2B | 63.1B |
| EBITDA | 54.7B | 47.7B |
| EBIT | 33.8B | 29.4B |
| Interest Expense | 6.8B | 6.7B |
| Net Income | 21.9B | 17.2B |
| EPS | 3.04 | 4.06 |
| Fiscal Year | 2025 | 2025 |
Income Statement Analysis: The Bottom-Line Duel
The upcoming income statement comparison exposes which company runs a more efficient and profitable business engine through recent financial performance.
AT&T Inc. Analysis
AT&T’s revenue slightly grew to 125.6B in 2025, while net income surged to 21.9B, nearly doubling from the prior year. The company maintains robust margins, boasting a 79.8% gross margin and a strong 17.4% net margin. This margin expansion highlights improved cost management and operational efficiency in 2025.
Verizon Communications Inc. Analysis
Verizon posted higher revenue at 138.2B in 2025 but saw a modest net income increase to 17.2B, down from previous years. Its gross margin stands at 45.6%, with a net margin of 12.4%, reflecting tighter profitability. The slight revenue growth contrasts with declining EPS and net income trends, signaling operational headwinds.
Verdict: Margin Strength vs. Top-Line Scale
AT&T outshines with superior margin expansion and impressive net income growth despite lower revenue than Verizon. Verizon’s revenue scale is larger but lacks comparable bottom-line momentum. For investors prioritizing profitability and margin resilience, AT&T’s profile appears more compelling in this cycle.
Financial Ratios Comparison
These vital ratios act as a diagnostic tool to expose the underlying fiscal health, valuation premiums, and capital efficiency of each company:
| Ratios | AT&T Inc. (T) | Verizon Communications Inc. (VZ) |
|---|---|---|
| ROE | 17.6% | 16.4% |
| ROIC | 5.6% | 6.2% |
| P/E | 8.1 | 10.0 |
| P/B | 1.43 | 1.65 |
| Current Ratio | 0.91 | 0.91 |
| Quick Ratio | 0.86 | 0.87 |
| D/E (Debt-to-Equity) | 1.25 | 1.92 |
| Debt-to-Assets | 37% | 50% |
| Interest Coverage | 3.55 | 4.37 |
| Asset Turnover | 0.30 | 0.34 |
| Fixed Asset Turnover | 0.81 | 1.04 |
| Payout ratio | 37.4% | 66.9% |
| Dividend yield | 4.59% | 6.67% |
| Fiscal Year | 2025 | 2025 |
Efficiency & Valuation Duel: The Vital Signs
Financial ratios act as the company’s DNA, exposing hidden risks and revealing operational efficiency and valuation clarity.
AT&T Inc.
AT&T displays robust profitability with a 17.6% ROE and a healthy 17.4% net margin, signaling operational strength. Its valuation appears attractive at a P/E of 8.1 and P/B of 1.43, indicating the stock is undervalued relative to earnings. The firm rewards shareholders with a 4.6% dividend yield, reflecting solid capital allocation towards income.
Verizon Communications Inc.
Verizon posts a strong 16.4% ROE and a respectable 12.4% net margin, confirming operational efficiency. The P/E of 10.0 and P/B of 1.65 suggest a slightly higher valuation but still reasonable. Its 6.7% dividend yield points to a shareholder-friendly policy, balancing income with moderate reinvestment for growth.
Balanced Yield Meets Value Discipline
AT&T offers a compelling blend of higher profitability and lower valuation, enhancing potential risk-adjusted returns. Verizon’s stronger dividend yield and solid operational metrics suit income-focused investors. AT&T fits those prioritizing value, while Verizon appeals to those seeking steady income with moderate growth.
Which one offers the Superior Shareholder Reward?
I compare AT&T and Verizon’s shareholder rewards through dividends and buybacks. AT&T’s 2025 dividend yield stands at 4.59%, supported by a 37% payout ratio and free cash flow coverage of 1.39x, indicating sustainable payouts. Verizon yields 6.67% with a 67% payout ratio and a dividend plus capex coverage ratio of 1.30x, also sustainable but with higher leverage (debt-to-equity 1.92 vs. AT&T’s 1.25). Verizon’s free cash flow per share at 4.76 surpasses AT&T’s 2.71, supporting stronger buybacks, while AT&T’s buyback activity is more modest. Historically, Verizon balances higher yield with aggressive share repurchases, enhancing total returns. I conclude Verizon offers a superior total shareholder reward in 2026 due to higher yield and more intense buybacks, despite slightly higher financial leverage risk.
Comparative Score Analysis: The Strategic Profile
The radar chart reveals the fundamental DNA and trade-offs of AT&T Inc. and Verizon Communications Inc.:
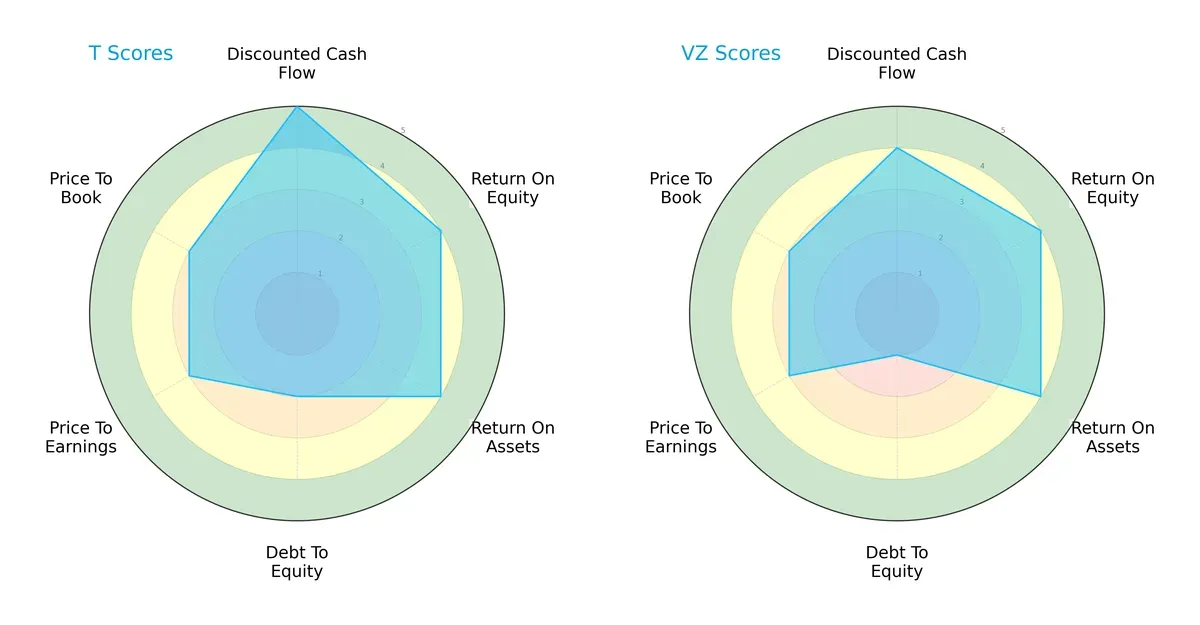
AT&T shows a more balanced profile with higher scores in discounted cash flow (5 vs. 4) and better overall ratings (4 vs. 3). Both firms match on return on equity and assets (4 each), but Verizon leads in debt-to-equity with a lower score (1 vs. 2), implying stronger financial leverage management. Valuation metrics (P/E and P/B) are identical and moderate for both. AT&T leans on cash flow strength, while Verizon relies on conservative leverage.
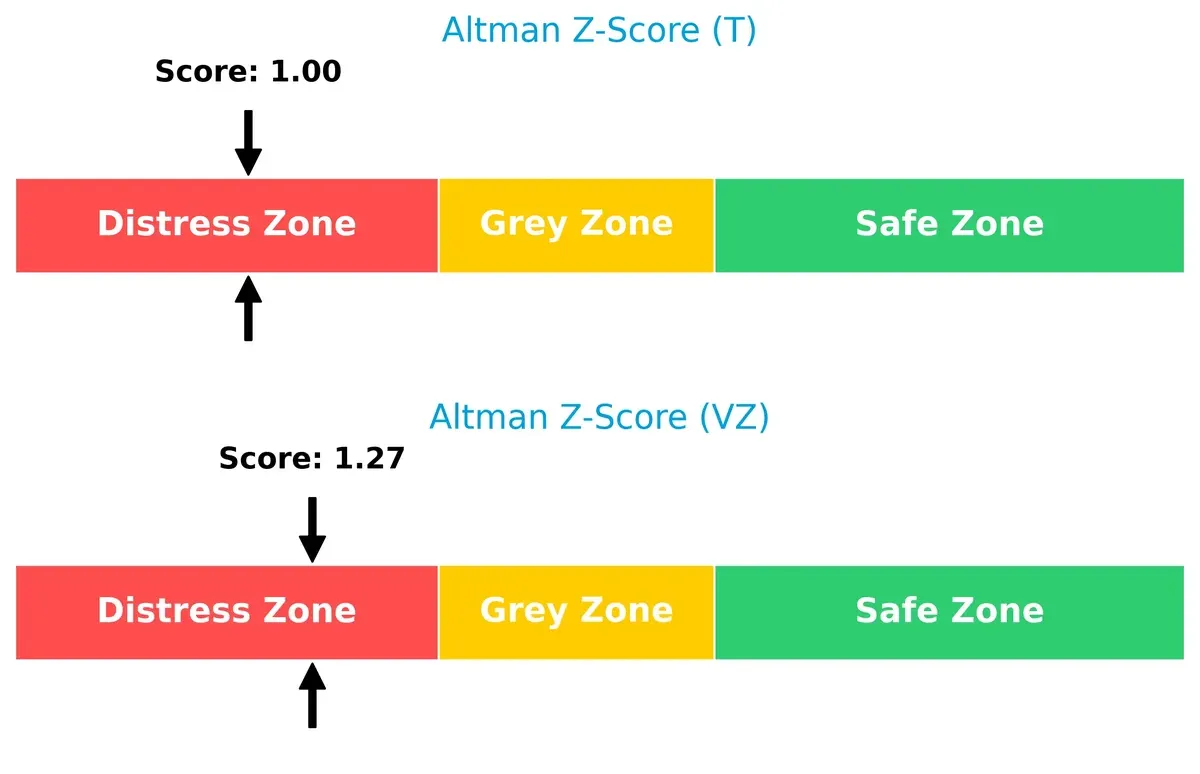
Bankruptcy Risk: Solvency Showdown
AT&T’s Altman Z-Score (0.997) trails Verizon’s (1.271), both in the distress zone, signaling heightened bankruptcy risk amid current market pressures:
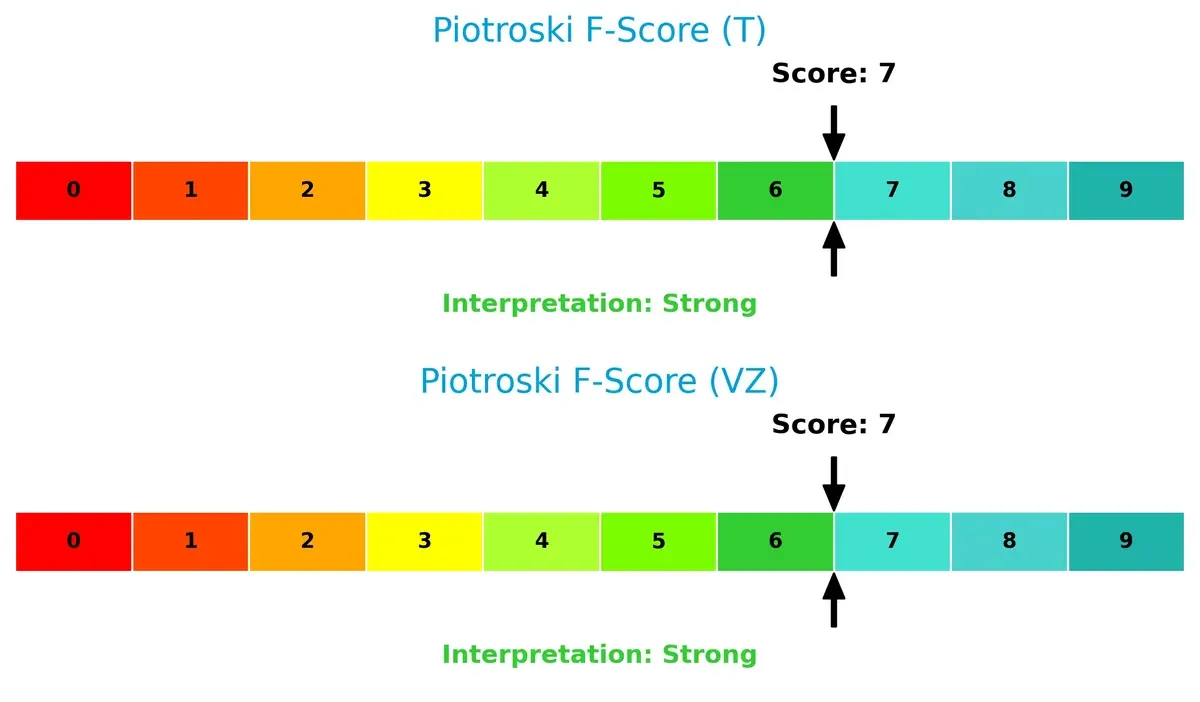
Financial Health: Quality of Operations
Both companies achieve strong Piotroski F-Scores of 7, reflecting solid operational quality and financial health without immediate red flags:
How are the two companies positioned?
This section dissects the operational DNA of AT&T and Verizon by comparing their revenue distribution and internal strengths and weaknesses. The goal is to confront their economic moats to identify which model offers the most resilient, sustainable advantage today.
Revenue Segmentation: The Strategic Mix
This visual comparison dissects how AT&T Inc. and Verizon Communications diversify their income streams and highlights their primary sector bets:
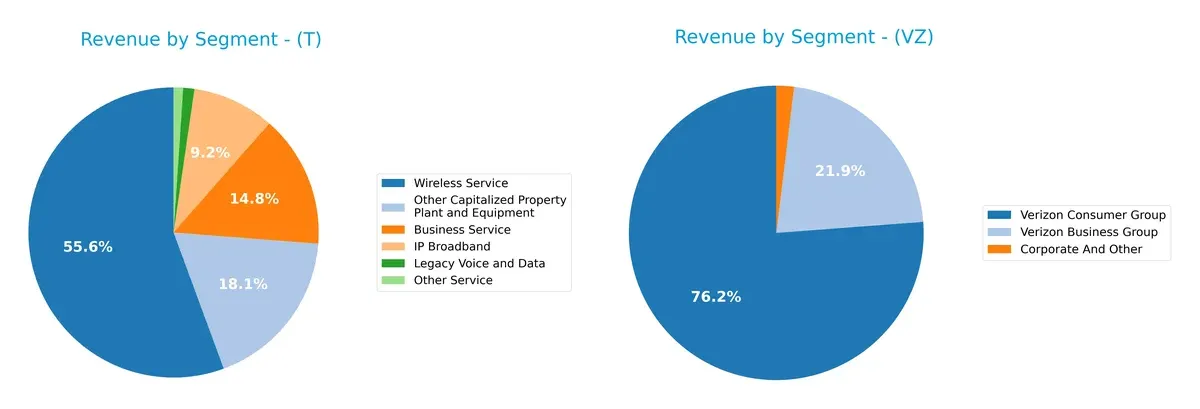
AT&T anchors its revenue in Wireless Service at $68B, but balances with significant Business Service ($18B) and IP Broadband ($11B) streams. Verizon relies heavily on its Consumer Group, generating $103B, dwarfing its Business Group at $29.5B. AT&T’s mix shows broader diversification across segments, reducing concentration risk. Verizon’s dominance in consumer wireless signals strong ecosystem lock-in, but exposes it to consumer market volatility.
Strengths and Weaknesses Comparison
This table compares the Strengths and Weaknesses of AT&T Inc. and Verizon Communications Inc.:
AT&T Inc. Strengths
- Higher net margin at 17.42%
- Favorable ROE of 17.58%
- Lower WACC at 5.24%
- Strong dividend yield at 4.59%
- Diverse business segments including wireless, broadband, and media
- Significant U.S. revenue base at $117B
Verizon Communications Inc. Strengths
- Favorable net margin at 12.43%
- Strong ROE at 16.44%
- Lower WACC at 4.07%
- Larger consumer segment revenue at $103B
- Higher asset turnover ratio at 0.34
- Consistent business and consumer group revenue streams
AT&T Inc. Weaknesses
- Low current ratio at 0.91 indicating liquidity risk
- High debt-to-equity ratio at 1.25
- Unfavorable asset turnover at 0.3 and fixed asset turnover at 0.81
- Neutral ROIC at 5.57% barely above WACC
- Exposure to legacy voice and data decline
Verizon Communications Inc. Weaknesses
- Low current ratio at 0.91 indicating liquidity constraints
- Higher debt-to-equity ratio at 1.92
- Neutral ROIC at 6.22% close to WACC
- Dividend yield neutral at 6.67%
- Limited international revenue disclosure
The comparison shows both companies maintain slightly favorable financial profiles with strengths in profitability and capital structure. However, liquidity risks and moderate asset efficiency pose challenges, underlining the importance of prudent capital allocation and operational focus in their competitive strategies.
The Moat Duel: Analyzing Competitive Defensibility
A structural moat is the only reliable shield protecting long-term profits from relentless competitive erosion in telecoms:
AT&T Inc.: Geographic Reach and Brand Switching Costs
AT&T’s primary moat lies in its vast U.S. footprint and entrenched brand switching costs. Its slightly favorable ROIC trend signals improving profitability despite shedding value. Expansion in Latin America could deepen this moat but requires vigilance.
Verizon Communications Inc.: Efficient Capital Allocation and Network Scale
Verizon’s moat stems from superior capital efficiency and a strong network scale. Unlike AT&T, it creates value with ROIC well above WACC, though profitability trends decline. Future 5G and IoT services may bolster its defensive position.
Verdict: Scale and Efficiency vs. Expanding Geographic Moat
Verizon’s deeper moat reflects stronger value creation despite shrinking ROIC, while AT&T shows promise with improving profitability but weaker capital efficiency. Verizon stands better poised to defend market share amid intensifying competition.
Which stock offers better returns?
Over the past 12 months, AT&T and Verizon exhibited strong price gains with contrasting momentum patterns and distinctive trading volumes shaping their trajectories.
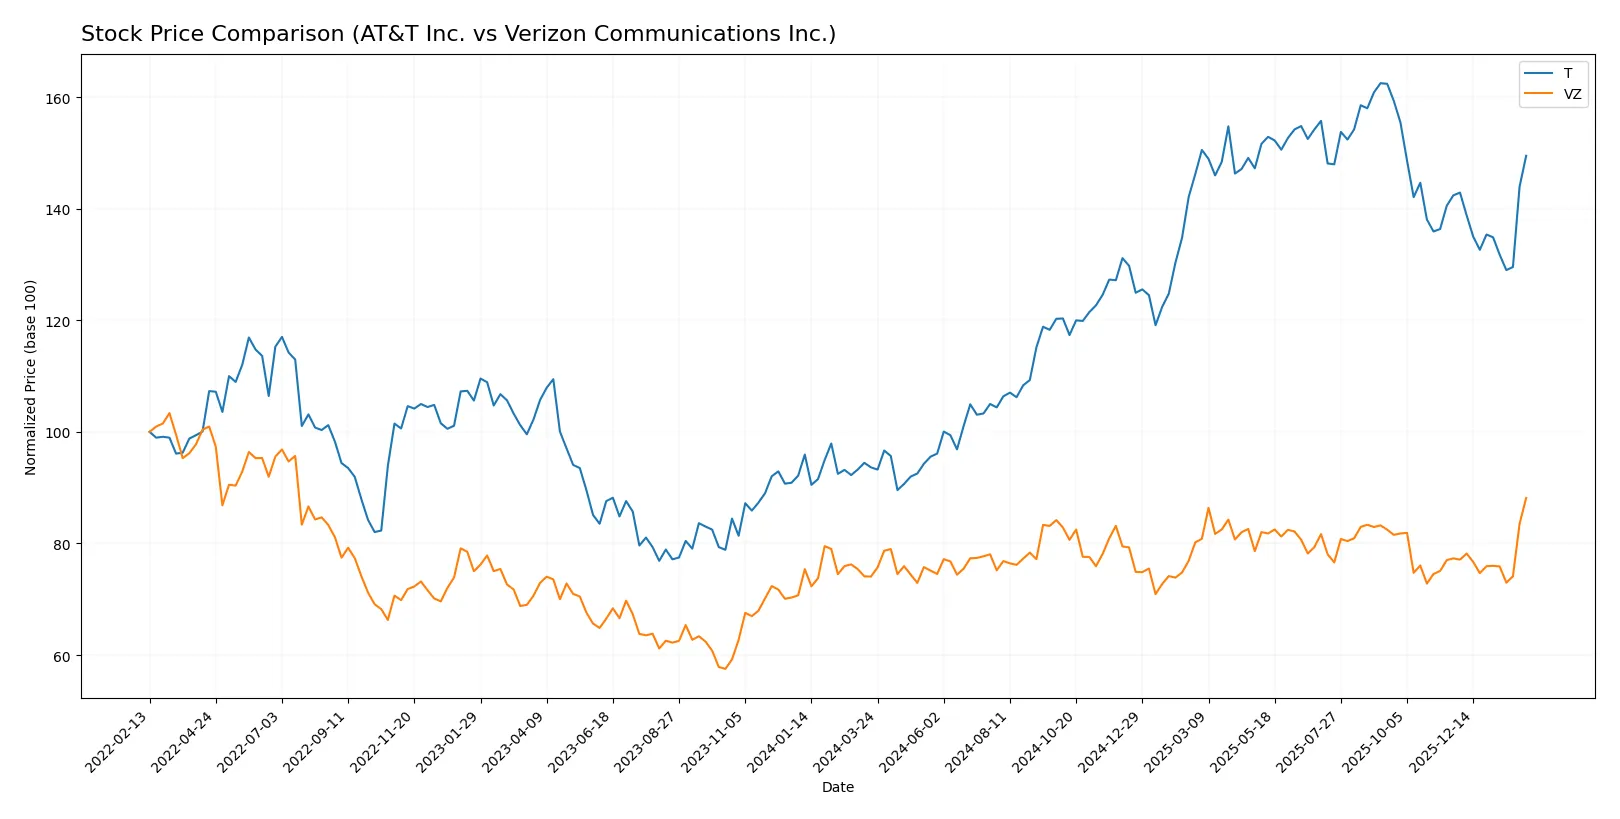
Trend Comparison
AT&T’s stock rose sharply by 59.65% over the past year, marking a bullish trend with decelerating momentum. It reached a high of 29.59 and a low of 16.31, showing moderate volatility (3.87 std dev).
Verizon gained 19.04% in the same period, also bullish but with accelerating momentum. Its price fluctuated between 37.81 and 47.01, displaying lower volatility (1.87 std dev) than AT&T.
AT&T outperformed Verizon with a higher total return, though its momentum slowed recently. Verizon’s accelerating trend and lower volatility highlight steadier gains.
Target Prices
Analysts present a cautious but optimistic target consensus for these telecom giants.
| Company | Target Low | Target High | Consensus |
|---|---|---|---|
| AT&T Inc. | 20 | 33 | 28.96 |
| Verizon Communications Inc. | 44 | 54 | 48.28 |
The consensus target prices for AT&T and Verizon imply modest upside potential from current prices of 27.22 and 47.01, respectively. Analysts expect steady performance aligned with sector norms.

Don’t Let Luck Decide Your Entry Point
Optimize your entry points with our advanced ProRealTime indicators. You’ll get efficient buy signals with precise price targets for maximum performance. Start outperforming now!
How do institutions grade them?
AT&T Inc. Grades
The following table summarizes recent grades assigned by major institutions for AT&T Inc.:
| Grading Company | Action | New Grade | Date |
|---|---|---|---|
| Wells Fargo | maintain | Overweight | 2026-01-26 |
| Bernstein | maintain | Outperform | 2026-01-16 |
| Barclays | maintain | Equal Weight | 2026-01-13 |
| Citigroup | maintain | Buy | 2025-12-22 |
| Goldman Sachs | maintain | Buy | 2025-12-19 |
| Wolfe Research | downgrade | Peer Perform | 2025-12-15 |
| Morgan Stanley | maintain | Overweight | 2025-12-10 |
| Keybanc | upgrade | Overweight | 2025-11-12 |
| Barclays | maintain | Equal Weight | 2025-10-23 |
| TD Cowen | maintain | Hold | 2025-10-23 |
Verizon Communications Inc. Grades
Here is a summary of recent institutional grades for Verizon Communications Inc.:
| Grading Company | Action | New Grade | Date |
|---|---|---|---|
| JP Morgan | maintain | Neutral | 2026-02-03 |
| Citigroup | maintain | Buy | 2026-02-03 |
| RBC Capital | maintain | Sector Perform | 2026-02-03 |
| Morgan Stanley | maintain | Equal Weight | 2026-02-02 |
| Wells Fargo | maintain | Equal Weight | 2026-02-02 |
| Evercore ISI Group | maintain | Outperform | 2026-02-02 |
| Scotiabank | maintain | Sector Perform | 2026-02-02 |
| Wells Fargo | maintain | Equal Weight | 2026-01-26 |
| Bernstein | maintain | Market Perform | 2026-01-16 |
| Morgan Stanley | maintain | Equal Weight | 2025-12-10 |
Which company has the best grades?
AT&T Inc. generally receives stronger grades, including multiple “Buy,” “Outperform,” and “Overweight” ratings. Verizon’s grades cluster around “Equal Weight,” “Sector Perform,” and “Neutral.” This suggests AT&T currently attracts more bullish institutional sentiment, potentially influencing investor confidence and portfolio allocation decisions.
Risks specific to each company
The following categories identify the critical pressure points and systemic threats facing both firms in the 2026 market environment:
1. Market & Competition
AT&T Inc.
- Operates in a highly competitive telecom sector with pressure from cable and tech entrants.
Verizon Communications Inc.
- Faces intense competition, particularly in 5G and fiber broadband markets, requiring heavy capital investment.
2. Capital Structure & Debt
AT&T Inc.
- Debt-to-equity at 1.25 shows moderate leverage but interest coverage is only neutral at 4.97x.
Verizon Communications Inc.
- Higher debt-to-equity at 1.92 raises financial risk; interest coverage weaker at 4.39x, signaling vulnerability.
3. Stock Volatility
AT&T Inc.
- Beta of 0.61 indicates moderate stock volatility, less sensitive to market swings.
Verizon Communications Inc.
- Beta of 0.32 suggests lower volatility, more defensive stock behavior amid market turbulence.
4. Regulatory & Legal
AT&T Inc.
- Subject to heavy telecom regulation and ongoing scrutiny of data privacy and net neutrality issues.
Verizon Communications Inc.
- Faces similar regulatory risks with additional exposure to global compliance in its business segment.
5. Supply Chain & Operations
AT&T Inc.
- Asset turnover low at 0.3 hints at operational inefficiencies and slower asset utilization.
Verizon Communications Inc.
- Slightly better asset turnover at 0.34 but still below sector norms, limiting operational agility.
6. ESG & Climate Transition
AT&T Inc.
- ESG initiatives in progress but slow transition to green energy could pose long-term risks.
Verizon Communications Inc.
- More aggressive in climate transition efforts, though impact on costs and margins remains uncertain.
7. Geopolitical Exposure
AT&T Inc.
- Latin America segment exposes it to emerging market volatility and regulatory unpredictability.
Verizon Communications Inc.
- Concentrated in US markets with limited direct geopolitical risks but sensitive to US-China tech tensions.
Which company shows a better risk-adjusted profile?
AT&T’s most impactful risk lies in its distressed Altman Z-Score, signaling bankruptcy risk despite solid profitability. Verizon’s critical risk is its higher debt burden combined with moderate interest coverage. While both stocks carry distress-zone bankruptcy scores, Verizon’s lower volatility and stronger ESG stance offer a marginally better risk-adjusted profile. The recent data shows AT&T’s weak liquidity ratios and operational inefficiencies as red flags, whereas Verizon’s capital structure poses greater financial strain.
Final Verdict: Which stock to choose?
AT&T Inc. stands out for its robust income generation and improving profitability, acting like a cash machine in a mature telecom sector. Its point of vigilance remains a stretched balance sheet with a below-par current ratio, which could pressure liquidity in volatile markets. It suits investors targeting aggressive growth with a tolerance for capital structure risks.
Verizon Communications Inc. boasts a strategic moat rooted in consistent value creation and a more favorable capital efficiency despite a declining ROIC trend. It presents a relatively safer profile with higher dividend yield and stronger income quality, fitting those who seek growth at a reasonable price with moderate risk exposure.
If you prioritize aggressive growth fueled by operational momentum and improving margins, AT&T is the compelling choice due to its upward earnings trajectory. However, if you seek better stability and a moat that currently creates value, Verizon offers superior capital efficiency and a steadier income stream. Both present slightly favorable prospects but cater to distinct investor archetypes.
Disclaimer: Investment carries a risk of loss of initial capital. The past performance is not a reliable indicator of future results. Be sure to understand risks before making an investment decision.
Go Further
I encourage you to read the complete analyses of AT&T Inc. and Verizon Communications Inc. to enhance your investment decisions: