Home > Comparison > Communication Services > TMUS vs T
The strategic rivalry between T-Mobile US, Inc. and AT&T Inc. shapes the dynamics of the telecommunications sector. T-Mobile operates as an agile, customer-focused wireless service provider, while AT&T combines extensive communications infrastructure with diversified media and technology services. This head-to-head highlights a clash between nimble growth and broad market penetration. This analysis will determine which company offers the superior risk-adjusted outlook for a diversified portfolio.
Table of contents
Companies Overview
T-Mobile US and AT&T Inc. stand as pivotal players shaping the U.S. telecommunications landscape.
T-Mobile US, Inc.: The Disruptive Mobile Leader
T-Mobile US dominates the U.S. mobile communications sector with 108.7M customers across postpaid, prepaid, and wholesale segments. It generates revenue primarily through voice, messaging, and data services, supported by a robust retail and digital distribution network. In 2026, its strategic focus remains on expanding 5G coverage via its extensive network of approximately 143,000 cell sites, reinforcing its competitive edge.
AT&T Inc.: The Diversified Telecom Giant
AT&T Inc. commands a broad telecommunications and media portfolio, delivering wireless voice, data, broadband fiber, and managed services globally. Its revenue streams span consumer wireless, business communications, and Latin American markets under multiple brands. In 2026, AT&T emphasizes integrating cloud solutions and expanding fiber broadband to maintain market relevance amid evolving digital demands.
Strategic Collision: Similarities & Divergences
Both companies prioritize wireless communications but diverge sharply in strategy. T-Mobile champions a customer-centric mobile service model with aggressive 5G rollout. AT&T pursues a diversified infrastructure play, blending wireless, fiber, and cloud services. Their primary battleground is U.S. wireless market share. T-Mobile’s growth profile contrasts with AT&T’s multi-segment business, offering distinct risk and opportunity dynamics for investors.
Income Statement Comparison
This data dissects the core profitability and scalability of both corporate engines to reveal who dominates the bottom line:
| Metric | T-Mobile US, Inc. (TMUS) | AT&T Inc. (T) |
|---|---|---|
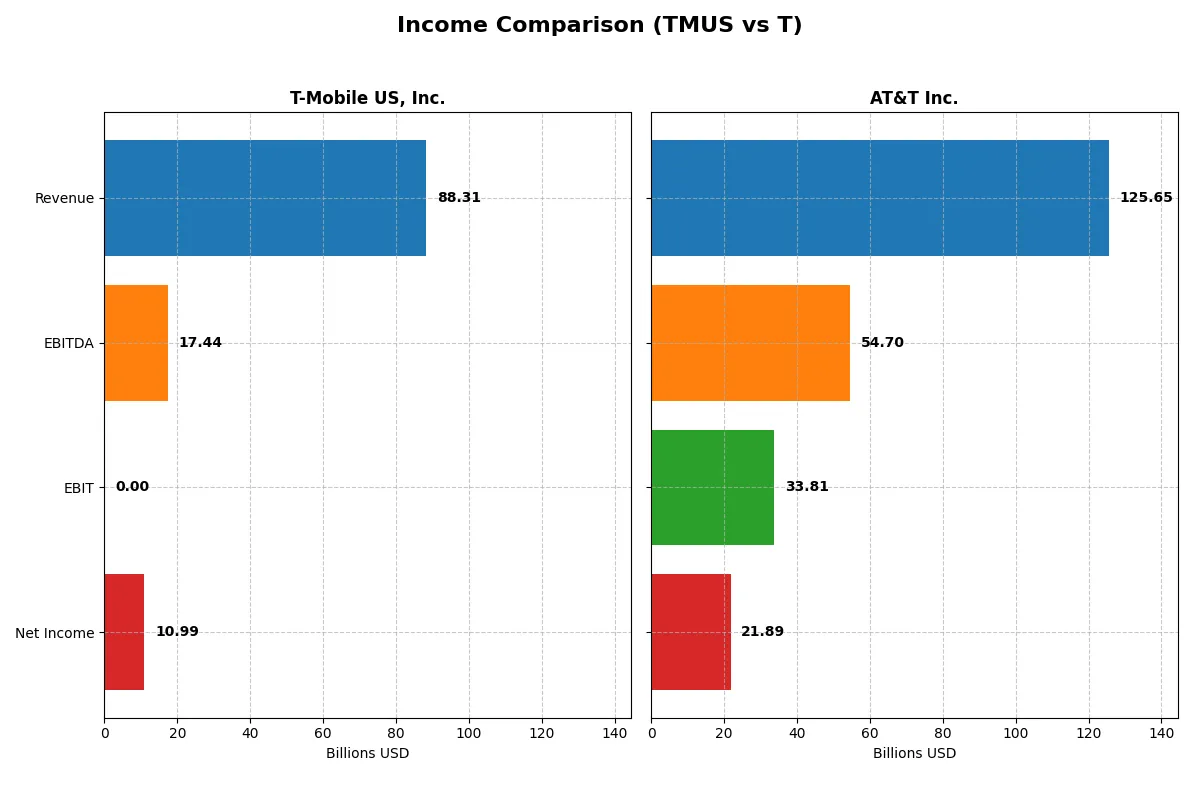
| Revenue | 88.3B | 125.6B |
| Cost of Revenue | 0 | 25.4B |
| Operating Expenses | 70.0B | 76.1B |
| Gross Profit | 0 | 100.2B |
| EBITDA | 17.4B | 54.7B |
| EBIT | 0 | 33.8B |
| Interest Expense | -3.8B | 6.8B |
| Net Income | 11.0B | 21.9B |
| EPS | 9.75 | 3.04 |
| Fiscal Year | 2025 | 2025 |
Income Statement Analysis: The Bottom-Line Duel
This income statement comparison reveals which company runs a more efficient and profitable corporate engine through recent financial performance.
T-Mobile US, Inc. Analysis
T-Mobile’s revenue climbed steadily from $80B in 2021 to $88B in 2025, with net income soaring from $3B to nearly $11B. Despite improving net margins to 12.5% in 2025, gross profit data for that year is missing, clouding margin analysis. Momentum slowed in 2025 as EBIT and gross profit growth turned negative, signaling efficiency challenges.
AT&T Inc. Analysis
AT&T’s revenue declined modestly from $134B in 2021 to $126B in 2025, yet net income rose from $20B to $22B. Gross margin remains robust at nearly 80%, with a strong 17.4% net margin in 2025. Recent years show accelerating EBIT and net margin growth, reflecting better operational leverage and effective cost control despite flat revenue.
Margin Strength vs. Revenue Growth Momentum
AT&T delivers superior margin health and operational scalability, leveraging a strong gross margin of almost 80% against T-Mobile’s incomplete gross profit data. T-Mobile exhibits faster revenue and net income growth over five years but faces recent margin compression. For investors prioritizing profitability and stable margins, AT&T’s profile is more attractive despite slower top-line growth.
Financial Ratios Comparison
These vital ratios act as a diagnostic tool to expose the underlying fiscal health, valuation premiums, and capital efficiency of the companies compared below:
| Ratios | T-Mobile US, Inc. (TMUS) | AT&T Inc. (T) |
|---|---|---|
| ROE | 18.57% | 19.80% |
| ROIC | 8.92% | 5.57% |
| P/E | 20.8 | 8.14 |
| P/B | 3.87 | 1.61 |
| Current Ratio | 1.00 | 0.91 |
| Quick Ratio | 0.90 | 0.86 |
| D/E (Debt-to-Equity) | 1.98 | 1.57 |
| Debt-to-Assets | 53.5% | 41.4% |
| Interest Coverage | -4.84 | 3.55 |
| Asset Turnover | 0.40 | 0.30 |
| Fixed Asset Turnover | 1.32 | 0.81 |
| Payout Ratio | 37.5% | 37.4% |
| Dividend Yield | 1.80% | 4.59% |
| Fiscal Year | 2025 | 2025 |
Efficiency & Valuation Duel: The Vital Signs
Financial ratios serve as a company’s DNA, uncovering hidden risks and operational strengths that numbers alone cannot reveal.
T-Mobile US, Inc.
T-Mobile posts a solid 18.6% ROE and a healthy 12.5% net margin, signaling strong profitability. Its P/E ratio of 20.8 suggests a fairly valued stock but a high P/B at 3.87 flags possible overvaluation. Dividend yield stands modest at 1.8%, reflecting a balanced approach between shareholder returns and reinvestment.
AT&T Inc.
AT&T delivers a higher ROE of 19.8% and an impressive 17.4% net margin, highlighting operational efficiency. Its P/E of 8.1 marks it as attractively priced versus peers. A 4.6% dividend yield underscores a shareholder-friendly policy. However, some leverage and liquidity ratios warrant cautious monitoring.
Valuation Stretch vs. Dividend Strength
AT&T offers better valuation and dividend returns, with fewer unfavorable ratios than T-Mobile. Meanwhile, T-Mobile’s profitability is robust but faces valuation pressure and balance sheet risks. Risk-tolerant investors may prefer T-Mobile’s growth profile; income-focused investors might lean toward AT&T’s stable yield and value.
Which one offers the Superior Shareholder Reward?
I observe that AT&T offers a higher dividend yield near 4.6%-5%, with a payout ratio around 37%-75%, reflecting strong cash return to shareholders. T-Mobile’s yield is lower at about 1.3%-1.8%, with a moderate payout ratio near 29%-37%. Both run buyback programs, but T-Mobile’s free cash flow per share (15.9 in 2025) exceeds AT&T’s (2.7), signaling more cash available for growth or buybacks. AT&T’s mature dividend model suits income investors, but T-Mobile’s reinvestment and buybacks provide a more sustainable, growth-oriented total return. For 2026, I favor T-Mobile’s balanced approach for superior long-term shareholder reward.
Comparative Score Analysis: The Strategic Profile
The radar chart reveals the fundamental DNA and trade-offs of T-Mobile US, Inc. and AT&T Inc., highlighting their core financial strengths and vulnerabilities:
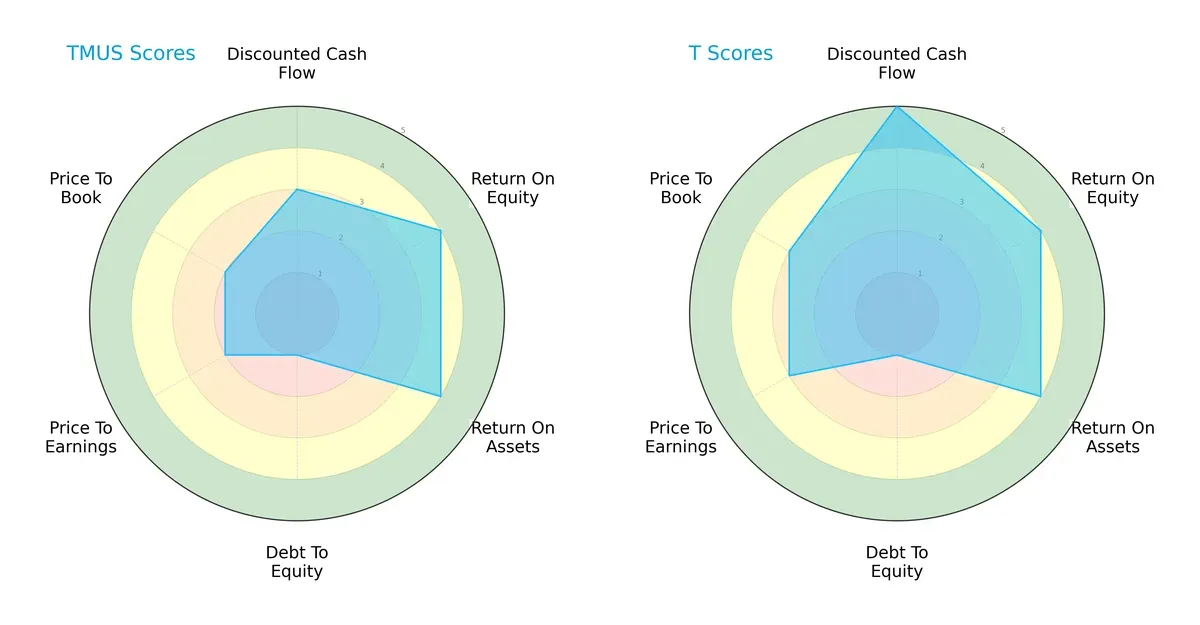
AT&T leads with a stronger overall score (4 vs. 3) and excels in discounted cash flow (5 vs. 3), signaling superior valuation appeal. Both firms show equally favorable returns on equity and assets (4 each). However, both carry very unfavorable debt-to-equity risk (score 1), reflecting heavy leverage. T-Mobile lags in valuation metrics (PE/PB scores 2 vs. AT&T’s 3), indicating a less attractive price. Overall, AT&T presents a more balanced profile, while T-Mobile leans heavily on operational efficiency but struggles with valuation and leverage.
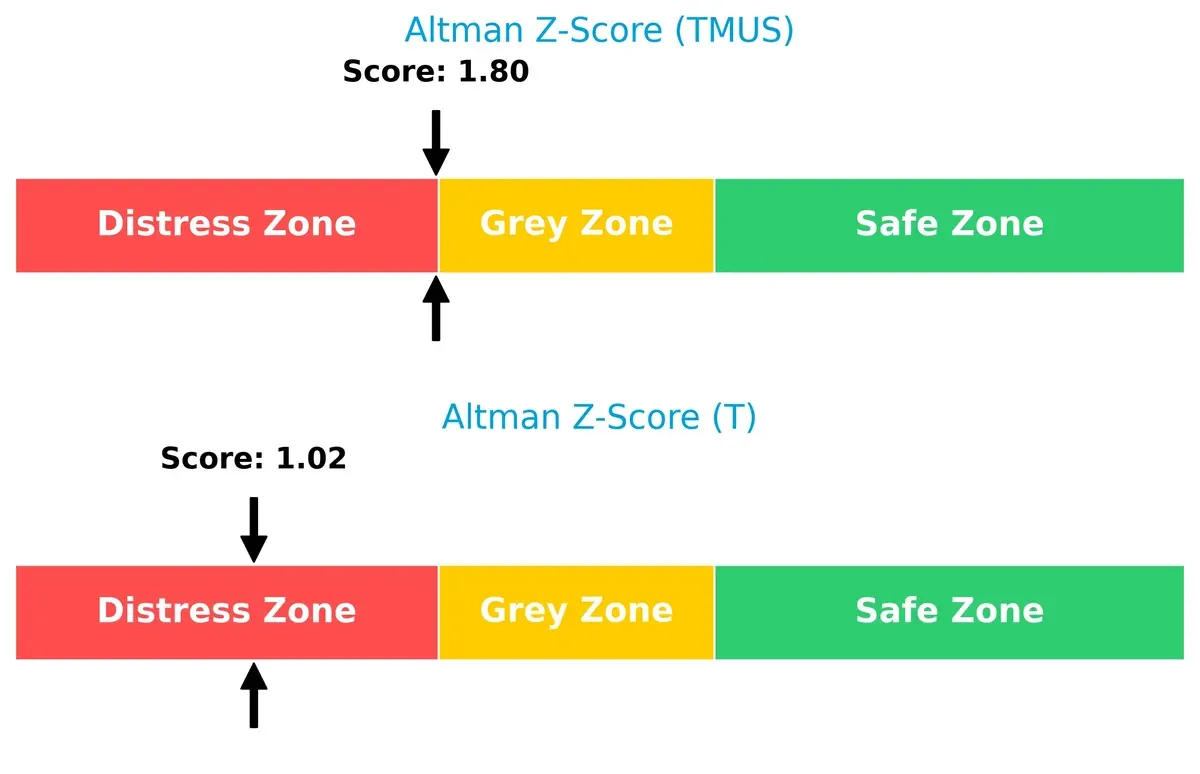
Bankruptcy Risk: Solvency Showdown
The Altman Z-Scores position both companies in the distress zone, with T-Mobile marginally better at 1.80 versus AT&T’s 1.02, indicating elevated bankruptcy risk but a slight edge for T-Mobile’s survival prospects in this cycle:
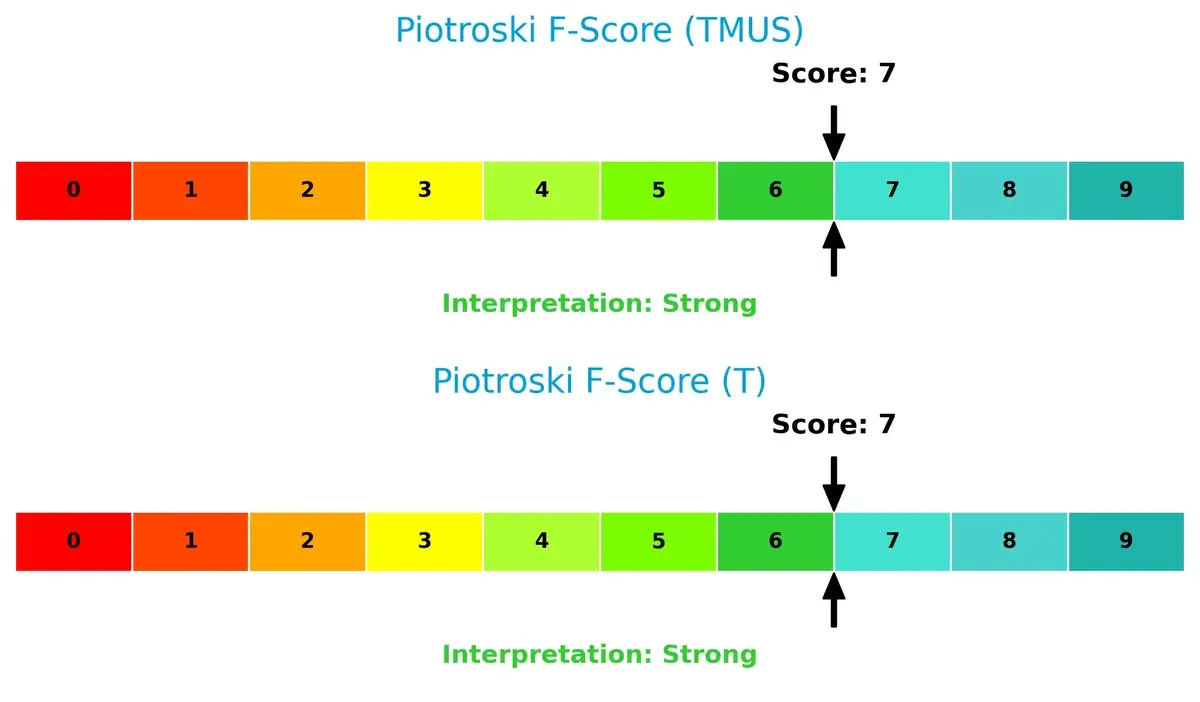
Financial Health: Quality of Operations
Both companies score a solid 7 on the Piotroski F-Score, reflecting strong financial health with no immediate red flags in profitability, leverage, or liquidity metrics. This parity suggests comparable operational quality and internal financial discipline:
How are the two companies positioned?
This section dissects the operational DNA of TMUS and T by comparing their revenue distribution across segments and analyzing their internal strengths and weaknesses. The ultimate goal is to confront their economic moats to reveal which business model delivers the most resilient, sustainable competitive advantage in today’s market.
Revenue Segmentation: The Strategic Mix
This visual comparison dissects how T-Mobile US, Inc. and AT&T Inc. diversify their income streams and reveals where their primary sector bets lie:
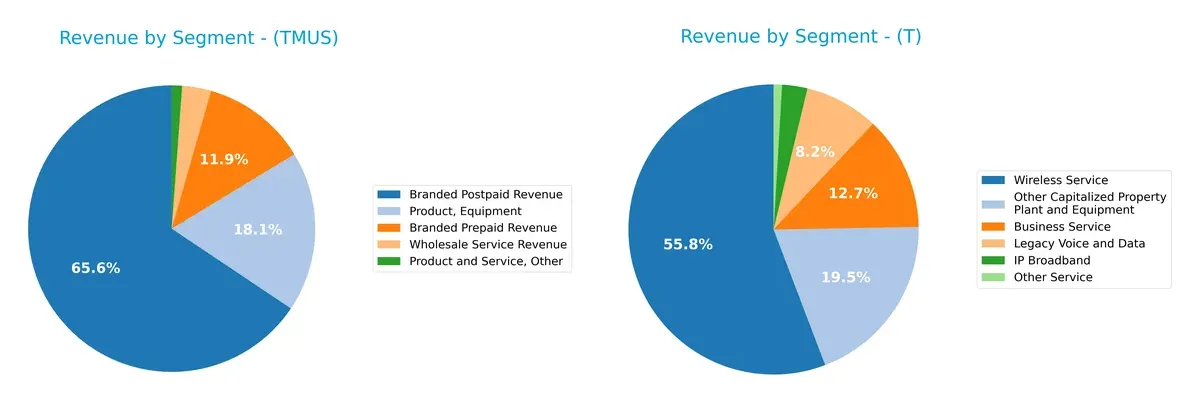
T-Mobile US anchors its revenue with $57.9B from Branded Postpaid and $16B from Product Equipment, showing moderate diversification across prepaid and wholesale. AT&T relies heavily on Wireless Service with $70.1B, dwarfing its other segments like Business Service at $16B and IP Broadband at $3.5B. T-Mobile’s mix suggests a balanced consumer focus, while AT&T’s concentration in wireless signals infrastructure dominance but raises concentration risk.
Strengths and Weaknesses Comparison
This table compares the strengths and weaknesses of T-Mobile US, Inc. (TMUS) and AT&T Inc. (T) based on diversification, profitability, financial statement, innovation, global presence, and market share:
TMUS Strengths
- Strong net margin at 12.45%
- High ROE of 18.57% indicates efficient equity use
- Favorable WACC at 4.75% supports growth investments
- Large branded postpaid revenue of 57.9B
- Diverse revenue streams including prepaid and equipment
T Strengths
- Higher net margin at 17.42%
- Stronger ROE at 19.8%
- Favorable WACC at 4.9%
- Lower PE ratio at 8.14 supports valuation appeal
- Significant dividend yield at 4.59%
- Extensive business and wireless service revenues totaling over 100B
TMUS Weaknesses
- Unfavorable PB at 3.87 suggests overvaluation
- Current ratio of 1.0 is borderline liquidity risk
- High debt-to-equity at 1.98 raises solvency concerns
- Negative interest coverage signals risk in meeting debt costs
- Weak asset turnover at 0.4 limits operational efficiency
- Slightly unfavorable overall ratio profile
T Weaknesses
- Current ratio below 1 at 0.91 indicates liquidity pressure
- Debt-to-equity at 1.57 remains elevated
- Lower ROIC at 5.57% vs WACC limits capital returns
- Unfavorable fixed asset turnover at 0.81
- Asset turnover low at 0.3 restricts revenue generation
- Neutral interest coverage at 4.97 may limit flexibility
Both companies show strong profitability and capital efficiency, but TMUS faces greater liquidity and debt risks. AT&T’s diversified business model and higher dividend yield provide income stability, yet it also wrestles with liquidity and asset efficiency challenges. These factors shape each company’s strategic priorities around financial health and growth investments.
The Moat Duel: Analyzing Competitive Defensibility
A structural moat is the only durable shield protecting long-term profits from relentless competitive erosion. Let’s dissect how two telecom giants defend their turf:
T-Mobile US, Inc.: Growth-Driven ROIC Moat
T-Mobile’s moat stems from efficient capital allocation, reflected in a ROIC 4.17% above WACC and a 177% ROIC growth trend. This fuels expanding profitability and market share. Continued innovation and 5G expansion could deepen its advantage in 2026.
AT&T Inc.: Stable Margin & Scale Moat
AT&T leans on scale and margin stability, boasting a 27% EBIT margin and 79.8% gross margin. Its ROIC barely exceeds WACC by 0.67%, signaling weaker value creation than T-Mobile. Growth in Latin America and fiber could bolster its future moat.
Verdict: ROIC Growth vs. Margin Scale
T-Mobile’s widening ROIC moat outpaces AT&T’s stable but shallow moat. T-Mobile’s superior capital efficiency equips it better to defend and grow market share in 2026. AT&T must leverage scale to catch up.
Which stock offers better returns?
Over the past 12 months, both T-Mobile US and AT&T showed strong price gains, with distinct volatility and momentum characteristics shaping their trading dynamics.
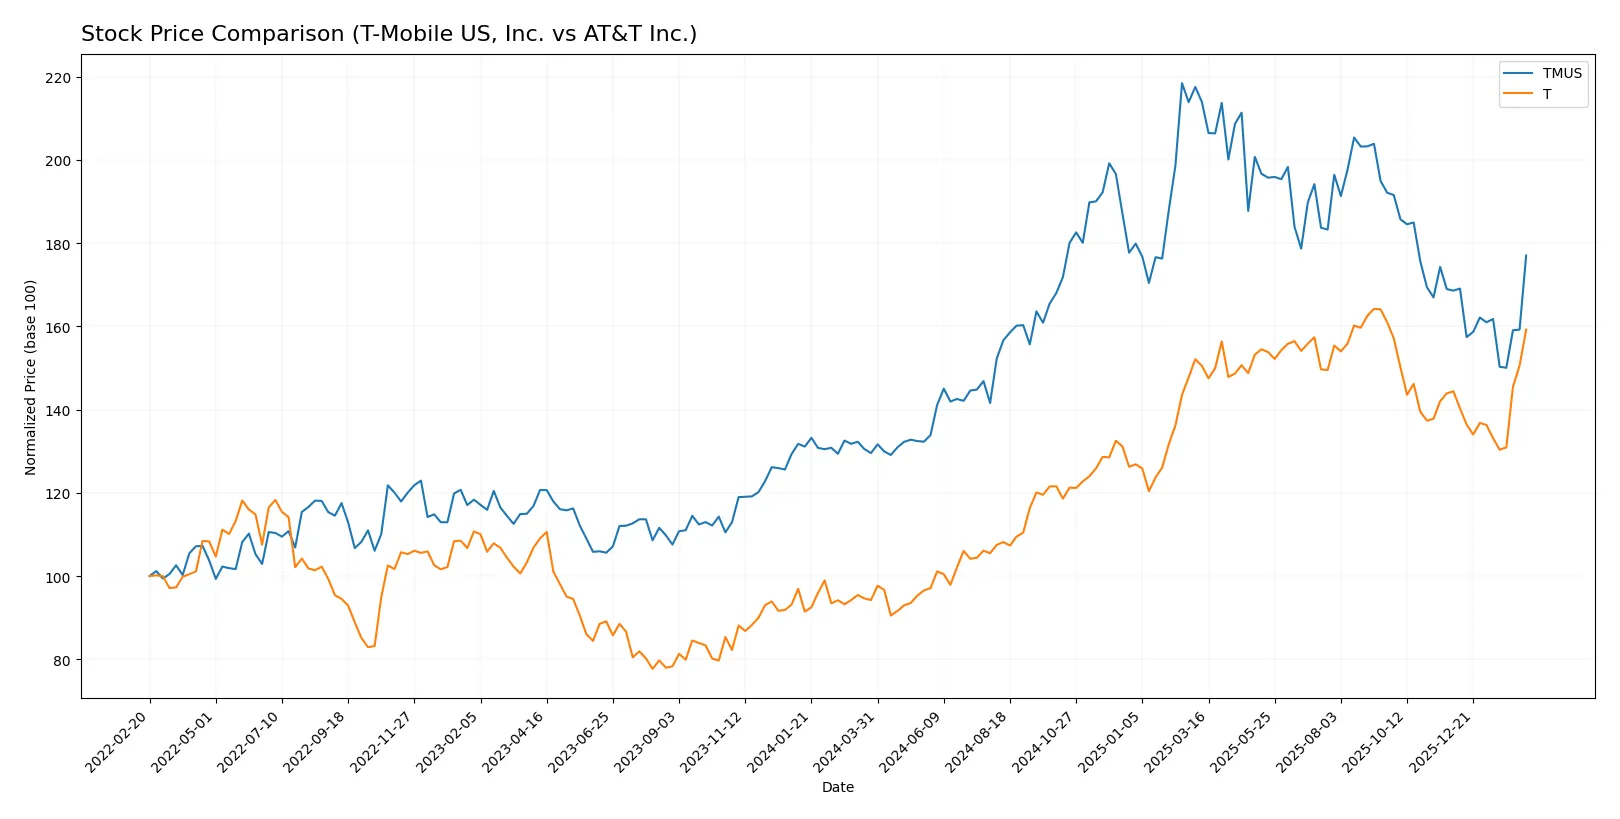
Trend Comparison
T-Mobile US’s stock rose 36.67% over the past year, signaling a bullish trend with decelerating momentum. It ranged between $160.05 and $270.82 with a high volatility of 30.2%.
AT&T’s stock surged 68.96%, reflecting a bullish trend with accelerating momentum. The price fluctuated from $16.31 to $29.59, showing lower volatility at 3.85%.
AT&T outperformed T-Mobile US over the year, delivering nearly double the percentage gain with steadier price movement and accelerating upward momentum.
Target Prices
Analysts present a cautiously optimistic consensus for both T-Mobile US and AT&T Inc.
| Company | Target Low | Target High | Consensus |
|---|---|---|---|
| T-Mobile US, Inc. | 235 | 310 | 259 |
| AT&T Inc. | 20 | 33 | 29.12 |
T-Mobile’s consensus target of 259 indicates a 18% upside from its current 219.5 price. AT&T’s consensus at 29.12 is modestly above its 28.69 price, suggesting limited near-term appreciation.

Don’t Let Luck Decide Your Entry Point
Optimize your entry points with our advanced ProRealTime indicators. You’ll get efficient buy signals with precise price targets for maximum performance. Start outperforming now!
How do institutions grade them?
Here is the comparison of institutional grades for T-Mobile US, Inc. and AT&T Inc.:
T-Mobile US, Inc. Grades
The following table summarizes recent institutional grades for T-Mobile US, Inc.:
| Grading Company | Action | New Grade | Date |
|---|---|---|---|
| Wells Fargo | Maintain | Overweight | 2026-02-13 |
| Barclays | Maintain | Overweight | 2026-02-12 |
| Scotiabank | Maintain | Sector Outperform | 2026-02-12 |
| Wells Fargo | Maintain | Overweight | 2026-01-26 |
| Bernstein | Maintain | Market Perform | 2026-01-16 |
| Citigroup | Maintain | Neutral | 2025-12-19 |
| Goldman Sachs | Maintain | Buy | 2025-12-12 |
| Morgan Stanley | Maintain | Overweight | 2025-12-10 |
| Argus Research | Maintain | Buy | 2025-12-09 |
| Keybanc | Upgrade | Sector Weight | 2025-12-02 |
AT&T Inc. Grades
The following table summarizes recent institutional grades for AT&T Inc.:
| Grading Company | Action | New Grade | Date |
|---|---|---|---|
| Wells Fargo | Maintain | Overweight | 2026-01-26 |
| Bernstein | Maintain | Outperform | 2026-01-16 |
| Barclays | Maintain | Equal Weight | 2026-01-13 |
| Citigroup | Maintain | Buy | 2025-12-22 |
| Goldman Sachs | Maintain | Buy | 2025-12-19 |
| Wolfe Research | Downgrade | Peer Perform | 2025-12-15 |
| Morgan Stanley | Maintain | Overweight | 2025-12-10 |
| Keybanc | Upgrade | Overweight | 2025-11-12 |
| Barclays | Maintain | Equal Weight | 2025-10-23 |
| TD Cowen | Maintain | Hold | 2025-10-23 |
Which company has the best grades?
T-Mobile US, Inc. holds consistently strong grades, with multiple Overweight and Buy ratings. AT&T Inc. also receives solid grades but includes more varied ratings, such as Equal Weight and Peer Perform. Investors may perceive T-Mobile’s grades as more bullish, potentially reflecting stronger market confidence.
Risks specific to each company
The following categories identify critical pressure points and systemic threats facing T-Mobile US, Inc. and AT&T Inc. in the 2026 market environment:
1. Market & Competition
T-Mobile US, Inc.
- Competes aggressively in U.S. mobile services with 108.7M customers, facing intense pricing pressure.
AT&T Inc.
- Operates broader telecom and media services globally, battling legacy business decline and cord-cutting trends.
2. Capital Structure & Debt
T-Mobile US, Inc.
- High debt-to-assets at 53.5% and debt/equity of 1.98 signal elevated leverage and refinancing risks.
AT&T Inc.
- Lower leverage with 41.4% debt-to-assets and 1.57 debt/equity, yet still elevated for telecom standards.
3. Stock Volatility
T-Mobile US, Inc.
- Beta of 0.43 indicates lower volatility and relative stability compared to the market.
AT&T Inc.
- Beta of 0.61 shows moderately higher volatility, reflecting broader operational risks.
4. Regulatory & Legal
T-Mobile US, Inc.
- Faces standard telecom regulatory scrutiny in the U.S., including spectrum and privacy policies.
AT&T Inc.
- Exposed to additional regulatory risks in international markets and media ownership rules.
5. Supply Chain & Operations
T-Mobile US, Inc.
- Relies heavily on network infrastructure expansion; asset turnover low at 0.4 signals operational inefficiency.
AT&T Inc.
- Lower asset turnover at 0.3 and fixed asset turnover 0.81 indicate operational sluggishness amid legacy assets.
6. ESG & Climate Transition
T-Mobile US, Inc.
- Moderate ESG exposure; climate transition risks tied to network energy consumption and e-waste management.
AT&T Inc.
- Larger global footprint implies greater ESG complexity, including climate risks in emerging markets.
7. Geopolitical Exposure
T-Mobile US, Inc.
- Primarily U.S.-focused, limiting direct geopolitical risks but vulnerable to domestic policy shifts.
AT&T Inc.
- Significant international presence, especially in Latin America, exposes AT&T to currency and geopolitical volatility.
Which company shows a better risk-adjusted profile?
AT&T’s most impactful risk is its exposure to legacy business decline and international regulatory complexity. T-Mobile’s key risk lies in its high leverage and operational inefficiencies. AT&T’s slightly favorable financial ratios and diversified services offer a better risk-adjusted profile in 2026, despite its challenges. Meanwhile, T-Mobile’s distress-zone Altman Z-score and high debt levels warrant caution.
Final Verdict: Which stock to choose?
T-Mobile US, Inc. (TMUS) showcases an impressive superpower in its ability to create value through a growing ROIC well above its cost of capital. This suggests efficient capital allocation and a sustainable competitive edge. However, its balance sheet leverage and liquidity ratios signal a point of vigilance. TMUS suits investors targeting aggressive growth with tolerance for financial risk.
AT&T Inc. (T) stands out with a strategic moat rooted in strong recurring revenue and an attractive dividend yield. Its valuation metrics are more reasonable, reflecting a safer profile compared to TMUS. While its ROIC slightly trails its WACC, it shows improving profitability and offers better stability. T fits portfolios focused on GARP—growth at a reasonable price—and income generation.
If you prioritize dynamic value creation and accelerating growth, TMUS is the compelling choice due to its very favorable moat and rising returns. However, if you seek a blend of income with moderate growth and lower volatility, AT&T offers better stability and a defensive edge. Both present distinct analytical scenarios aligned with different risk appetites and investment horizons.
Disclaimer: Investment carries a risk of loss of initial capital. The past performance is not a reliable indicator of future results. Be sure to understand risks before making an investment decision.
Go Further
I encourage you to read the complete analyses of T-Mobile US, Inc. and AT&T Inc. to enhance your investment decisions: