Home > Comparison > Communication Services > T vs CMCSA
The strategic rivalry between AT&T Inc. and Comcast Corporation defines the current trajectory of the Communication Services sector. AT&T operates as a capital-intensive telecommunications provider with a broad portfolio of wireless and media assets. Comcast, by contrast, blends cable communications with expansive media and entertainment ventures. This analysis will assess which company’s operational model offers superior risk-adjusted returns for a diversified portfolio amid evolving industry dynamics.
Table of contents
Companies Overview
AT&T Inc. and Comcast Corporation stand as major forces in the global telecommunications and media landscape. Both companies command vast customer bases and diversified service portfolios that define industry standards.
AT&T Inc.: Global Telecommunications Powerhouse
AT&T Inc. dominates the telecommunications services sector with a strong focus on wireless voice and data services. Its revenue primarily stems from wireless communications, broadband fiber, and legacy telephony for residential and business customers. In 2026, AT&T strategically emphasizes expanding its fiber broadband network and enhancing cloud and security solutions to serve multinational corporations and mid-sized businesses.
Comcast Corporation: Integrated Media and Technology Leader
Comcast leads as a diversified media and technology company with revenue generated through its Cable Communications and Media segments. It offers broadband, video, voice, and streaming services under the Xfinity and NBCUniversal brands. In 2026, Comcast focuses on growing its streaming platform Peacock and expanding its theme parks and direct-to-consumer services, blending entertainment with telecommunications.
Strategic Collision: Similarities & Divergences
AT&T and Comcast both pursue convergence of telecommunications with media but follow distinct philosophies. AT&T relies on a network-centric model prioritizing infrastructure, while Comcast integrates content creation with distribution in a vertically integrated ecosystem. Their primary battleground remains broadband and streaming services competition. This shapes contrasting investment profiles: AT&T appeals to infrastructure-driven investors, Comcast to growth-oriented stakeholders seeking media exposure.
Income Statement Comparison
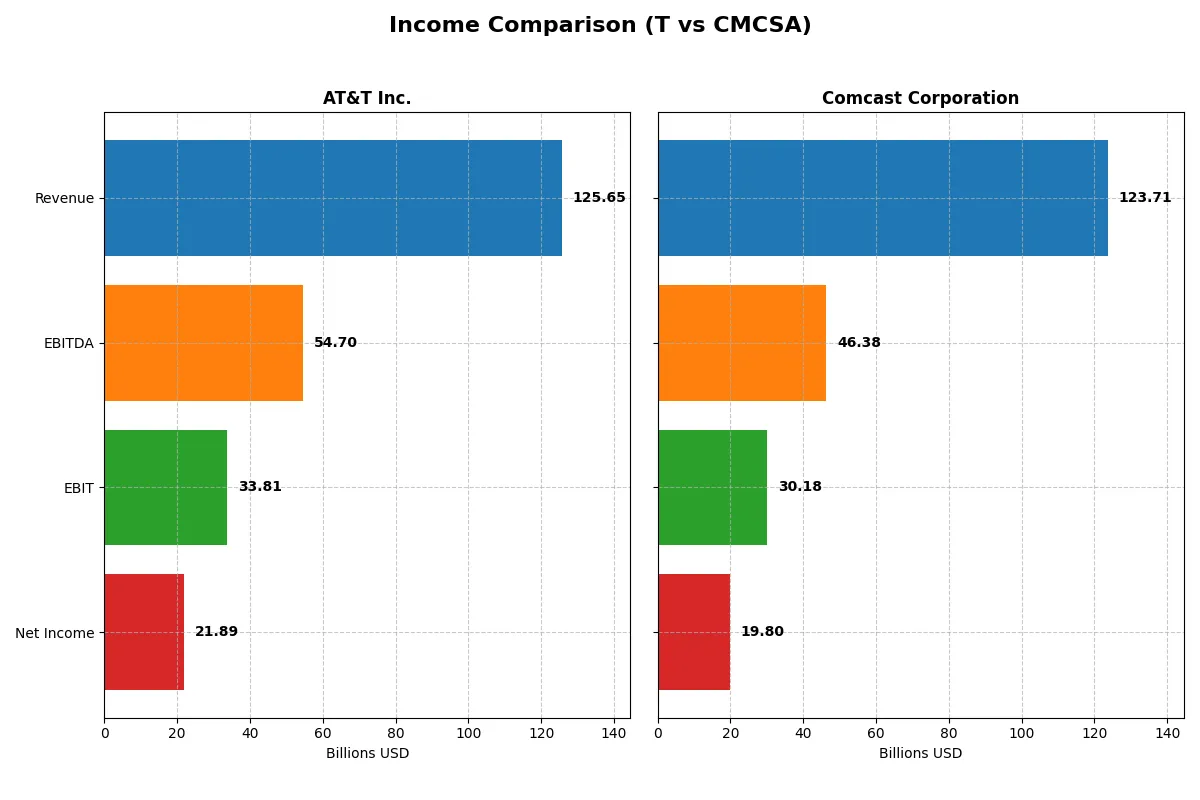
This data dissects the core profitability and scalability of both corporate engines to reveal who dominates the bottom line:
| Metric | AT&T Inc. (T) | Comcast Corporation (CMCSA) |
|---|---|---|
| Revenue | 126B | 124B |
| Cost of Revenue | 25.4B | 49.4B |
| Operating Expenses | 76.1B | 53.6B |
| Gross Profit | 100.2B | 74.3B |
| EBITDA | 54.7B | 46.4B |
| EBIT | 33.8B | 30.2B |
| Interest Expense | 6.8B | 4.4B |
| Net Income | 21.9B | 19.8B |
| EPS | 3.04 | 5.41 |
| Fiscal Year | 2025 | 2025 |
Income Statement Analysis: The Bottom-Line Duel
This income statement comparison reveals how efficiently each company converts revenue into profit, exposing true operational strength.
AT&T Inc. Analysis
AT&T’s revenue hovers around 125B in 2025, showing a slight 2.7% yearly increase but a 6.3% decline over five years. Net income surged to 21.9B in 2025, doubling from the prior year, boosting net margins to a robust 17.4%. The company excels in gross margin efficiency at nearly 80%, reflecting strong cost control and operational momentum.
Comcast Corporation Analysis
Comcast generated 124B in revenue in 2025 with virtually flat growth year-over-year but a modest 6.3% rise across five years. Net income climbed 22% in 2025 to 19.8B, lifting net margins to 16%. Gross margin stands at 60%, lower than AT&T’s, but Comcast shows better interest expense control and a consistent upward EPS trend, signaling steady profit expansion.
Margin Dominance vs. Steady Growth
AT&T leads with superior margin profiles, driven by high gross and net margins and remarkable net income growth in 2025. Comcast, however, shows steadier revenue growth and a healthier interest expense ratio, supporting sustained earnings expansion. Investors favoring margin power may lean toward AT&T, while those prioritizing consistent top-line growth and profitability might prefer Comcast’s profile.
Financial Ratios Comparison
These vital ratios act as a diagnostic tool to expose the underlying fiscal health, valuation premiums, and capital efficiency of the companies compared below:
| Ratios | AT&T Inc. (T) | Comcast Corporation (CMCSA) |
|---|---|---|
| ROE | 17.6% | 20.4% |
| ROIC | 5.6% | 9.9% |
| P/E | 8.14 | 5.14 |
| P/B | 1.43 | 1.05 |
| Current Ratio | 0.91 | 0.88 |
| Quick Ratio | 0.86 | 0.88 |
| D/E (Debt-to-Equity) | 1.25 | 0.06 |
| Debt-to-Assets | 36.9% | 3.2% |
| Interest Coverage | 3.55 | 4.69 |
| Asset Turnover | 0.30 | 0.66 |
| Fixed Asset Turnover | 0.81 | 1.88 |
| Payout ratio | 37.4% | 24.7% |
| Dividend yield | 4.59% | 4.81% |
| Fiscal Year | 2025 | 2025 |
Efficiency & Valuation Duel: The Vital Signs
Ratios serve as a company’s DNA, exposing hidden risks and operational strengths beyond surface-level financials.
AT&T Inc.
AT&T posts a solid 17.58% ROE and a 17.42% net margin, signaling strong profitability. Its P/E of 8.14 and P/B of 1.43 indicate a fairly valued, not stretched stock. The 4.59% dividend yield reflects a shareholder-friendly policy, balancing payouts with moderate reinvestment.
Comcast Corporation
Comcast delivers superior efficiency with a 20.44% ROE and a healthy 16.01% net margin. Its valuation appears attractive, featuring a low P/E of 5.14 and P/B of 1.05. Comcast supports growth and shareholder returns through a 4.81% dividend yield, alongside disciplined capital management.
Balanced Efficiency Meets Valuation Discipline
Comcast leads with higher profitability and a more favorable debt profile, suggesting better operational efficiency. AT&T offers stable returns with a slightly higher risk due to leverage and weaker liquidity. Growth-oriented investors may prefer Comcast’s profile, while income-focused investors might lean toward AT&T’s steady dividends.
Which one offers the Superior Shareholder Reward?
I compare AT&T and Comcast’s shareholder reward by examining dividend yields, payout ratios, and buyback intensity. AT&T yields ~4.6% with a payout ratio near 37%, showing solid free cash flow coverage and steady dividends. Comcast yields ~4.8% with a lower payout ratio around 25%, retaining more cash for buybacks and growth. Comcast’s buyback program is more aggressive, boosting total returns sustainably. AT&T’s higher leverage and lower cash ratios raise risk. I find Comcast offers a better combination of yield, buybacks, and sustainability, making it the superior total return choice in 2026.
Comparative Score Analysis: The Strategic Profile
The radar chart reveals the fundamental DNA and trade-offs of AT&T Inc. and Comcast Corporation, highlighting their financial strengths and vulnerabilities:
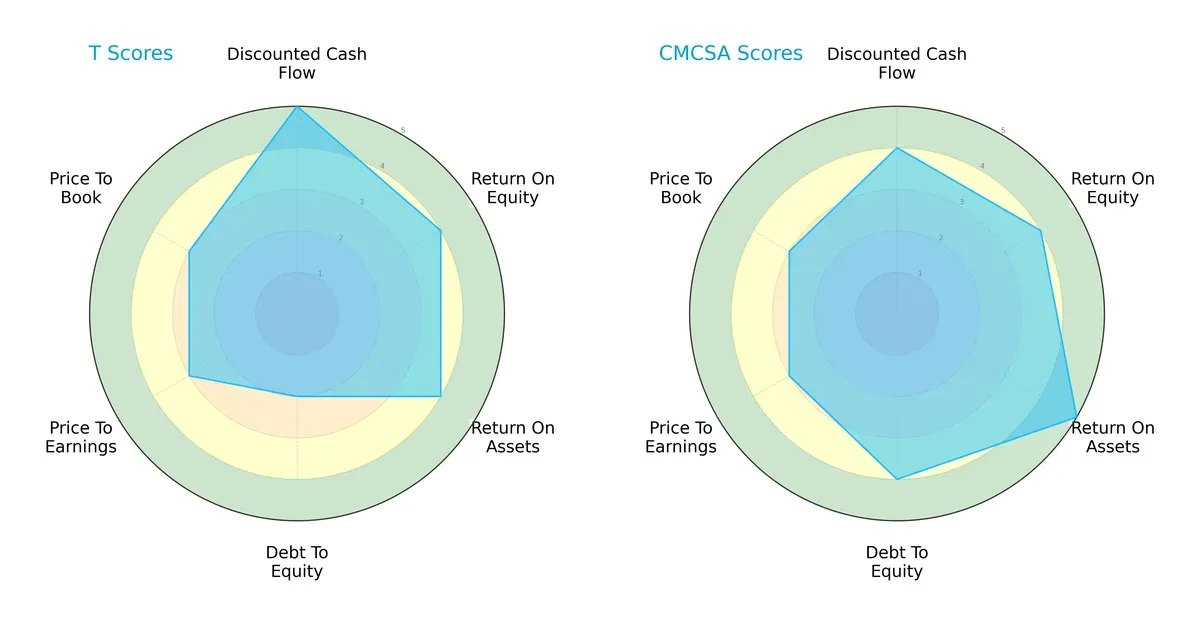
AT&T shows a strong discounted cash flow (DCF) score of 5 but struggles with a weak debt-to-equity score of 2, indicating higher financial risk. Comcast maintains a more balanced profile with favorable scores across ROA (5) and debt-to-equity (4), reflecting better asset utilization and financial stability. Both firms share moderate valuation scores, but Comcast’s consistency suggests a sturdier strategic position.
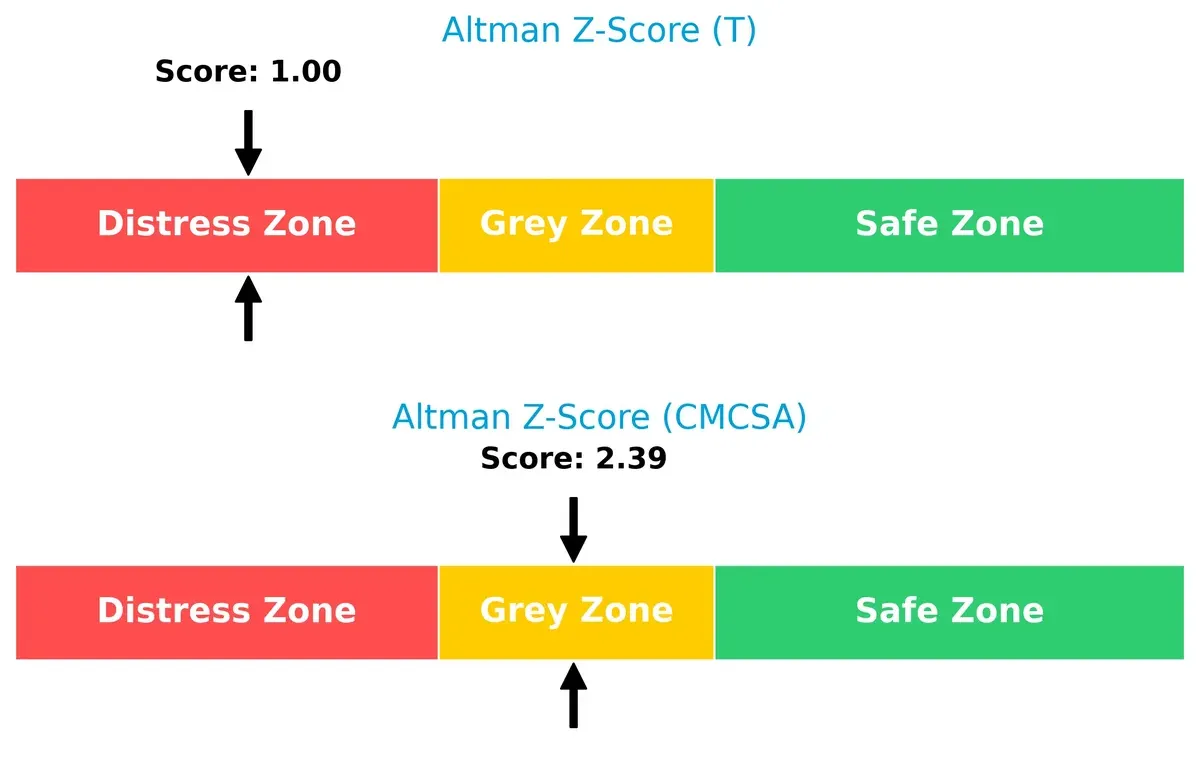
Bankruptcy Risk: Solvency Showdown
The Altman Z-Score difference signals divergent bankruptcy risks: AT&T’s 1.0 places it in the distress zone, raising red flags on solvency, while Comcast’s 2.4 in the grey zone indicates moderate risk but a safer outlook:
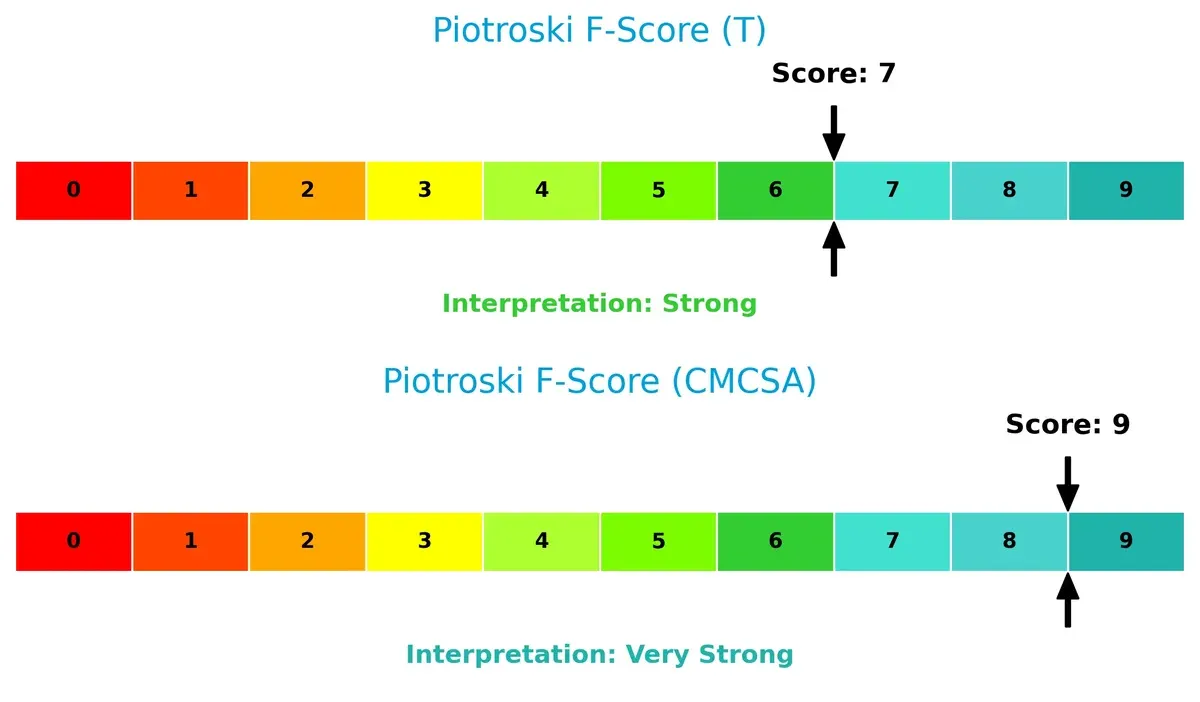
Financial Health: Quality of Operations
Comcast’s Piotroski F-Score of 9 signals peak financial health and operational quality, outperforming AT&T’s strong but lower score of 7. This gap suggests AT&T may carry internal weaknesses investors should monitor closely:
How are the two companies positioned?
This section dissects the operational DNA of AT&T and Comcast by comparing their revenue distribution and internal dynamics. The goal is to confront their economic moats to reveal which model offers the most resilient, sustainable competitive advantage today.
Revenue Segmentation: The Strategic Mix
This visual comparison dissects how AT&T Inc. and Comcast Corporation diversify their income streams and where their primary sector bets lie:
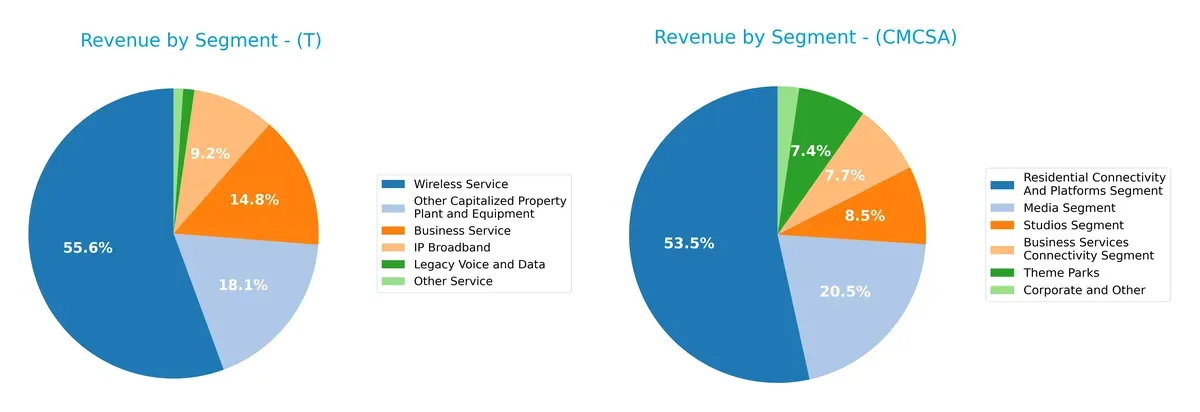
AT&T anchors its revenue heavily in Wireless Service at $68B, with Business Service and IP Broadband trailing at $18B and $11B respectively. Comcast shows a more diversified profile, with Residential Connectivity at $71B, Media at $27B, and Studios plus Theme Parks adding $21B combined. AT&T’s reliance on Wireless risks concentration, while Comcast pivots across entertainment and connectivity, enhancing ecosystem lock-in and reducing sector exposure.
Strengths and Weaknesses Comparison
This table compares the strengths and weaknesses of AT&T Inc. and Comcast Corporation:
AT&T Inc. Strengths
- Diverse revenue streams including Wireless Service and Business Solutions
- Favorable net margin and ROE above 17%
- Strong dividend yield at 4.59%
- Large U.S. market presence with over $116B revenue
- Slightly favorable overall financial ratios
Comcast Corporation Strengths
- Favorable net margin and higher ROE at 20.44%
- Very low debt-to-equity ratio at 0.06 indicating strong balance sheet
- Favorable interest coverage ratio at 6.84
- Diversified segments including Media, Studios, and Theme Parks
- Favorable overall financial ratios with 64% favorable
AT&T Inc. Weaknesses
- Current ratio below 1 at 0.91 indicating liquidity risk
- High debt-to-equity ratio at 1.25
- Unfavorable asset turnover metrics
- Limited international revenue compared to U.S.
- Neutral ROIC close to WACC at 5.57%
Comcast Corporation Weaknesses
- Current ratio below 1 at 0.88 also signaling liquidity constraints
- Neutral asset turnover and fixed asset turnover ratios
- Lower international revenue concentration than U.S.
- ROIC neutral but higher than AT&T at 9.88%
AT&T shows strengths in diversified services and a strong U.S. footprint but faces liquidity and efficiency challenges. Comcast benefits from a robust balance sheet and segment diversification, though liquidity ratios remain a concern. Both must manage international growth and operational efficiency to enhance their market positions.
The Moat Duel: Analyzing Competitive Defensibility
A structural moat protects long-term profits from competitive erosion. Only a durable advantage can sustain superior returns over time:
AT&T Inc.: Scale and Legacy Infrastructure Moat
AT&T leverages extensive network infrastructure and brand recognition. Its slightly favorable ROIC trend shows growing profitability but signals limited value creation versus WACC in 2025. Expansion in Latin America offers modest moat deepening risks.
Comcast Corporation: Integrated Media & Technology Ecosystem
Comcast’s moat stems from diversified media assets paired with broadband dominance. Its very favorable ROIC spread over WACC confirms strong value creation and rising profitability. Streaming and theme park segments could further fortify its ecosystem lock-in in 2026.
Network Scale vs. Ecosystem Integration: The Moat Battle
Comcast’s wide, growing moat from ecosystem integration outpaces AT&T’s legacy infrastructure scale. Comcast is better positioned to defend market share as new media and broadband demand evolve.
Which stock offers better returns?
The past year shows a stark contrast in price movements between AT&T Inc. and Comcast Corporation, with AT&T appreciating significantly while Comcast has faced a notable decline.
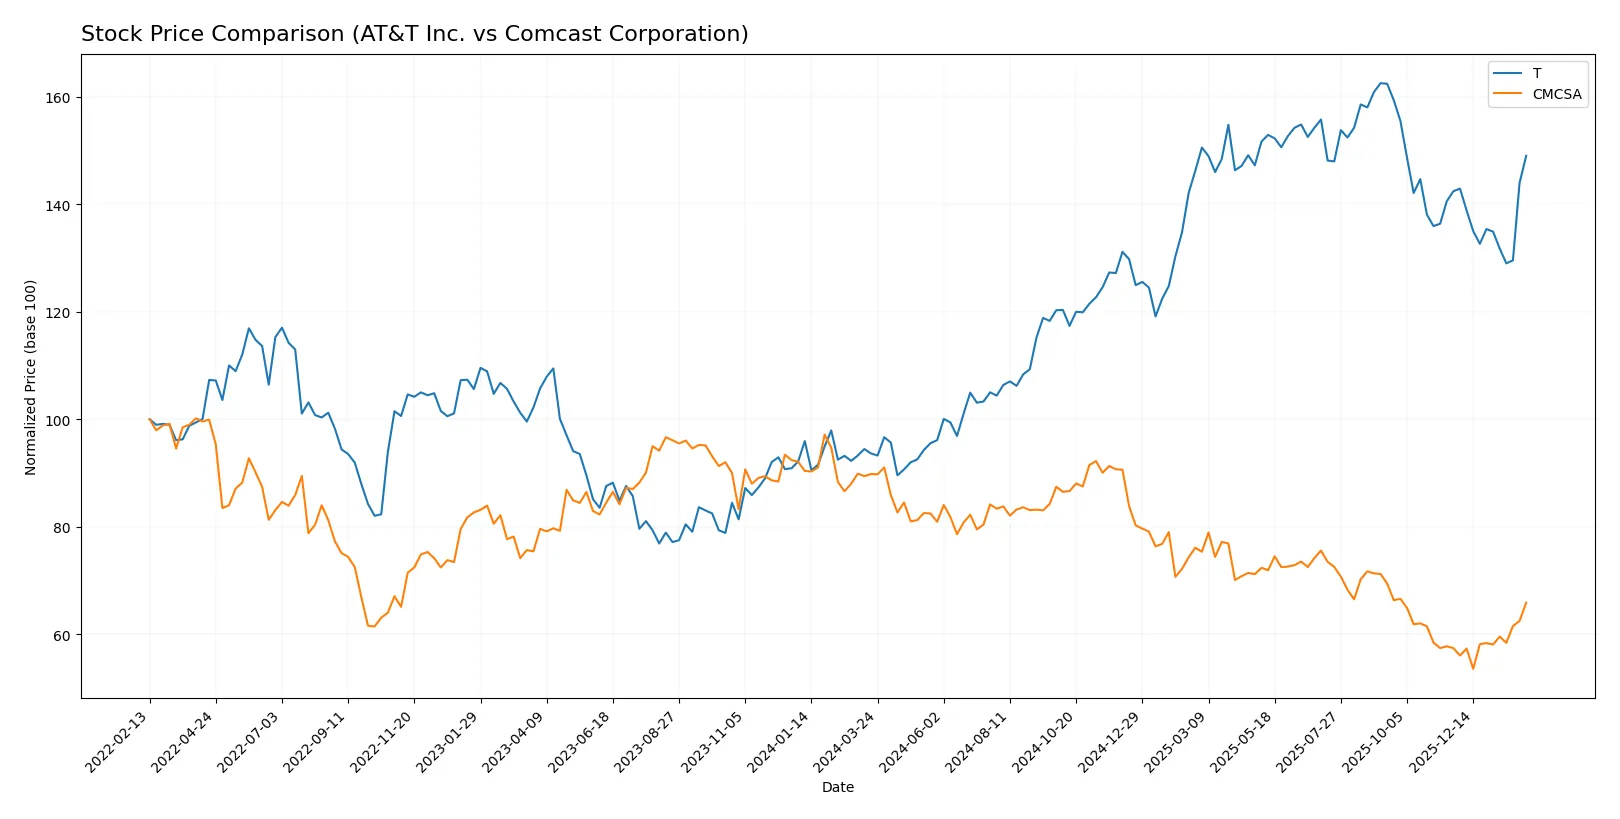
Trend Comparison
AT&T Inc. displays a strong bullish trend over the past 12 months, with a 59.12% price increase and decelerating momentum, reaching a high of 29.59 and a low of 16.31.
Comcast Corporation exhibits a bearish trend, declining 26.65% over the same period, despite accelerating losses and a wider price range from 25.51 to 43.91.
AT&T clearly outperforms Comcast, delivering the highest market returns amid contrasting directional trends and volatility profiles.
Target Prices
Analysts present modest upside potential for both AT&T Inc. and Comcast Corporation based on current consensus targets.
| Company | Target Low | Target High | Consensus |
|---|---|---|---|
| AT&T Inc. | 20 | 33 | 28.96 |
| Comcast Corporation | 23 | 40 | 32.71 |
AT&T’s consensus target sits slightly above its current price of 27.13, indicating moderate appreciation potential. Comcast’s target consensus of 32.71 also suggests room for growth beyond its current 31.37 price point.

Don’t Let Luck Decide Your Entry Point
Optimize your entry points with our advanced ProRealTime indicators. You’ll get efficient buy signals with precise price targets for maximum performance. Start outperforming now!
How do institutions grade them?
Institutional grades for AT&T Inc. and Comcast Corporation reveal their current market perceptions:
AT&T Inc. Grades
The following table summarizes recent grades from key financial institutions for AT&T Inc.:
| Grading Company | Action | New Grade | Date |
|---|---|---|---|
| Wells Fargo | Maintain | Overweight | 2026-01-26 |
| Bernstein | Maintain | Outperform | 2026-01-16 |
| Barclays | Maintain | Equal Weight | 2026-01-13 |
| Citigroup | Maintain | Buy | 2025-12-22 |
| Goldman Sachs | Maintain | Buy | 2025-12-19 |
| Wolfe Research | Downgrade | Peer Perform | 2025-12-15 |
| Morgan Stanley | Maintain | Overweight | 2025-12-10 |
| Keybanc | Upgrade | Overweight | 2025-11-12 |
| RBC Capital | Maintain | Outperform | 2025-10-23 |
| TD Cowen | Maintain | Hold | 2025-10-23 |
Comcast Corporation Grades
Here are the latest institutional grades for Comcast Corporation:
| Grading Company | Action | New Grade | Date |
|---|---|---|---|
| Rosenblatt | Maintain | Neutral | 2026-01-30 |
| TD Cowen | Maintain | Buy | 2026-01-30 |
| Citigroup | Maintain | Buy | 2026-01-30 |
| Scotiabank | Maintain | Sector Perform | 2026-01-30 |
| Bernstein | Maintain | Market Perform | 2026-01-16 |
| Barclays | Maintain | Equal Weight | 2026-01-13 |
| B of A Securities | Upgrade | Buy | 2026-01-12 |
| Benchmark | Maintain | Buy | 2026-01-06 |
| Morgan Stanley | Maintain | Equal Weight | 2025-12-10 |
| Rosenblatt | Maintain | Neutral | 2025-12-01 |
Which company has the best grades?
AT&T Inc. has more consistently positive grades, including multiple “Buy” and “Outperform” ratings. Comcast shows a mix of “Buy” and “Neutral” grades but fewer strong endorsements. This suggests investors may see AT&T as having stronger near-term potential, though the diversity of ratings for both signals varying analyst views and risks.
Risks specific to each company
The following categories identify the critical pressure points and systemic threats facing both firms in the 2026 market environment:
1. Market & Competition
AT&T Inc.
- Faces intense competition in telecom with pressure on legacy services and growth in fiber broadband.
Comcast Corporation
- Competes across telecom, media, and entertainment sectors, requiring broad innovation and content investment.
2. Capital Structure & Debt
AT&T Inc.
- High debt-to-equity ratio at 1.25 signals elevated financial leverage and refinancing risk.
Comcast Corporation
- Extremely low debt-to-equity ratio at 0.06 indicates strong balance sheet and lower financial risk.
3. Stock Volatility
AT&T Inc.
- Beta of 0.61 reflects lower stock volatility, possibly less sensitive to market swings.
Comcast Corporation
- Beta of 0.79 shows moderate volatility, exposing investors to greater market fluctuations.
4. Regulatory & Legal
AT&T Inc.
- Subject to telecom regulations and scrutiny over media asset consolidation.
Comcast Corporation
- Faces complex regulations spanning telecom, media content, and theme park operations.
5. Supply Chain & Operations
AT&T Inc.
- Operational challenges include legacy infrastructure upgrades and supply of network equipment.
Comcast Corporation
- Diverse operations require managing supply chains across hardware, content production, and theme park services.
6. ESG & Climate Transition
AT&T Inc.
- Pressured to reduce carbon footprint in network operations and improve social governance.
Comcast Corporation
- Must address emissions in theme parks and media production while advancing social responsibility.
7. Geopolitical Exposure
AT&T Inc.
- Exposure to Latin American markets adds regional political and currency risks.
Comcast Corporation
- Global theme parks and international media content increase sensitivity to geopolitical tensions.
Which company shows a better risk-adjusted profile?
AT&T’s highest risk is its heavy debt load, placing it in financial distress per its Altman Z-score near 1. Comcast’s most impactful risk lies in its broader geopolitical exposure through diversified operations. Comcast’s stronger balance sheet and higher Piotroski score demonstrate a superior risk-adjusted profile. Notably, AT&T’s Altman Z-score below 1 signals urgent financial caution amid competitive pressures.
Final Verdict: Which stock to choose?
AT&T Inc. stands out with its robust income quality and consistent margin expansion, demonstrating an ability to generate strong returns despite sector challenges. Its main point of vigilance remains the modest current ratio and leverage, which could pressure liquidity in downturns. This profile suits investors targeting steady income with moderate growth in a value-oriented portfolio.
Comcast Corporation’s strategic moat lies in its efficient capital allocation and low financial leverage, supporting a solid balance sheet and superior return on invested capital. Its recurring revenue streams and operational resilience offer better safety compared to AT&T. Comcast fits well within a GARP (Growth at a Reasonable Price) portfolio seeking both stability and growth potential.
If you prioritize income stability and value metrics, AT&T is a compelling choice due to its favorable dividend yield and improving profitability. However, if you seek a stronger economic moat with healthier financial leverage and growth prospects, Comcast offers better stability and superior capital efficiency. Both present analytical scenarios aligned with different investor risk tolerances and objectives.
Disclaimer: Investment carries a risk of loss of initial capital. The past performance is not a reliable indicator of future results. Be sure to understand risks before making an investment decision.
Go Further
I encourage you to read the complete analyses of AT&T Inc. and Comcast Corporation to enhance your investment decisions: