Home > Comparison > Communication Services > T vs CHTR
The strategic rivalry between AT&T Inc. and Charter Communications, Inc. shapes the telecommunications services sector’s evolution. AT&T operates as a capital-intensive communications giant with diversified media and technology offerings. In contrast, Charter focuses on high-margin broadband connectivity and cable services. This analysis pits AT&T’s scale against Charter’s growth agility to determine which trajectory offers superior risk-adjusted returns for a diversified portfolio in 2026.
Table of contents
Companies Overview
AT&T Inc. and Charter Communications, Inc. dominate the U.S. telecommunications landscape with distinct strategic footprints.
AT&T Inc.: Global Telecom and Media Powerhouse
AT&T Inc. commands the telecommunications services market with a broad portfolio including wireless voice, data communications, and media services. Its core revenue derives from wireless subscriptions and business solutions spanning cloud, security, and managed services. In 2026, AT&T emphasizes expanding its broadband fiber footprint and strengthening multinational enterprise services to sustain growth and customer retention.
Charter Communications, Inc.: Broadband and Cable Innovator
Charter Communications focuses on broadband connectivity and cable services, serving 32M U.S. customers. Its revenue engine centers on subscription-based video and Internet services, including high-performance WiFi and voice over IP. The company’s 2026 strategy prioritizes enhancing in-home and out-of-home WiFi offerings and expanding digital advertising across its media platforms to deepen customer engagement and monetize content.
Strategic Collision: Similarities & Divergences
Both companies operate in telecommunications but diverge sharply in business models. AT&T pursues a diversified telecom-media ecosystem, blending wireless and enterprise services, while Charter emphasizes a focused cable and broadband infrastructure with strong video and WiFi offerings. They compete chiefly in broadband customer acquisition and digital content monetization. Their investment profiles contrast: AT&T offers scale and diversification; Charter offers growth via niche broadband and media innovation.
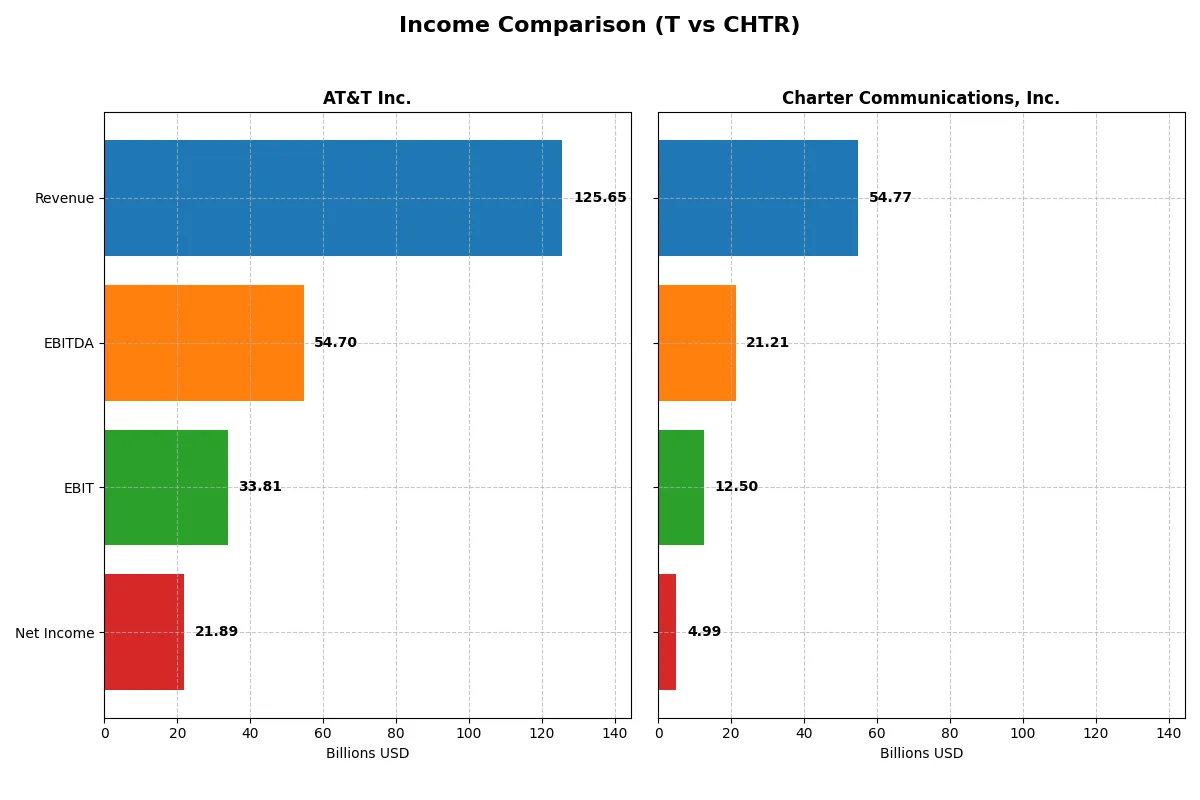
Income Statement Comparison
The following data dissects the core profitability and scalability of both corporate engines to reveal who dominates the bottom line:
| Metric | AT&T Inc. (T) | Charter Communications, Inc. (CHTR) |
|---|---|---|
| Revenue | 126B | 54.8B |
| Cost of Revenue | 25.4B | 29.4B |
| Operating Expenses | 76.1B | 12.0B |
| Gross Profit | 100.2B | 25.4B |
| EBITDA | 54.7B | 21.2B |
| EBIT | 33.8B | 12.5B |
| Interest Expense | 6.8B | 5.0B |
| Net Income | 21.9B | 5.0B |
| EPS | 3.04 | 36.9 |
| Fiscal Year | 2025 | 2025 |
Income Statement Analysis: The Bottom-Line Duel
This income statement comparison reveals which company’s financial engine runs more efficiently and generates superior shareholder value.
AT&T Inc. Analysis
AT&T’s revenue shows modest growth, reaching 126B in 2025, while net income doubles to 21.9B, reflecting strong momentum. Gross margin expands impressively to nearly 80%, signaling excellent cost control. The 17.4% net margin and 27% EBIT margin highlight robust profitability, driven by operational efficiency and effective expense management.
Charter Communications, Inc. Analysis
Charter’s revenue slightly declines to 54.8B in 2025, with net income at 5.0B, showing slower growth momentum. Its gross margin holds steady at 46%, indicating consistent cost structure. A 9.1% net margin and 23% EBIT margin demonstrate solid, but less efficient profitability compared to peers, with slight pressure on margins over the past year.
Margin Dominance vs. Revenue Resilience
AT&T leads with superior margins and faster net income growth, showcasing a more efficient profit engine despite slower revenue expansion. Charter offers steadier revenue but lower margins and profit growth. For investors prioritizing fundamental profitability and margin strength, AT&T’s profile appears more compelling.
Financial Ratios Comparison
These vital ratios act as a diagnostic tool to expose the underlying fiscal health, valuation premiums, and capital efficiency of the companies compared:
| Ratios | AT&T Inc. (T) | Charter Communications, Inc. (CHTR) |
|---|---|---|
| ROE | 17.58% | 31.06% |
| ROIC | 5.57% | 7.27% |
| P/E | 8.14 | 5.66 |
| P/B | 1.43 | 1.76 |
| Current Ratio | 0.91 | 0.39 |
| Quick Ratio | 0.86 | 0.39 |
| D/E | 1.25 | 5.90 |
| Debt-to-Assets | 36.90% | 61.44% |
| Interest Coverage | 3.55 | 2.64 |
| Asset Turnover | 0.30 | 0.36 |
| Fixed Asset Turnover | 0.81 | 1.18 |
| Payout ratio | 37.37% | 0% |
| Dividend yield | 4.59% | 0% |
| Fiscal Year | 2025 | 2025 |
Efficiency & Valuation Duel: The Vital Signs
Financial ratios act as a company’s DNA, unveiling hidden risks and operational strengths crucial for informed investment decisions.
AT&T Inc.
AT&T delivers a solid 17.6% ROE and a favorable 17.4% net margin, reflecting stable profitability. Its P/E of 8.14 and P/B of 1.43 signal a reasonably valued stock, not stretched. The 4.59% dividend yield rewards shareholders, while moderate reinvestment sustains operational efficiency amid a slightly weak current ratio.
Charter Communications, Inc.
Charter boasts an impressive 31.1% ROE but a more modest 9.1% net margin, indicating high leverage and efficiency in capital use. With a low P/E of 5.66, the stock appears attractively priced but carries risks from a high debt ratio and zero dividend, signaling reliance on growth and reinvestment strategies over shareholder payouts.
Balanced Profitability vs. Aggressive Growth
AT&T offers a more balanced risk-reward profile with steady profitability and shareholder returns. Charter’s higher ROE and low valuation appeal to growth-oriented investors willing to accept greater leverage and no dividend. The choice depends on whether an investor prioritizes income stability or aggressive capital appreciation.
Which one offers the Superior Shareholder Reward?
AT&T pays a solid 4.6% dividend yield with a 37% payout ratio, well-covered by free cash flow at nearly 48%. It also maintains steady buybacks, boosting total returns sustainably. Charter skips dividends, reinvesting heavily in capex and growth, but its free cash flow coverage of buybacks is weaker at 27%. Despite Charter’s growth focus, AT&T offers a more balanced, durable distribution model and superior shareholder reward in 2026.
Comparative Score Analysis: The Strategic Profile
The radar chart reveals the core financial DNA and strategic trade-offs that define AT&T Inc. and Charter Communications, Inc.:
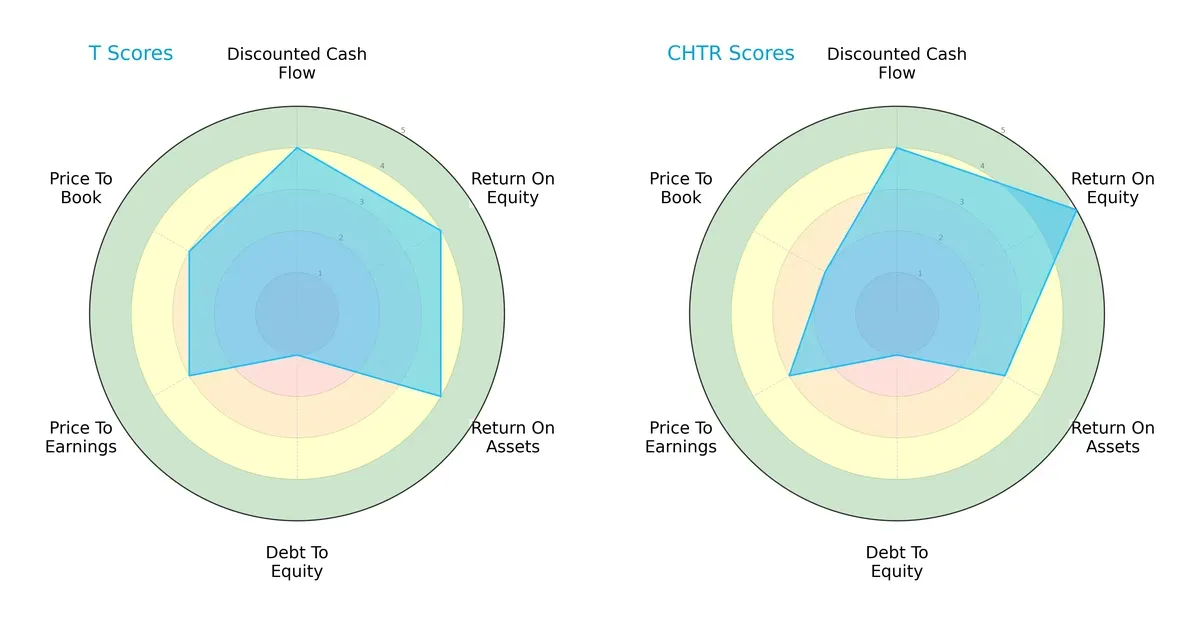
AT&T shows a balanced strength in ROE and ROA with favorable DCF scores but suffers from a very unfavorable debt-to-equity position. Charter edges AT&T in ROE but lags slightly in ROA and price-to-book valuation. Both firms share weak balance sheets, but Charter’s higher ROE gives it a specific profitability edge, while AT&T maintains more consistency across operational metrics.
Bankruptcy Risk: Solvency Showdown
Both AT&T and Charter Communications sit deep in the distress zone, signaling elevated bankruptcy risk amid current market conditions:
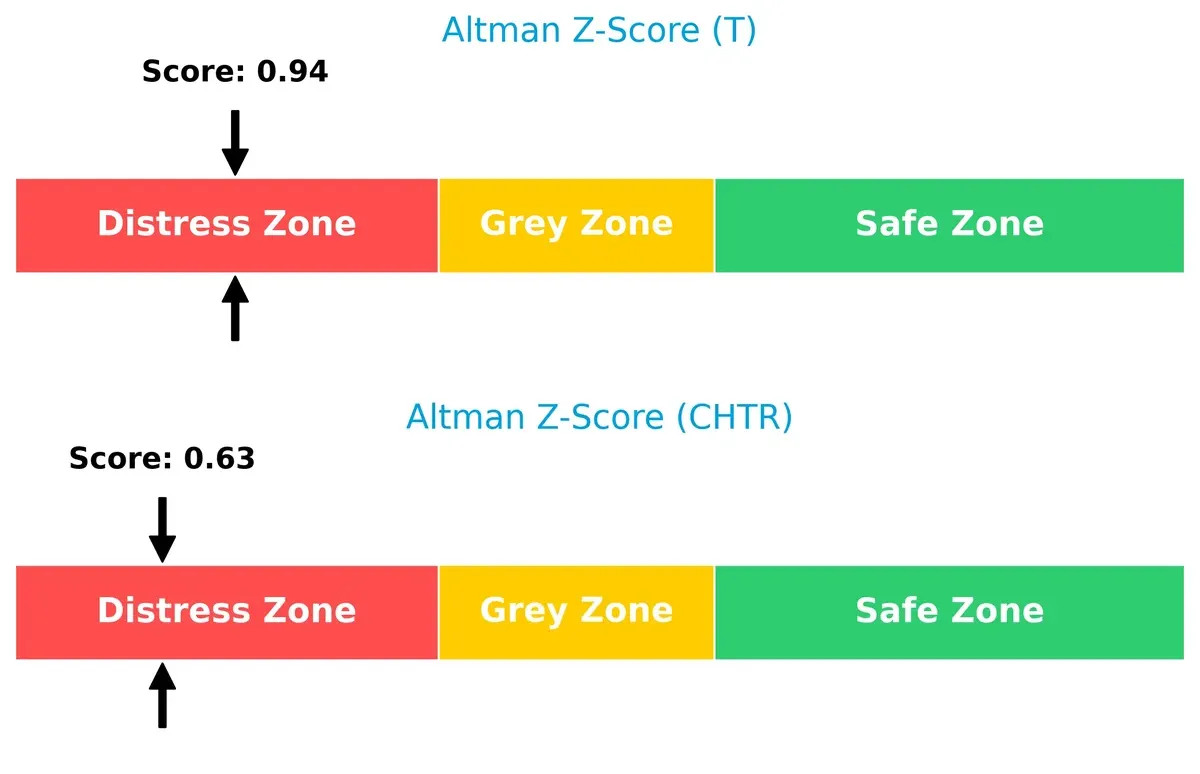
AT&T’s Altman Z-Score at 0.94 slightly outperforms Charter’s 0.63, but both fall well below the safe threshold of 3. This highlights significant financial vulnerability and caution for investors focusing on long-term survival.
Financial Health: Quality of Operations
AT&T’s Piotroski F-Score of 7 reflects stronger internal financial controls and operational quality compared to Charter’s more average 6:
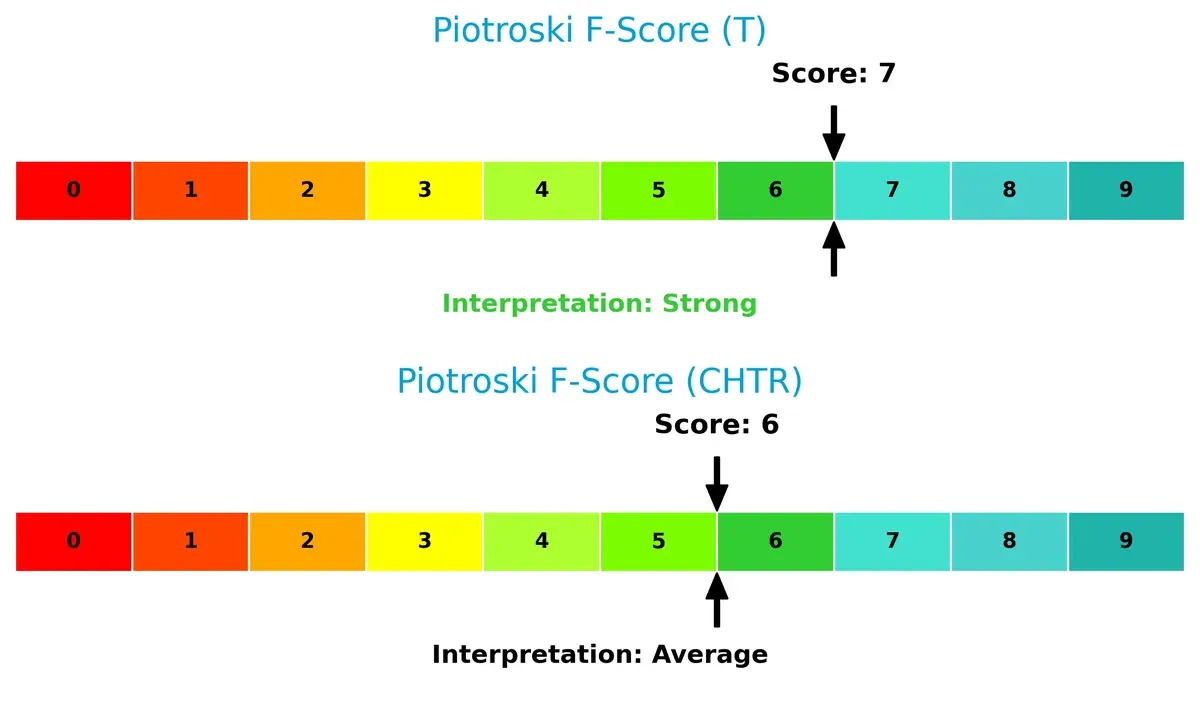
While neither company scores at the very top, AT&T’s higher score suggests better profitability, efficiency, and lower red flags in financial health. Charter’s slightly lower score raises modest concerns about its internal fundamentals relative to AT&T.
How are the two companies positioned?
This section dissects AT&T and Charter’s operational DNA by comparing revenue distribution and internal strengths and weaknesses. The goal is to confront their economic moats to determine which business model delivers the most resilient, sustainable advantage today.
Revenue Segmentation: The Strategic Mix
This comparison dissects how AT&T Inc. and Charter Communications diversify their income streams and where their primary sector bets lie:
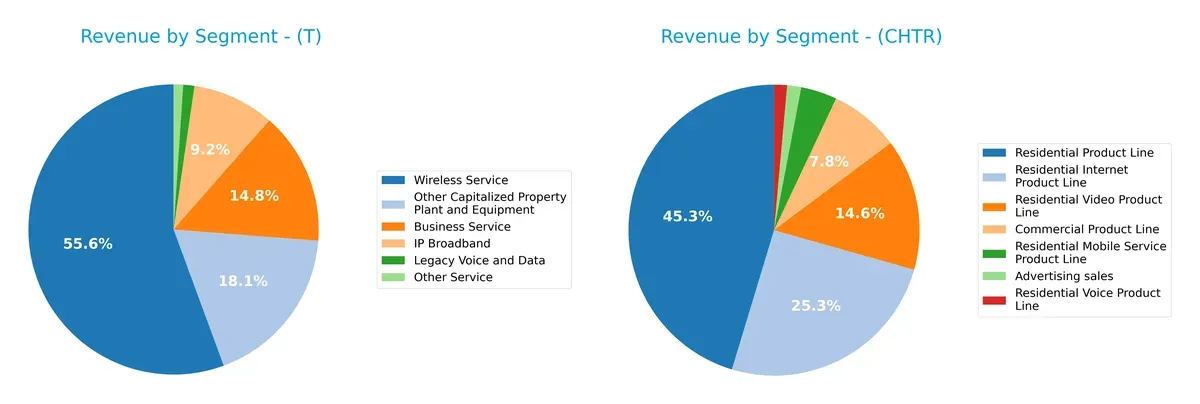
AT&T leans heavily on Wireless Service, generating $68B, dwarfing its next largest Business Service at $18B. This concentration anchors AT&T in mobile infrastructure dominance but poses concentration risk. Conversely, Charter Communications spreads revenue more evenly, with Residential Product Line at $42.6B and substantial contributions from Residential Internet ($23.8B) and Video ($13.7B). Charter’s diversified mix reduces dependency on any single segment, supporting ecosystem lock-in through bundled residential services.
Strengths and Weaknesses Comparison
This table compares the Strengths and Weaknesses of AT&T Inc. and Charter Communications, Inc.:
AT&T Inc. Strengths
- Favorable net margin and ROE
- WACC below ROIC supports value creation
- Strong dividend yield of 4.59%
- Diverse revenue streams including wireless and business services
- Solid market presence in the US and Latin America
Charter Communications Strengths
- High ROE at 31.06%
- Favorable WACC supports capital efficiency
- Low PE ratio of 5.66
- Strong residential product line with diversified services
- Robust commercial product segment
AT&T Inc. Weaknesses
- Current ratio below 1 indicates liquidity risk
- Debt to equity ratio of 1.25 signals moderate leverage
- Asset turnover metrics are unfavorable, reflecting operational inefficiency
- Neutral ROIC near WACC limits excess returns
Charter Communications Weaknesses
- Very low liquidity ratios (current and quick ratio at 0.39) pose risk
- High debt to equity of 5.9 and debt to assets at 61.44% indicate heavy leverage
- Zero dividend yield may deter income investors
- Net margin at 9.1% is neutral and lower than AT&T
AT&T excels in profitability and dividend yield with a broad revenue base but faces liquidity and asset efficiency challenges. Charter shows strong returns on equity and efficient capital costs but carries significant leverage and weaker liquidity, impacting financial flexibility. These factors shape each company’s strategic focus on growth and risk management.
The Moat Duel: Analyzing Competitive Defensibility
A structural moat is the single most vital shield protecting long-term profits from relentless competition erosion:
AT&T Inc.: Broad Scale Infrastructure & Brand Strength
AT&T leverages its vast network and brand recognition, delivering stable margins and improving profitability despite revenue headwinds. Expansion in Latin America and fiber upgrades could fortify its moat in 2026.
Charter Communications, Inc.: Focused Cable & Broadband Efficiency
Charter relies on operational efficiency and customer scale in broadband services, showing growing returns on capital. Its narrower footprint poses risks but offers upside through targeted market penetration and digital service growth.
Network Scale vs. Operational Efficiency: The Telecom Moat Battle
Charter commands a deeper moat with ROIC well above WACC and steady growth, signaling a durable competitive edge. AT&T maintains a wider but less profitable moat, making Charter better positioned to defend market share.
Which stock offers better returns?
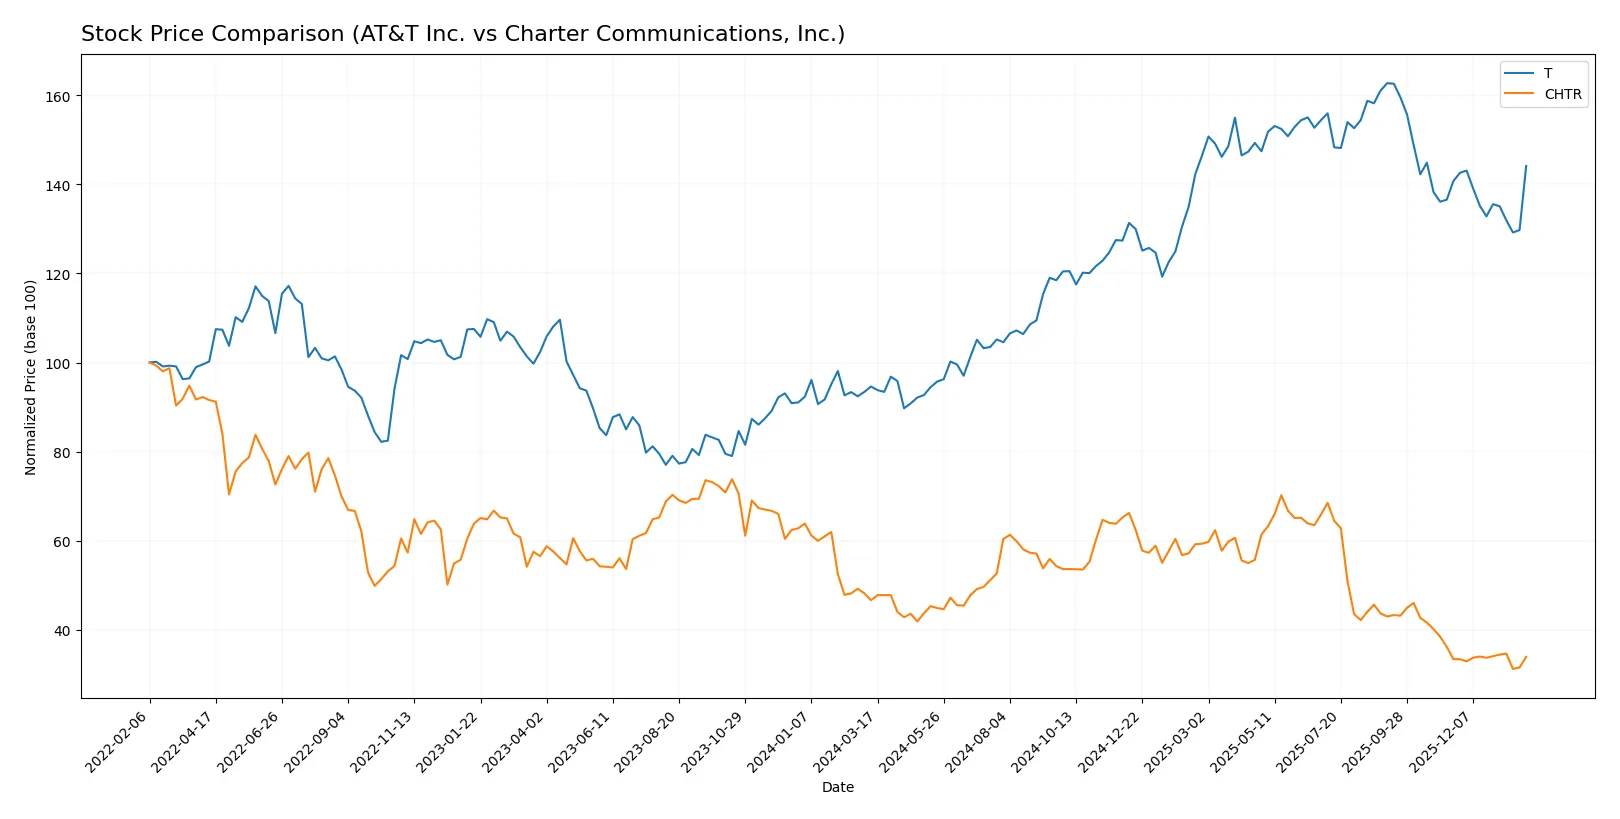
Over the past 12 months, AT&T Inc. experienced strong price appreciation with decelerating momentum, while Charter Communications, Inc. saw a significant decline despite recent slight recovery attempts.
Trend Comparison
AT&T’s stock rose 52.38% over the past year, marking a bullish trend with decelerating gains from a low of 16.31 to a peak of 29.59. Charter Communications’ stock dropped 27.37% over the same period, showing a bearish trend with accelerating losses from 427.25 down to 189.76. AT&T delivered the highest market performance, outperforming Charter by a wide margin during the past 12 months.
Target Prices
Analysts present a broad but optimistic target price range for AT&T Inc. and Charter Communications, Inc.
| Company | Target Low | Target High | Consensus |
|---|---|---|---|
| AT&T Inc. | 20 | 33 | 28.96 |
| Charter Communications, Inc. | 160 | 500 | 287.5 |
The consensus target prices indicate upside potential versus current prices: AT&T trades near 26.22, below its 29 consensus, while Charter trades at 206.12, notably under its 287.5 consensus. Analysts expect substantial appreciation, especially for Charter.

Don’t Let Luck Decide Your Entry Point
Optimize your entry points with our advanced ProRealTime indicators. You’ll get efficient buy signals with precise price targets for maximum performance. Start outperforming now!
How do institutions grade them?
Below is a summary of institutional grades for AT&T Inc. and Charter Communications, Inc.:
AT&T Inc. Grades
The following table shows recent grades and actions from major financial institutions for AT&T Inc.:
| Grading Company | Action | New Grade | Date |
|---|---|---|---|
| Wells Fargo | Maintain | Overweight | 2026-01-26 |
| Bernstein | Maintain | Outperform | 2026-01-16 |
| Barclays | Maintain | Equal Weight | 2026-01-13 |
| Citigroup | Maintain | Buy | 2025-12-22 |
| Goldman Sachs | Maintain | Buy | 2025-12-19 |
| Wolfe Research | Downgrade | Peer Perform | 2025-12-15 |
| Morgan Stanley | Maintain | Overweight | 2025-12-10 |
| Keybanc | Upgrade | Overweight | 2025-11-12 |
| RBC Capital | Maintain | Outperform | 2025-10-23 |
| Barclays | Maintain | Equal Weight | 2025-10-23 |
Charter Communications, Inc. Grades
The following table presents recent grades and changes from notable grading firms for Charter Communications, Inc.:
| Grading Company | Action | New Grade | Date |
|---|---|---|---|
| Bernstein | Maintain | Market Perform | 2026-01-16 |
| Wells Fargo | Downgrade | Underweight | 2026-01-13 |
| UBS | Maintain | Neutral | 2025-12-22 |
| Wells Fargo | Maintain | Equal Weight | 2025-11-03 |
| Bernstein | Downgrade | Market Perform | 2025-11-03 |
| RBC Capital | Maintain | Sector Perform | 2025-11-03 |
| Keybanc | Downgrade | Sector Weight | 2025-11-03 |
| Benchmark | Maintain | Buy | 2025-11-03 |
| Citigroup | Maintain | Buy | 2025-11-03 |
| Barclays | Maintain | Underweight | 2025-11-03 |
Which company has the best grades?
AT&T Inc. generally holds stronger grades, including multiple “Buy,” “Outperform,” and “Overweight” ratings. Charter Communications shows more downgrades and neutral-to-negative ratings. Investors might perceive AT&T as a more favorably viewed stock by institutions.
Risks specific to each company
In 2026, these categories identify critical pressure points and systemic threats facing AT&T Inc. and Charter Communications, Inc. in the current market environment:
1. Market & Competition
AT&T Inc.
- Faces intense competition from wireless and broadband providers; stable net margin (17.4%) supports resilience.
Charter Communications, Inc.
- Operates in competitive broadband and cable markets; lower net margin (9.1%) signals pricing pressures.
2. Capital Structure & Debt
AT&T Inc.
- Moderate debt-to-assets (36.9%); debt/equity of 1.25 flagged as unfavorable, interest coverage moderate at 4.97.
Charter Communications, Inc.
- High leverage with debt/equity at 5.9 and debt-to-assets 61.4%, interest coverage weaker at 2.48, raising financial risk.
3. Stock Volatility
AT&T Inc.
- Low beta of 0.6 indicates lower volatility, appealing for risk-averse investors.
Charter Communications, Inc.
- Beta above 1 (1.058) shows higher stock volatility, increasing market risk exposure.
4. Regulatory & Legal
AT&T Inc.
- Subject to telecom regulations and spectrum licensing risks; historical compliance generally stable.
Charter Communications, Inc.
- Faces regulatory scrutiny typical for cable operators; emerging risks in advertising and content distribution.
5. Supply Chain & Operations
AT&T Inc.
- Moderate asset turnover (0.3) and fixed asset turnover (0.81) indicate operational inefficiencies.
Charter Communications, Inc.
- Slightly better asset turnover (0.36) and fixed asset turnover (1.18) reflect more efficient operations.
6. ESG & Climate Transition
AT&T Inc.
- Increasing focus on sustainable network upgrades; ESG initiatives progressing but still maturing.
Charter Communications, Inc.
- ESG efforts underway, particularly in energy efficiency and waste reduction; progress slower than peers.
7. Geopolitical Exposure
AT&T Inc.
- Some exposure via Latin America operations; geopolitical risks moderate but manageable.
Charter Communications, Inc.
- Primarily U.S.-focused; minimal direct geopolitical risks but sensitive to domestic policy shifts.
Which company shows a better risk-adjusted profile?
AT&T’s key risk is its moderate leverage paired with operational inefficiencies, but it benefits from lower stock volatility and a stronger margin. Charter’s highest risk is its heavy debt load and lower liquidity, increasing default risk despite operational efficiency. Given these factors, AT&T exhibits a better risk-adjusted profile, balancing financial stability with market positioning more prudently in 2026. The distress-zone Altman Z-scores for both firms signal caution, but Charter’s weaker interest coverage and higher debt amplify concerns.
Final Verdict: Which stock to choose?
AT&T Inc. excels as a cash-generating powerhouse with a steadily improving return on invested capital. Its disciplined capital allocation supports stable dividends, appealing to income-focused investors. A point of vigilance remains its stretched balance sheet and liquidity ratios, which could constrain agility. AT&T fits well in a conservative or income-oriented portfolio.
Charter Communications stands out with a robust economic moat driven by strong operating returns and a scalable infrastructure advantage. Its high return on equity signals effective management execution. While it carries heavier leverage than AT&T, Charter offers relatively better growth potential with a solid moat. It suits a Growth at a Reasonable Price (GARP) portfolio.
If you prioritize stable income and capital preservation, AT&T is the compelling choice due to its cash flow reliability and dividend yield. However, if you seek growth with a durable competitive advantage, Charter outshines by delivering superior operating returns despite higher leverage. Both names warrant caution on debt levels, emphasizing the need for risk-conscious allocation.
Disclaimer: Investment carries a risk of loss of initial capital. The past performance is not a reliable indicator of future results. Be sure to understand risks before making an investment decision.
Go Further
I encourage you to read the complete analyses of AT&T Inc. and Charter Communications, Inc. to enhance your investment decisions: