Home > Comparison > Healthcare > AZN vs PFE
The strategic rivalry between AstraZeneca PLC and Pfizer Inc. shapes the global healthcare landscape. AstraZeneca operates as a biopharmaceutical innovator focused on specialty care, while Pfizer excels as a diversified drug manufacturer with a broad therapeutic portfolio. This clash reflects a broader contest between innovation-driven growth and scale-driven value. This analysis aims to identify which corporate model offers superior risk-adjusted returns for a diversified portfolio in 2026.

Table of contents
Companies Overview
AstraZeneca and Pfizer dominate the global pharmaceutical landscape with expansive portfolios and robust innovation pipelines.
AstraZeneca PLC: Global Biopharma Innovator
AstraZeneca focuses on prescription medicines, generating revenue mainly from oncology, cardiovascular, and rare disease drugs. Its strategic push in 2026 centers on AI-driven drug discovery partnerships and expanding oncology treatments, capitalizing on precision medicine. The company’s broad geographic footprint and collaboration with tech firms bolster its competitive edge in specialty care.
Pfizer Inc.: Diversified Pharma Giant
Pfizer operates broadly in biopharmaceuticals, earning revenue from vaccines, immunotherapies, and anti-infectives, including its COVID-19 oral treatment Paxlovid. In 2026, Pfizer emphasizes expanding its vaccine portfolio and biosimilars while leveraging strategic alliances to enhance R&D productivity. Its diversified therapeutic focus and contract manufacturing business add resilience against sector cyclicality.
Strategic Collision: Similarities & Divergences
Both firms invest heavily in innovative drug development but diverge in approach. AstraZeneca leans into AI partnerships and specialty treatments, while Pfizer balances vaccines and biosimilars with broad therapeutic coverage. Their battleground lies in oncology and infectious diseases, targeting overlapping patient populations. AstraZeneca’s focus on cutting-edge technology contrasts with Pfizer’s scale and diversification, defining distinct risk-return profiles.
Income Statement Comparison
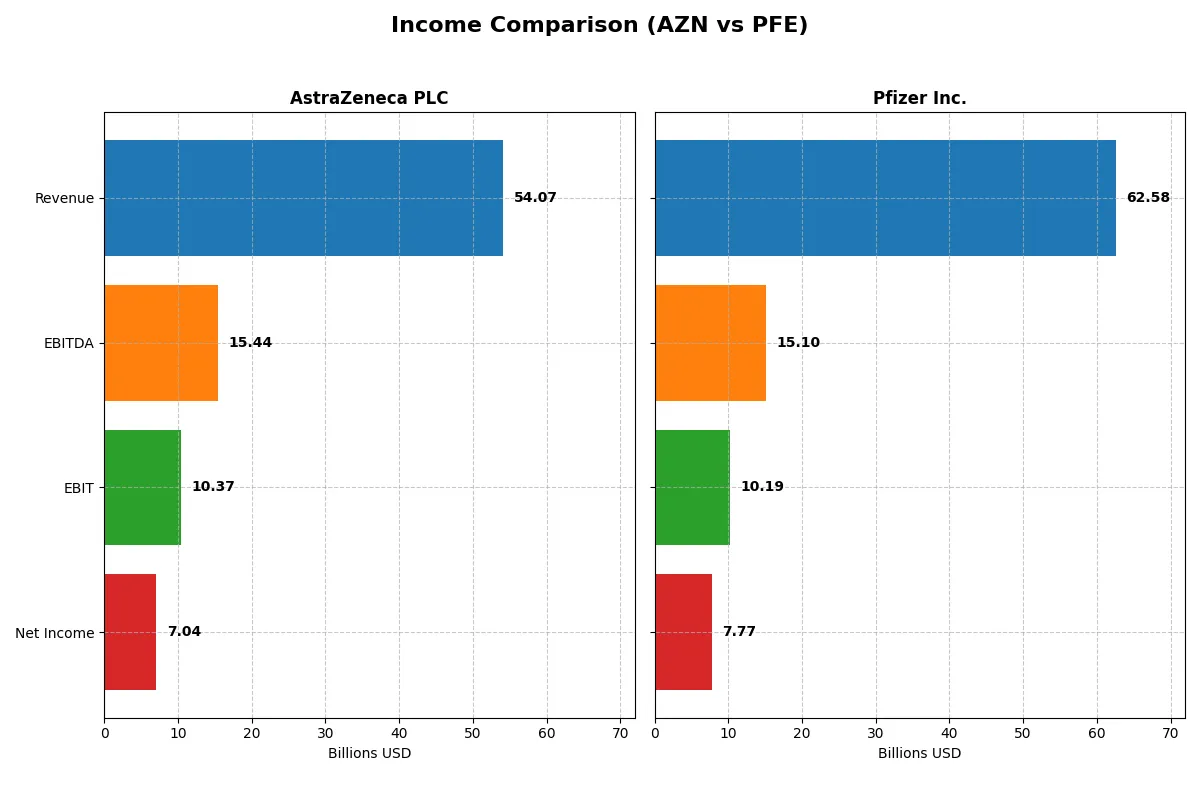
This table dissects the core profitability and scalability of both corporate engines to reveal who dominates the bottom line:
| Metric | AstraZeneca PLC (AZN) | Pfizer Inc. (PFE) |
|---|---|---|
| Revenue | 54.1B | 62.6B |
| Cost of Revenue | 10.2B | 18.6B |
| Operating Expenses | 33.9B | 28.6B |
| Gross Profit | 43.9B | 44.0B |
| EBITDA | 15.4B | 15.1B |
| EBIT | 10.4B | 10.2B |
| Interest Expense | 1.7B | 2.7B |
| Net Income | 7.0B | 7.7B |
| EPS | 1.14 | 1.36 |
| Fiscal Year | 2024 | 2025 |
Income Statement Analysis: The Bottom-Line Duel
This income statement comparison reveals which company drives superior operational efficiency and sustainable profit generation.
AstraZeneca PLC Analysis
AstraZeneca’s revenue climbed 18% in 2024, reaching $54B, while net income grew steadily to $7B. The firm sustains a robust gross margin above 81%, reflecting strong cost control. Its EBIT margin at 19% and net margin of 13% signal effective expense management and solid profitability momentum in the latest year.
Pfizer Inc. Analysis
Pfizer reported $62.6B revenue in 2025, slightly down 1.6% from the prior year, yet net income edged lower to $7.7B. Its gross margin of 70% and EBIT margin of 16% remain healthy but trail AstraZeneca’s. The recent decline in revenue and EBIT suggests challenges in maintaining growth and operational leverage.
Margin Strength vs. Growth Resilience
AstraZeneca outperforms Pfizer in margin efficiency and revenue growth, with consistent double-digit increases over recent years. Pfizer’s revenue and net income have contracted significantly, undermining its profitability metrics. For investors, AstraZeneca’s profile offers stronger growth and margin expansion potential, while Pfizer faces headwinds affecting its income statement trajectory.
Financial Ratios Comparison
These vital ratios act as a diagnostic tool to expose the underlying fiscal health, valuation premiums, and capital efficiency of the companies compared below:
| Ratios | AstraZeneca PLC (AZN) | Pfizer Inc. (PFE) |
|---|---|---|
| ROE | 17.25% (2024) | 9.09% (2024) |
| ROIC | 10.30% (2024) | 9.28% (2024) |
| P/E | 57.29 (2024) | 18.74 (2024) |
| P/B | 9.88 (2024) | 1.70 (2024) |
| Current Ratio | 0.93 (2024) | 1.17 (2024) |
| Quick Ratio | 0.74 (2024) | 0.92 (2024) |
| D/E | 0.74 (2024) | 0.76 (2024) |
| Debt-to-Assets | 28.95% (2024) | 31.39% (2024) |
| Interest Coverage | 5.95 (2024) | 5.33 (2024) |
| Asset Turnover | 0.52 (2024) | 0.30 (2024) |
| Fixed Asset Turnover | 4.64 (2024) | 3.46 (2024) |
| Payout ratio | 65.80% (2024) | 118.60% (2024) |
| Dividend yield | 1.15% (2024) | 6.33% (2024) |
| Fiscal Year | 2024 | 2024 |
Efficiency & Valuation Duel: The Vital Signs
Financial ratios serve as a company’s DNA, revealing hidden risks and operational excellence beyond surface-level metrics.
AstraZeneca PLC
AstraZeneca posts a strong 17.25% ROE and a solid 13.01% net margin, signaling robust profitability. However, its P/E of 57.29 suggests the stock trades at a premium, potentially stretched versus peers. AstraZeneca returns value with a 1.15% dividend yield, balancing shareholder payouts with heavy R&D reinvestment fueling growth.
Pfizer Inc.
Pfizer shows an 8.35% ROE and a 12.42% net margin, indicating moderate profitability but weaker than AstraZeneca. Its P/E of 18.21 implies a more reasonable valuation. Pfizer offers an attractive 6.91% dividend yield, emphasizing income distribution over aggressive reinvestment, reflecting a mature cash-return strategy.
Premium Valuation vs. Income Stability
AstraZeneca delivers superior profitability but commands a stretched valuation, increasing investment risk. Pfizer offers better income through dividends but lags in operational efficiency. Investors seeking growth may prefer AstraZeneca’s profile, while income-focused investors might favor Pfizer’s steadier yield and valuation balance.
Which one offers the Superior Shareholder Reward?
I see Pfizer delivers a superior shareholder reward in 2026. Its dividend yield of ~6.9% outpaces AstraZeneca’s modest ~1.15%. Pfizer sustains this with a lower payout ratio (~126% vs. AstraZeneca’s ~66%), signaling a more aggressive but still managed distribution. Both companies deploy buybacks, but Pfizer’s higher free cash flow per share and stronger operating margins underpin a more balanced total return strategy. AstraZeneca’s conservative yield and buyback pace suit growth investors, but Pfizer’s robust dividend and capital return intensity better reward income-focused shareholders long term.
Comparative Score Analysis: The Strategic Profile
The radar chart reveals the fundamental DNA and trade-offs of AstraZeneca PLC and Pfizer Inc., highlighting their core financial strengths and weaknesses:
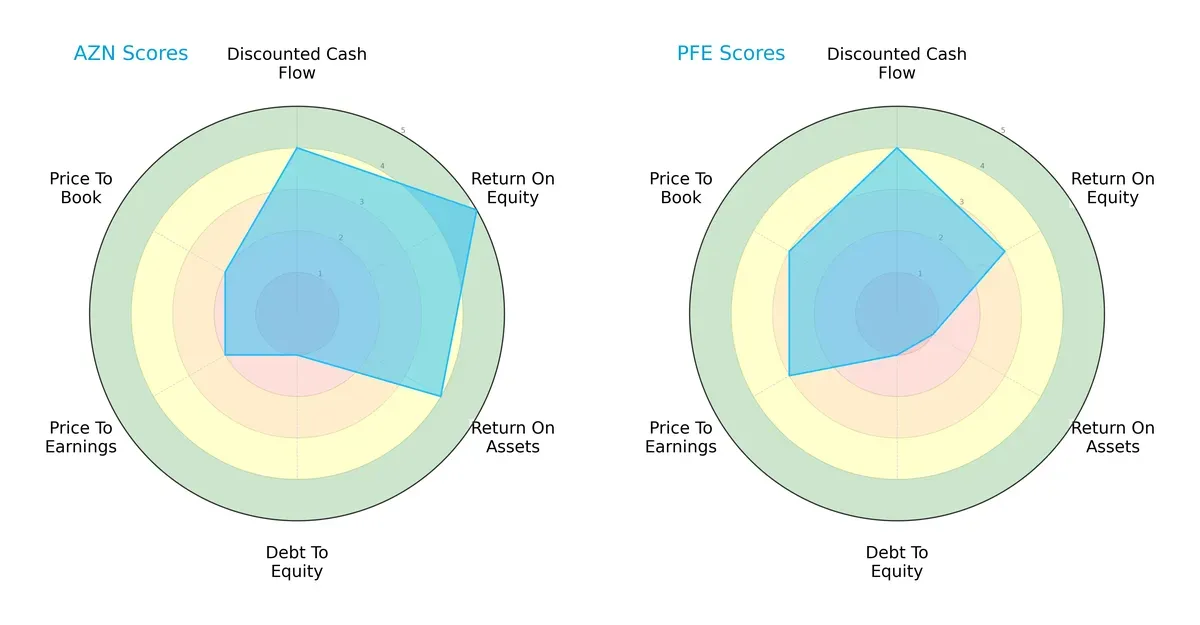
AstraZeneca shows strength in ROE (5) and ROA (4), indicating efficient profit generation and asset use. Pfizer lags in ROA (1) but scores better in valuation metrics (P/E: 3, P/B: 3). Both have weak debt-to-equity scores (1), signaling high leverage risk. AstraZeneca’s profile is more balanced, while Pfizer relies heavily on valuation appeal.
—
Financial Health: Quality of Operations
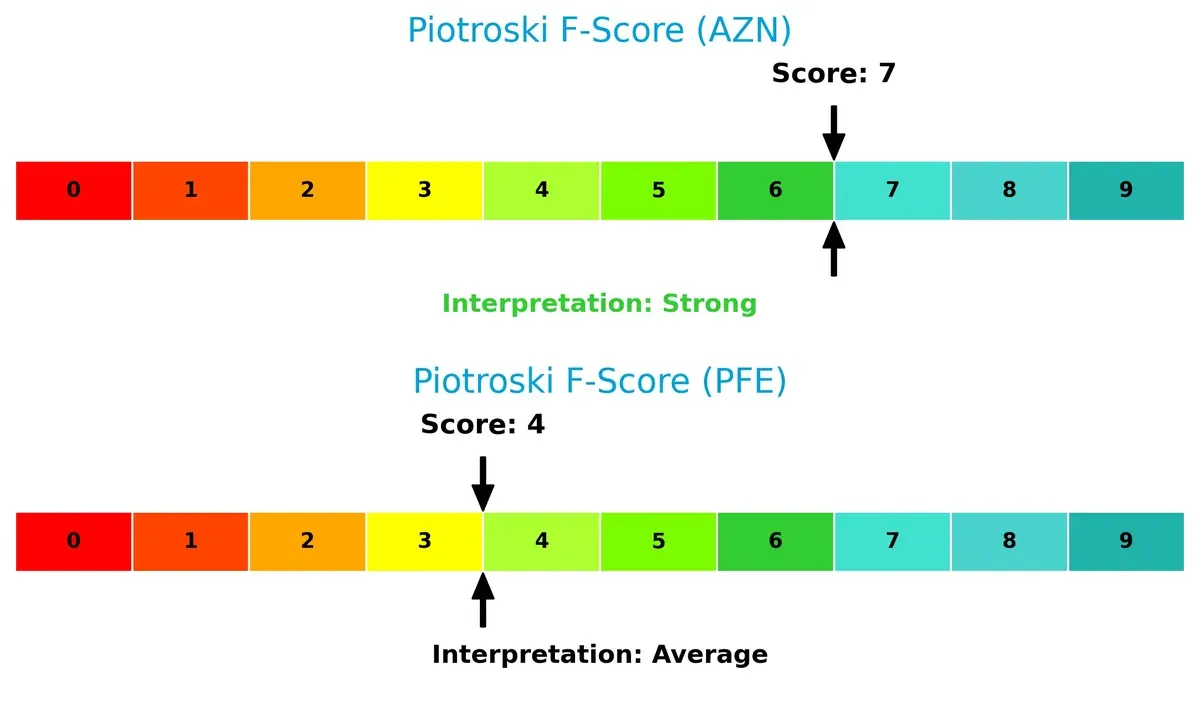
AstraZeneca’s Piotroski F-Score of 7 indicates strong financial health with robust internal metrics. Pfizer’s score of 4 suggests average health and potential red flags compared to AstraZeneca:
How are the two companies positioned?
This section dissects AstraZeneca and Pfizer’s operational DNA by comparing their revenue distribution and internal strengths and weaknesses. The goal is to confront their economic moats to identify which model offers the most resilient competitive advantage today.
Revenue Segmentation: The Strategic Mix
This visual comparison dissects how AstraZeneca PLC and Pfizer Inc. diversify their income streams and where their primary sector bets lie:
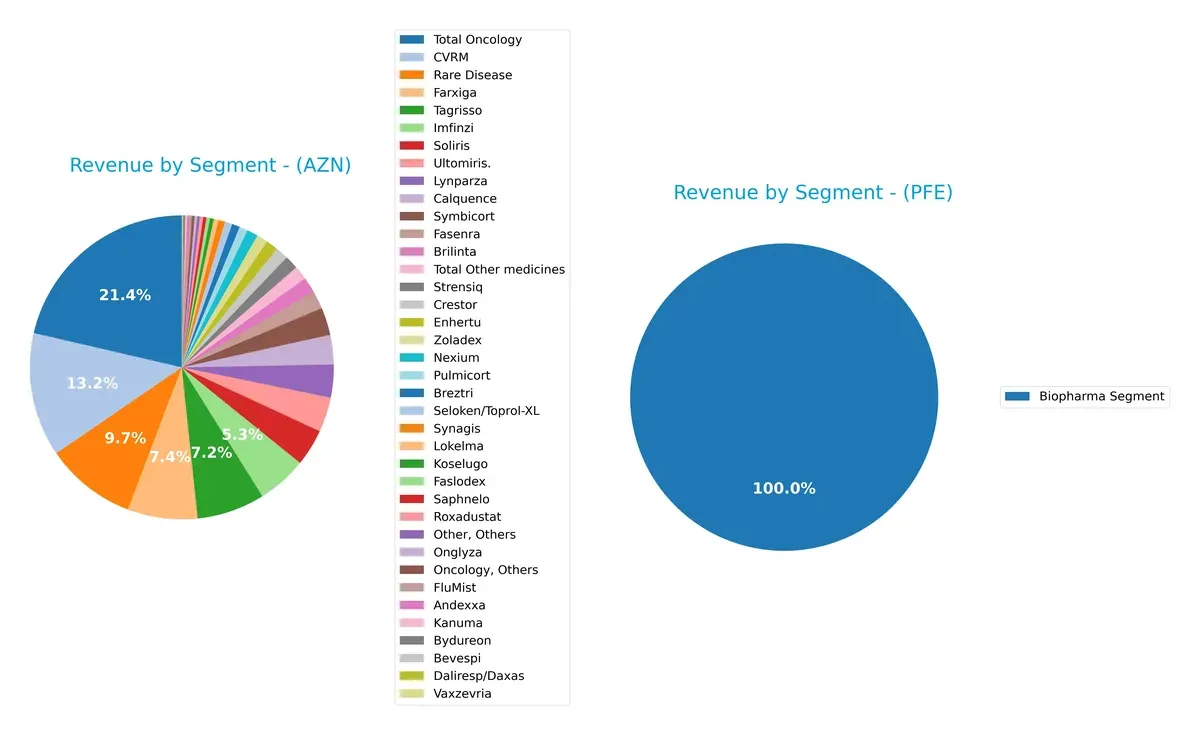
AstraZeneca boasts a highly diversified revenue base, with Oncology ($17.1B) and CVRM ($10.6B) anchoring its portfolio alongside multiple smaller segments. Pfizer leans heavily on its Biopharma segment, which dwarfs other sources at $57.2B in 2023, exposing it to concentration risk. AstraZeneca’s spread signals strategic ecosystem lock-in and innovation breadth, while Pfizer’s focus suggests infrastructure dominance but less segment diversification.
Strengths and Weaknesses Comparison
This table compares the Strengths and Weaknesses of AstraZeneca PLC and Pfizer Inc.:
AstraZeneca PLC Strengths
- Favorable profitability metrics with net margin 13.01% and ROIC 10.3%
- Low debt-to-assets at 28.95%
- Strong innovation presence in oncology and CVRM segments
- Diverse product portfolio with leading oncology revenues
- Favorable interest coverage at 6.17
Pfizer Inc. Strengths
- Large global presence with $62.4B Biopharma segment revenue in 2024
- Favorable WACC at 5.84%
- Higher dividend yield at 6.91%
- Balanced geographic revenue with strong US and emerging markets exposure
- Neutral valuation metrics with PE 18.21 and PB 1.52
AstraZeneca PLC Weaknesses
- Unfavorable high valuation multiples: PE 57.29 and PB 9.88
- Liquidity concerns with current ratio 0.93 and quick ratio 0.74 below 1
- Neutral to low asset turnover at 0.52
- Moderate debt-to-equity at 0.74
- Concentrated oncology and CVRM revenue reliance
Pfizer Inc. Weaknesses
- Unfavorable ROE at 8.35% and ROIC at 0%
- Absence of reported current and quick ratios indicating liquidity risk
- Asset and fixed asset turnover data missing or unfavorable
- Higher unfavorable ratio percentage (42.86%) versus AZN
- Reliance on Biopharma segment with limited diversification data
AstraZeneca shows strong profitability and innovation but faces valuation and liquidity risks. Pfizer benefits from scale and global diversification but struggles with returns and liquidity transparency. Both companies’ strategic focus reflects their core strengths and must address highlighted weaknesses for sustainable growth.
The Moat Duel: Analyzing Competitive Defensibility
A structural moat is the only defense preserving long-term profits against relentless competitive pressure. Let’s dissect the moats of AstraZeneca and Pfizer:
AstraZeneca PLC: Innovation-Driven Intangible Asset Moat
AstraZeneca’s moat stems from its robust intangible assets and innovation pipeline, reflected in a strong 5.6% ROIC premium over WACC and growing profitability. Its expanding oncology and rare disease portfolio in 2026 should deepen this moat.
Pfizer Inc.: Scale and Diversification Moat Under Pressure
Pfizer relies on scale and product diversification, but its declining ROIC and negative growth trends show a weakening competitive edge compared to AstraZeneca. Pfizer’s future depends on successful launches and market adaptation to reverse this decline.
Innovation Intensity vs. Scale Resilience
AstraZeneca’s widening moat, driven by innovation efficiency, outmatches Pfizer’s eroding scale advantage. I see AstraZeneca better positioned to protect profits and capture growth in a competitive pharma landscape.
Which stock offers better returns?
The past year saw AstraZeneca PLC’s stock surge notably, while Pfizer Inc.’s price declined modestly before a recent rebound, highlighting contrasting trading dynamics and momentum shifts.
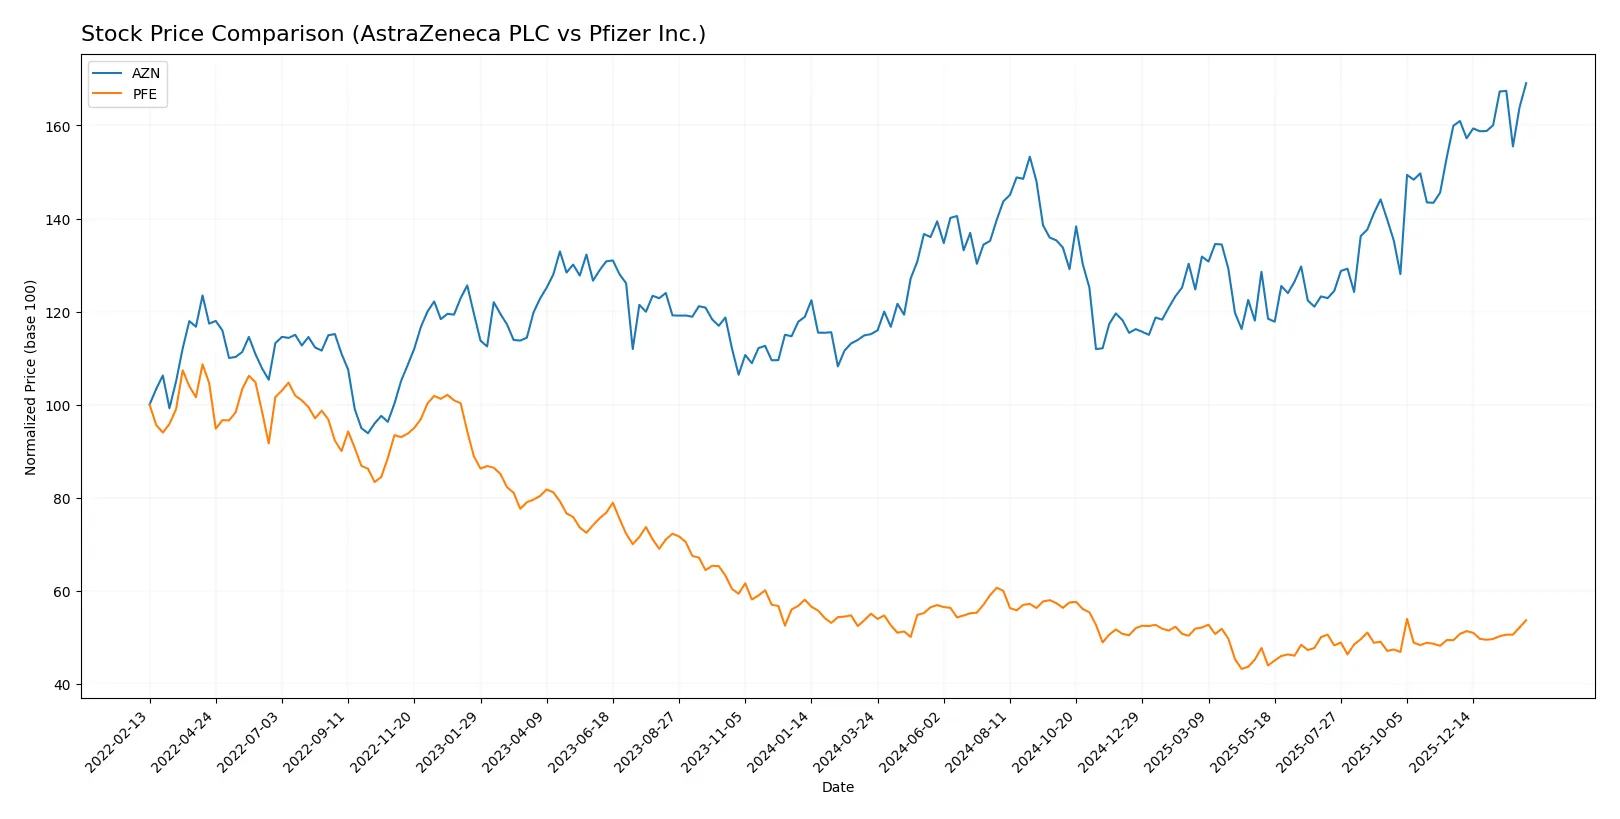
Trend Comparison
AstraZeneca PLC’s stock gained 46.88% over the past 12 months, showing a bullish trend with accelerating momentum and high volatility, peaking at 193.03 and bottoming at 127.74.
Pfizer Inc.’s stock fell 2.58% over the same period, signaling a bearish trend with accelerating pressure but lower volatility, hitting a high of 30.77 and a low of 21.91.
AstraZeneca’s stock significantly outperformed Pfizer’s, delivering the strongest market performance over the past year.
Target Prices
Analyst consensus on target prices shows modest upside potential for Pfizer but significant divergence for AstraZeneca.
| Company | Target Low | Target High | Consensus |
|---|---|---|---|
| AstraZeneca PLC | 103 | 108 | 105.5 |
| Pfizer Inc. | 24 | 35 | 28 |
AstraZeneca’s target consensus (105.5) sits far below its current price (193.03), signaling analyst caution or possible overvaluation. Pfizer’s consensus (28) aligns closely with its current price (27.22), indicating balanced market expectations.

Don’t Let Luck Decide Your Entry Point
Optimize your entry points with our advanced ProRealTime indicators. You’ll get efficient buy signals with precise price targets for maximum performance. Start outperforming now!
How do institutions grade them?
Here is a summary of the latest institutional grades for AstraZeneca PLC and Pfizer Inc.:
AstraZeneca PLC Grades
The table below shows recent grade changes from reputable firms for AstraZeneca PLC.
| Grading Company | Action | New Grade | Date |
|---|---|---|---|
| UBS | Upgrade | Buy | 2025-02-13 |
| UBS | Upgrade | Neutral | 2024-11-20 |
| Erste Group | Upgrade | Buy | 2024-09-11 |
| TD Cowen | Maintain | Buy | 2024-08-12 |
| Argus Research | Maintain | Buy | 2024-05-30 |
| BMO Capital | Maintain | Outperform | 2024-04-26 |
| Deutsche Bank | Upgrade | Hold | 2024-04-16 |
| BMO Capital | Maintain | Outperform | 2024-02-12 |
| Deutsche Bank | Downgrade | Hold | 2024-02-08 |
| Jefferies | Downgrade | Hold | 2024-01-03 |
Pfizer Inc. Grades
The table below shows recent grade maintenance actions from recognized firms for Pfizer Inc.
| Grading Company | Action | New Grade | Date |
|---|---|---|---|
| Cantor Fitzgerald | Maintain | Neutral | 2026-02-04 |
| Cantor Fitzgerald | Maintain | Neutral | 2026-01-27 |
| Morgan Stanley | Maintain | Equal Weight | 2025-12-17 |
| B of A Securities | Maintain | Neutral | 2025-12-15 |
| Morgan Stanley | Maintain | Equal Weight | 2025-12-12 |
| Guggenheim | Maintain | Buy | 2025-11-24 |
| Morgan Stanley | Maintain | Equal Weight | 2025-10-10 |
| B of A Securities | Maintain | Neutral | 2025-10-03 |
| B of A Securities | Maintain | Neutral | 2025-08-06 |
| Morgan Stanley | Maintain | Equal Weight | 2025-08-06 |
Which company has the best grades?
AstraZeneca shows multiple recent upgrades and consistently high grades, including several Buy and Outperform ratings. Pfizer’s grades remain stable, mostly Neutral and Equal Weight. AstraZeneca’s stronger upgrades may signal higher institutional confidence, influencing investor perception.
Risks specific to each company
The following categories identify the critical pressure points and systemic threats facing both firms in the 2026 market environment:
1. Market & Competition
AstraZeneca PLC
- Faces intense competition in oncology and rare diseases, with a premium valuation reflecting growth expectations.
Pfizer Inc.
- Competes broadly in vaccines and biopharma but shows weaker ROIC, signaling operational challenges amid competition.
2. Capital Structure & Debt
AstraZeneca PLC
- Maintains a moderate debt-to-equity ratio (0.74), manageable interest coverage (6.17x), but liquidity ratios below 1 raise caution.
Pfizer Inc.
- Exhibits minimal debt, strong balance sheet, but lacks current and quick ratio data, which clouds short-term liquidity assessment.
3. Stock Volatility
AstraZeneca PLC
- Low beta (0.19) implies defensive stock behavior amid market fluctuations.
Pfizer Inc.
- Moderate beta (0.44) indicates higher sensitivity to market swings, increasing volatility risk.
4. Regulatory & Legal
AstraZeneca PLC
- Global operations expose it to diverse regulatory regimes, especially in the EU and UK, raising compliance complexity.
Pfizer Inc.
- US-based with broader vaccine portfolio, faces regulatory scrutiny but benefits from established FDA relations.
5. Supply Chain & Operations
AstraZeneca PLC
- Complex supply chains across multiple continents increase exposure to operational disruptions.
Pfizer Inc.
- Large-scale manufacturing and contract production add operational complexity and reliance on third parties.
6. ESG & Climate Transition
AstraZeneca PLC
- Actively invests in sustainable drug discovery partnerships and ESG practices, enhancing long-term resilience.
Pfizer Inc.
- ESG efforts present but less prominently highlighted, potentially trailing peers in climate transition leadership.
7. Geopolitical Exposure
AstraZeneca PLC
- UK and EU focus exposes it to Brexit-related uncertainties and European regulatory shifts.
Pfizer Inc.
- Primarily US-centric but with global footprint; geopolitical tensions could disrupt international vaccine distribution.
Which company shows a better risk-adjusted profile?
AstraZeneca’s key risk lies in its stretched liquidity ratios despite strong profitability and defensive stock volatility. Pfizer faces operational and profitability pressure, reflected in weaker ROIC and moderate stock volatility. AstraZeneca’s robust Altman Z-Score (6.18, safe zone) and strong Piotroski (7) outperform Pfizer’s average Piotroski (4) and unavailable Z-Score. This signals AstraZeneca holds a superior risk-adjusted profile, supported by its stable market positioning and financial strength, while Pfizer’s challenges warrant cautious monitoring.
Final Verdict: Which stock to choose?
AstraZeneca’s superpower lies in its robust value creation, evidenced by a strong and growing ROIC that comfortably exceeds its cost of capital. Its aggressive investment in R&D fuels sustainable competitive advantage, though a below-par liquidity position remains a point of vigilance. AstraZeneca suits portfolios seeking aggressive growth with a tolerance for operational complexity.
Pfizer stands out for its strategic moat anchored in diversified revenue streams and a reliable dividend yield. Its more conservative financial structure offers relatively better stability compared to AstraZeneca’s leverage concerns. Pfizer fits well within GARP portfolios aiming for a blend of steady income and moderate growth potential.
If you prioritize high-value creation and long-term growth fueled by innovation, AstraZeneca presents a compelling scenario due to its expanding profitability and market momentum. However, if you seek a safer profile with consistent dividends and steadier cash flows, Pfizer offers better stability despite recent headwinds and declining ROIC trends.
Disclaimer: Investment carries a risk of loss of initial capital. The past performance is not a reliable indicator of future results. Be sure to understand risks before making an investment decision.
Go Further
I encourage you to read the complete analyses of AstraZeneca PLC and Pfizer Inc. to enhance your investment decisions: