AstraZeneca PLC and Merck & Co., Inc. stand as titans in the pharmaceutical industry, both driving innovation in drug development and global healthcare solutions. AstraZeneca, based in the UK, and Merck, headquartered in the US, overlap significantly in oncology, vaccines, and rare diseases, reflecting their competitive and collaborative dynamics. This article will analyze their strategies and performance to help you decide which company deserves a place in your investment portfolio.

Table of contents
Companies Overview
I will begin the comparison between AstraZeneca PLC and Merck & Co., Inc. by providing an overview of these two companies and their main differences.
AstraZeneca Overview
AstraZeneca PLC is a biopharmaceutical company headquartered in Cambridge, UK, focused on discovering, developing, manufacturing, and commercializing prescription medicines. It serves primary and specialty care physicians globally, with marketed products addressing cardiovascular, renal, metabolism, oncology, rare diseases, and COVID-19. AstraZeneca emphasizes collaborations and AI-driven drug discovery, positioning itself as a key player in innovative healthcare solutions.
Merck Overview
Merck & Co., Inc., based in Kenilworth, NJ, operates globally in healthcare through pharmaceutical and animal health segments. Its pharmaceutical products cover oncology, immunology, neuroscience, cardiovascular, diabetes, and vaccines, while the animal health segment offers veterinary pharmaceuticals and health management solutions. Merck serves a diverse customer base, including hospitals, government agencies, and healthcare providers, and maintains strategic collaborations for advancing long-acting HIV treatments.
Key similarities and differences
Both AstraZeneca and Merck operate in the drug manufacturing industry with a strong focus on innovative pharmaceuticals and global healthcare markets. They collaborate with other firms for research and development, emphasizing oncology and immunology among other fields. A key difference is Merck’s additional animal health segment, expanding its market beyond human pharmaceuticals, whereas AstraZeneca concentrates solely on biopharmaceutical prescription medicines.
Income Statement Comparison
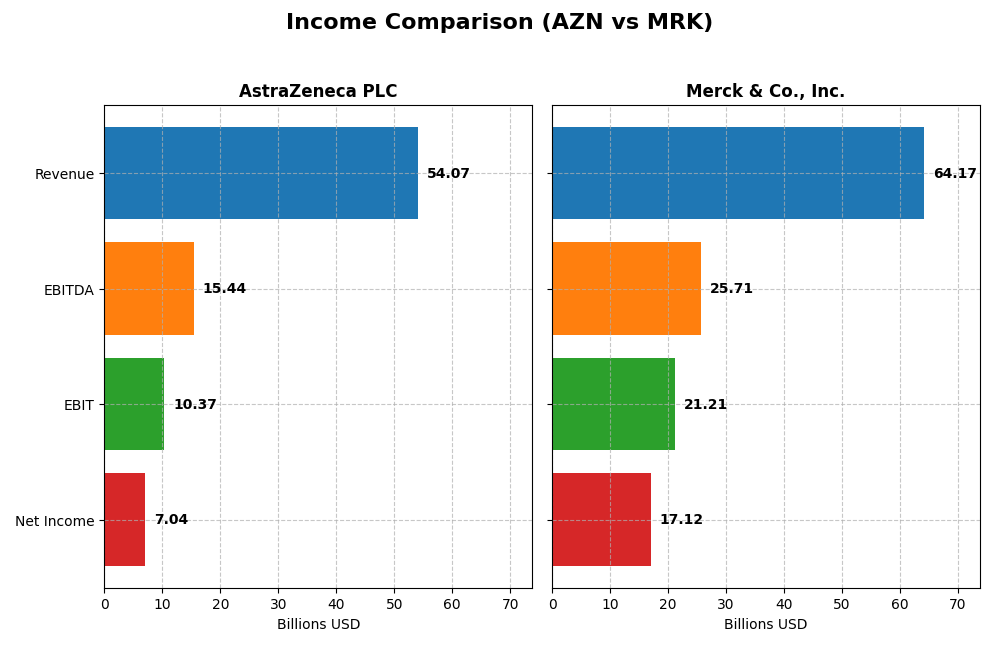
Below is a comparison of key income statement metrics for AstraZeneca PLC and Merck & Co., Inc. for the fiscal year 2024.
| Metric | AstraZeneca PLC (AZN) | Merck & Co., Inc. (MRK) |
|---|---|---|
| Market Cap | 293B | 278B |
| Revenue | 54.1B | 64.2B |
| EBITDA | 15.4B | 25.7B |
| EBIT | 10.4B | 21.2B |
| Net Income | 7.0B | 17.1B |
| EPS | 1.14 | 6.76 |
| Fiscal Year | 2024 | 2024 |
Income Statement Interpretations
AstraZeneca PLC
AstraZeneca demonstrated strong revenue growth from 2020 to 2024, more than doubling its top line to $54B in 2024. Net income followed a similar upward trajectory, reaching $7B in 2024. Margins remained stable and favorable, with a gross margin above 81% and net margin around 13%. The 2024 fiscal year showed solid revenue and EBIT growth, though EPS declined sharply.
Merck & Co., Inc.
Merck’s revenue rose steadily by 55% over five years, hitting $64B in 2024, with net income more than doubling to $17B. Margins improved significantly; the 2024 net margin was 26.7%, and EBIT margin surpassed 33%. The latest year saw moderate revenue growth but exceptional expansion in EBIT, net margin, and EPS, reflecting improved profitability and operational leverage.
Which one has the stronger fundamentals?
Both companies exhibit favorable income statement fundamentals, but Merck’s higher and expanding margins, combined with exceptional recent growth in EBIT, net margin, and EPS, suggest stronger profitability and operational efficiency. AstraZeneca shows robust growth and stable margins but faces EPS headwinds. Overall, Merck’s fundamentals appear more favorable based on margin quality and recent earnings performance.
Financial Ratios Comparison
The table below presents a side-by-side comparison of key financial ratios for AstraZeneca PLC (AZN) and Merck & Co., Inc. (MRK) based on their most recent fiscal year data from 2024.
| Ratios | AstraZeneca PLC (AZN) | Merck & Co., Inc. (MRK) |
|---|---|---|
| ROE | 17.25% | 36.96% |
| ROIC | 10.30% | 18.97% |
| P/E | 28.87 | 14.72 |
| P/B | 4.98 | 5.44 |
| Current Ratio | 0.93 | 1.36 |
| Quick Ratio | 0.74 | 1.15 |
| D/E | 0.74 | 0.83 |
| Debt-to-Assets | 28.95% | 32.68% |
| Interest Coverage | 5.95 | 15.91 |
| Asset Turnover | 0.52 | 0.55 |
| Fixed Asset Turnover | 4.64 | 2.70 |
| Payout ratio | 65.80% | 45.80% |
| Dividend yield | 2.28% | 3.11% |
Interpretation of the Ratios
AstraZeneca PLC
AstraZeneca exhibits predominantly favorable profitability ratios, including a 17.25% return on equity and a 10.3% return on invested capital, signaling solid operational performance. However, liquidity appears weak with a current ratio below 1, while valuation metrics like a PE of 28.87 and PB of 4.98 are unfavorable. AstraZeneca maintains a 2.28% dividend yield, supported by stable payouts, but cautious monitoring of cash flow coverage is advisable.
Merck & Co., Inc.
Merck shows strong profitability with a 36.96% return on equity and an impressive 26.68% net margin. Its valuation is attractive, featuring a PE ratio of 14.72, though the PB ratio at 5.44 is less favorable. Liquidity ratios are generally sound, with a current ratio of 1.36 and quick ratio above 1. Merck offers a 3.11% dividend yield, reflecting consistent shareholder returns backed by robust free cash flow.
Which one has the best ratios?
Both AstraZeneca and Merck present a majority of favorable ratios at 57.14%, yet Merck’s stronger profitability, better liquidity, and more attractive PE ratio provide it a slightly more robust financial profile. AstraZeneca’s weaker liquidity and higher valuation ratios temper its strengths. Overall, Merck edges ahead in terms of balance across profitability, valuation, and liquidity metrics.
Strategic Positioning
This section compares the strategic positioning of AstraZeneca and Merck, focusing on market position, key segments, and exposure to disruption:
AstraZeneca
- Strong global presence in prescription medicines with moderate competitive pressure.
- Focus on oncology, cardiovascular, renal, metabolism, respiratory, rare diseases, and COVID-19 products.
- Collaborations using AI-driven drug discovery and digital pathology tools indicate moderate exposure.
Merck
- Leading healthcare company with broad market reach facing competitive pressure.
- Two segments: Pharmaceuticals (human health) and Animal Health, with diverse business drivers.
- Collaborates on long-acting HIV treatments; digital and veterinary innovations reflect technological engagement.
AstraZeneca vs Merck Positioning
AstraZeneca’s strategy concentrates on specialty medicines and rare diseases, offering focused innovation but narrower diversification. Merck’s diversified approach spans pharmaceuticals and animal health, providing broader revenue streams with varied business drivers and market exposure.
Which has the best competitive advantage?
Both companies show very favorable moats with growing ROIC above WACC, indicating durable competitive advantages. Merck’s higher ROIC and stronger growth trend suggest a more pronounced efficiency in capital usage and profitability.
Stock Comparison
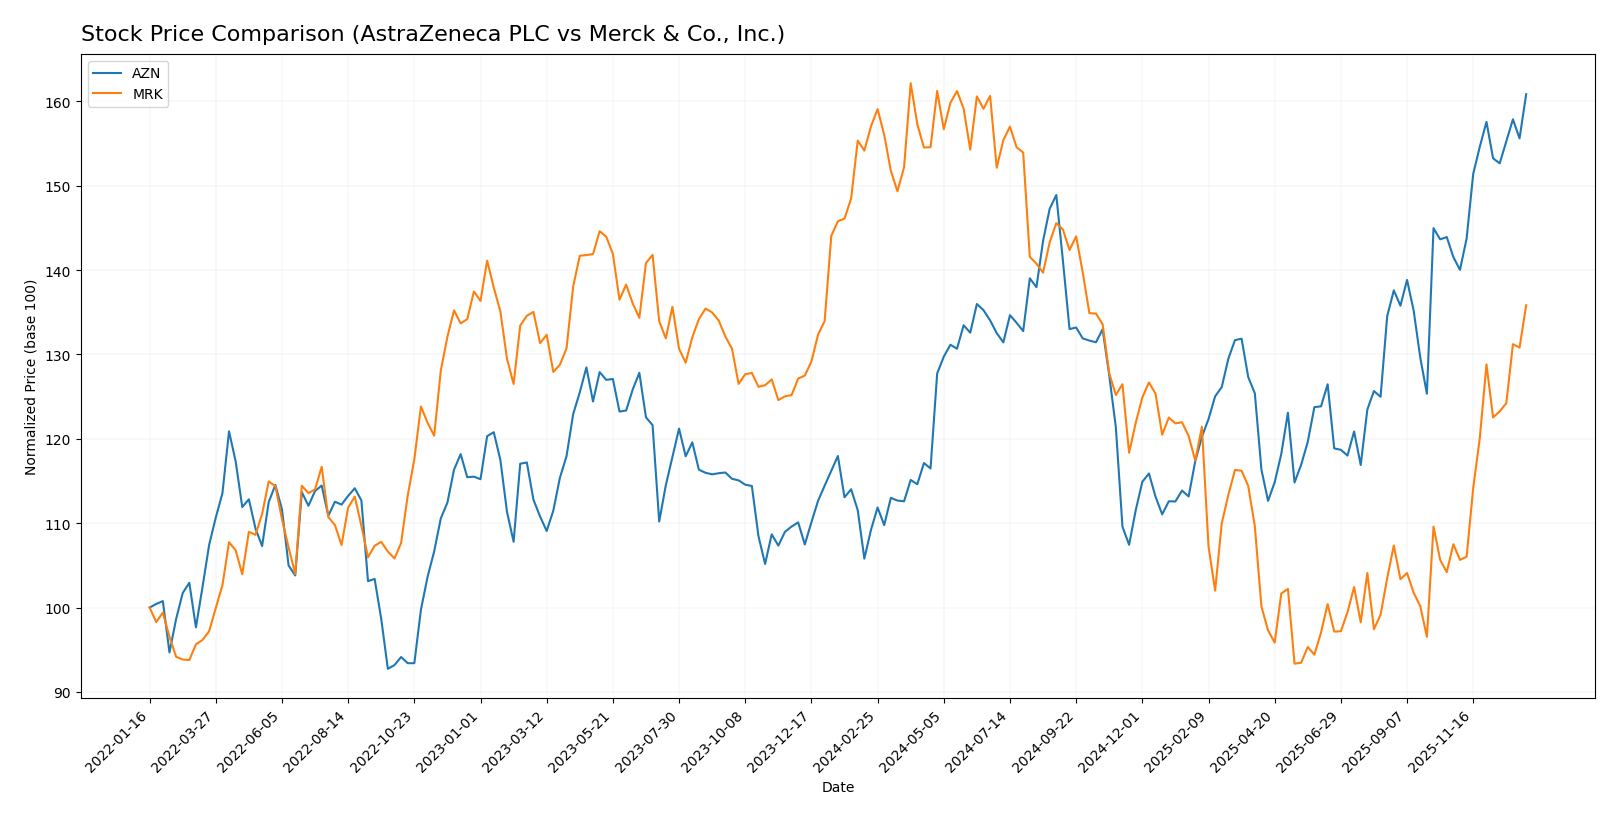
The stock prices of AstraZeneca PLC and Merck & Co., Inc. have shown contrasting dynamics over the past year, with AstraZeneca demonstrating a strong upward trend while Merck experienced a notable decline followed by recent gains.
Trend Analysis
AstraZeneca PLC’s stock price increased by 47.27% over the past 12 months, indicating a bullish trend with acceleration. The price fluctuated between 63.23 and 94.65, with moderate volatility (7.74 std deviation).
Merck & Co., Inc. showed a bearish trend over the same period, with a 13.51% price decline despite acceleration. It reached a high of 131.95 and a low of 75.97, exhibiting higher volatility (18.04 std deviation).
Comparing both, AstraZeneca delivered the highest market performance over the year with sustained growth, while Merck’s performance was negative overall but showed recent recovery.
Target Prices
The current analyst consensus presents optimistic target prices for both AstraZeneca PLC and Merck & Co., Inc.
| Company | Target High | Target Low | Consensus |
|---|---|---|---|
| AstraZeneca PLC | 108 | 103 | 105.5 |
| Merck & Co., Inc. | 135 | 90 | 118.78 |
Analysts expect AstraZeneca’s price to rise modestly above its current $94.65, while Merck’s consensus target suggests a significant upside from its $110.53 trading price. Both stocks show positive growth potential.
Analyst Opinions Comparison
This section compares analysts’ ratings and grades for AstraZeneca PLC and Merck & Co., Inc.:
Rating Comparison
AstraZeneca PLC Rating
- Rating: B+ indicating a very favorable status.
- Discounted Cash Flow Score: 4, a favorable rating.
- ROE Score: 5, very favorable efficiency in profit generation.
- ROA Score: 4, favorable asset utilization.
- Debt To Equity Score: 1, very unfavorable balance sheet risk.
- Overall Score: 3, moderate overall financial standing.
Merck & Co., Inc. Rating
- Rating: A- indicating a very favorable status.
- Discounted Cash Flow Score: 5, a very favorable rating.
- ROE Score: 5, very favorable efficiency in profit generation.
- ROA Score: 5, very favorable asset utilization.
- Debt To Equity Score: 1, very unfavorable balance sheet risk.
- Overall Score: 4, favorable overall financial standing.
Which one is the best rated?
Merck holds a higher overall score (4 vs. 3) and excels with very favorable ratings in discounted cash flow and asset utilization compared to AstraZeneca. Both share very unfavorable debt-to-equity scores, but Merck is better rated overall based on the provided data.
Scores Comparison
Here is a comparison of the Altman Z-Score and Piotroski Score for AstraZeneca PLC and Merck & Co., Inc.:
AstraZeneca Scores
- Altman Z-Score: 3.51, indicating a safe zone with low bankruptcy risk.
- Piotroski Score: 7, classified as strong financial health.
Merck Scores
- Altman Z-Score: 4.52, indicating a safe zone with low bankruptcy risk.
- Piotroski Score: 6, classified as average financial health.
Which company has the best scores?
Merck has a higher Altman Z-Score, indicating slightly lower bankruptcy risk, while AstraZeneca has a stronger Piotroski Score, reflecting better financial strength. Both companies fall within safe financial zones based on the data provided.
Grades Comparison
The following grades from reputable financial institutions compare AstraZeneca PLC and Merck & Co., Inc.:
AstraZeneca PLC Grades
This table summarizes recent grade changes by established grading companies for AstraZeneca PLC.
| Grading Company | Action | New Grade | Date |
|---|---|---|---|
| UBS | Upgrade | Buy | 2025-02-13 |
| UBS | Upgrade | Neutral | 2024-11-20 |
| Erste Group | Upgrade | Buy | 2024-09-11 |
| TD Cowen | Maintain | Buy | 2024-08-12 |
| Argus Research | Maintain | Buy | 2024-05-30 |
| BMO Capital | Maintain | Outperform | 2024-04-26 |
| Deutsche Bank | Upgrade | Hold | 2024-04-16 |
| BMO Capital | Maintain | Outperform | 2024-02-12 |
| Deutsche Bank | Downgrade | Hold | 2024-02-08 |
| Jefferies | Downgrade | Hold | 2024-01-03 |
Overall, AstraZeneca’s grades have shown a positive trend with multiple upgrades to Buy and Outperform, though some recent downgrades to Hold indicate mixed sentiment.
Merck & Co., Inc. Grades
The following table presents recent reliable grades for Merck & Co., Inc. from recognized financial analysts.
| Grading Company | Action | New Grade | Date |
|---|---|---|---|
| Wolfe Research | Upgrade | Outperform | 2026-01-08 |
| Citigroup | Maintain | Neutral | 2026-01-07 |
| UBS | Maintain | Buy | 2026-01-07 |
| BMO Capital | Upgrade | Outperform | 2025-12-18 |
| B of A Securities | Maintain | Buy | 2025-12-15 |
| Morgan Stanley | Maintain | Equal Weight | 2025-12-12 |
| Scotiabank | Maintain | Sector Outperform | 2025-12-04 |
| Goldman Sachs | Maintain | Buy | 2025-12-02 |
| Wells Fargo | Upgrade | Overweight | 2025-11-24 |
| Deutsche Bank | Maintain | Hold | 2025-11-18 |
Merck’s grades indicate a strong and consistent buy-side sentiment with several upgrades and many stable Buy or Outperform ratings.
Which company has the best grades?
Merck & Co., Inc. holds a stronger consensus with more recent and consistent upgrades to Outperform and Buy ratings compared to AstraZeneca’s mix of Buy and Hold grades. This suggests Merck currently enjoys broader analyst confidence, potentially influencing investor sentiment favorably.
Strengths and Weaknesses
Below is a comparative overview of the strengths and weaknesses of AstraZeneca PLC (AZN) and Merck & Co., Inc. (MRK) based on their recent financial and market data.
| Criterion | AstraZeneca PLC (AZN) | Merck & Co., Inc. (MRK) |
|---|---|---|
| Diversification | Strong product diversification across oncology, CVRM, rare diseases, and respiratory segments. | Broad diversification with pharmaceutical and animal health segments, strong pharmaceutical focus. |
| Profitability | Favorable net margin (13.01%) and ROIC (10.3%), but higher P/E (28.87) and some liquidity concerns. | Higher net margin (26.68%) and ROIC (18.97%), attractive P/E (14.72), strong liquidity ratios. |
| Innovation | Growing ROIC trend (+21.3%), robust pipeline in oncology and rare diseases indicating continuous innovation. | Very strong ROIC growth (+214.6%), sustained investment in pharmaceuticals driving innovation. |
| Global presence | Established global footprint with significant revenues from multiple regions and products. | Extensive global reach with dominant pharmaceutical sales and growing animal health segment. |
| Market Share | Leading positions in oncology and CVRM; oncology revenue at $17.1B in 2023. | Large market share in pharmaceuticals with $57.4B revenue in 2024; animal health growing steadily. |
Key takeaways: Both AstraZeneca and Merck demonstrate durable competitive advantages with favorable profitability and diversified portfolios. Merck leads in profitability metrics and valuation attractiveness, while AstraZeneca shows strong innovation in oncology and rare diseases. Investors should weigh liquidity and valuation considerations when choosing between them.
Risk Analysis
Below is a comparative table highlighting the key risk factors for AstraZeneca PLC (AZN) and Merck & Co., Inc. (MRK) based on the most recent data from 2024:
| Metric | AstraZeneca PLC (AZN) | Merck & Co., Inc. (MRK) |
|---|---|---|
| Market Risk | Low beta 0.19 indicates low volatility | Low beta 0.30, moderate volatility |
| Debt Level | Debt to assets 29%, debt/equity 0.74 (neutral) | Debt to assets 33%, debt/equity 0.83 (neutral) |
| Regulatory Risk | High due to global operations and drug approvals | High, with global regulatory scrutiny |
| Operational Risk | Moderate, with complex R&D and manufacturing | Moderate, diversified pharma and animal health segments |
| Environmental Risk | Moderate, pharmaceutical waste and sustainability focus | Moderate, increasing emphasis on sustainability |
| Geopolitical Risk | Exposure due to UK and emerging markets | Exposure due to US base and global markets |
The most impactful risks for both AZN and MRK are regulatory and geopolitical challenges, given their extensive global operations and reliance on drug approvals. AstraZeneca’s low market volatility reduces price risk, while Merck’s slightly higher beta indicates moderate sensitivity to market swings. Both companies maintain manageable debt levels but must monitor evolving regulations closely.
Which Stock to Choose?
AstraZeneca PLC (AZN) shows strong income growth with a 103% revenue increase and favorable profitability ratios such as a 17.25% ROE and 13.01% net margin. Its debt levels are moderate with a net debt to EBITDA of 1.6 and a very favorable overall rating of B+.
Merck & Co., Inc. (MRK) reports solid income expansion with 55% revenue growth and highly favorable financial ratios including a 36.96% ROE and 26.68% net margin. The company maintains manageable debt with a net debt to EBITDA under 1 and holds a very favorable A- rating.
Investors prioritizing strong profitability and higher income growth might find Merck’s robust ROE and net margin appealing, while those valuing consistent value creation and a balanced financial profile could interpret AstraZeneca’s durable competitive advantage and moderate debt as favorable. The choice could depend on whether one favors growth intensity or steadier capital efficiency.
Disclaimer: Investment carries a risk of loss of initial capital. The past performance is not a reliable indicator of future results. Be sure to understand risks before making an investment decision.
Go Further
I encourage you to read the complete analyses of AstraZeneca PLC and Merck & Co., Inc. to enhance your investment decisions: