Home > Comparison > Healthcare > JNJ vs AZN
The strategic rivalry between Johnson & Johnson and AstraZeneca defines the current trajectory of the global healthcare sector. Johnson & Johnson operates as a diversified healthcare conglomerate focusing on innovative medicines and medical devices. AstraZeneca pursues a biopharmaceutical model centered on prescription drug development and commercialization. This analysis evaluates their contrasting growth strategies and operational models to identify which offers a superior risk-adjusted return for diversified portfolios.

Table of contents
Companies Overview
Johnson & Johnson and AstraZeneca stand as titans in the global pharmaceutical arena, shaping healthcare innovation.
Johnson & Johnson: Diversified Healthcare Powerhouse
Johnson & Johnson dominates as a healthcare conglomerate with a focus on Innovative Medicine and MedTech. It generates revenue through prescription drugs for complex diseases and advanced medical devices. In 2026, J&J prioritizes innovation-driven growth after spinning off its Consumer Health segment to Kenvue, concentrating on high-margin pharmaceuticals and technology solutions.
AstraZeneca PLC: Biopharmaceutical Innovator
AstraZeneca is a leading biopharmaceutical company specializing in prescription medicines across oncology, cardiovascular, and rare diseases. Its revenue stems from a broad portfolio including Tagrisso and Imfinzi. AstraZeneca’s 2026 strategy emphasizes cutting-edge collaborations and AI-driven drug discovery to accelerate novel therapies, reinforcing its position in specialty care markets worldwide.
Strategic Collision: Similarities & Divergences
Both companies focus on innovation in pharmaceuticals, yet J&J balances diversified medical devices while AstraZeneca pursues biotechnology partnerships and AI integration. Their primary battleground lies in specialty drugs for complex diseases. J&J’s broad healthcare exposure contrasts with AstraZeneca’s biopharma-centric profile, offering distinct investment narratives grounded in differing risk and growth dynamics.
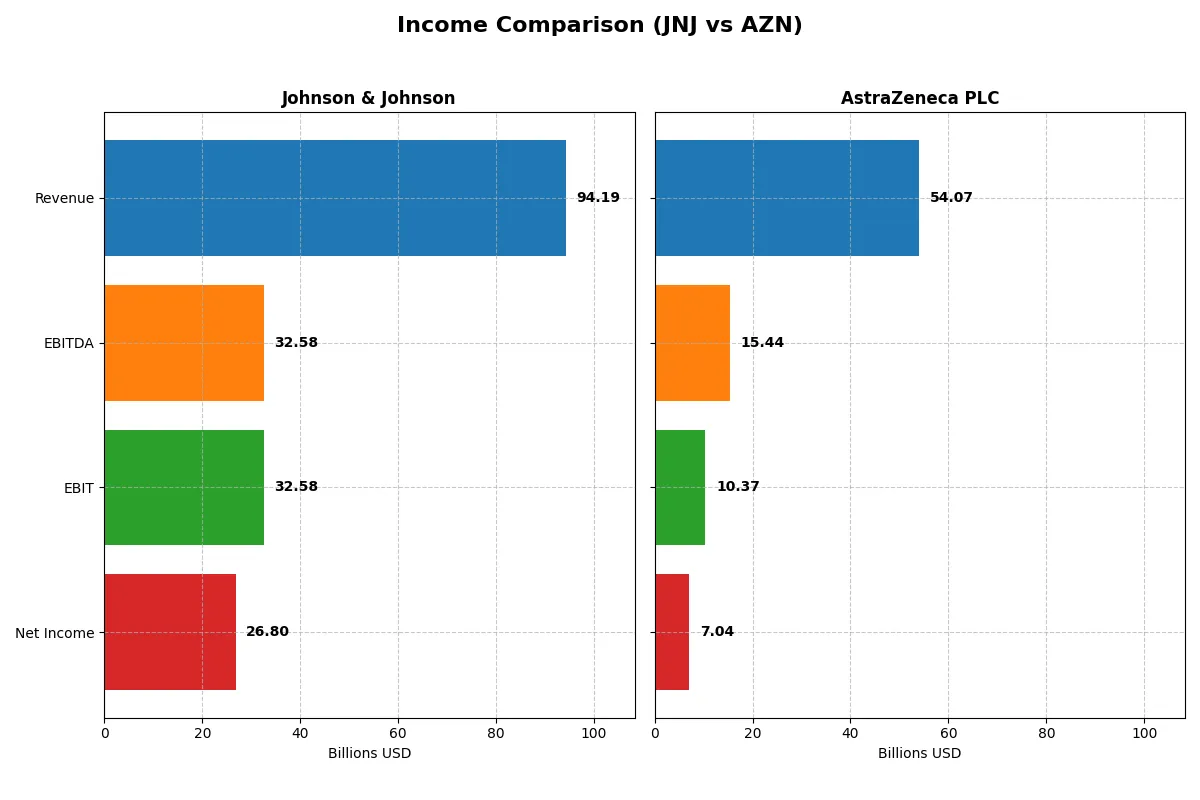
Income Statement Comparison
This data dissects the core profitability and scalability of both corporate engines to reveal who dominates the bottom line:
| Metric | Johnson & Johnson (JNJ) | AstraZeneca PLC (AZN) |
|---|---|---|
| Revenue | 94.2B | 54.1B |
| Cost of Revenue | 25.6B | 10.2B |
| Operating Expenses | 42.9B | 33.9B |
| Gross Profit | 68.6B | 43.9B |
| EBITDA | 32.6B | 15.4B |
| EBIT | 32.6B | 10.4B |
| Interest Expense | 0 | 1.7B |
| Net Income | 26.8B | 7.0B |
| EPS | 11.03 | 1.14 |
| Fiscal Year | 2025 | 2024 |
Income Statement Analysis: The Bottom-Line Duel
This income statement comparison reveals the true efficiency of Johnson & Johnson and AstraZeneca’s corporate engines through their revenue, margin, and net income trends.
Johnson & Johnson Analysis
Johnson & Johnson’s revenue grew steadily from $79.9B in 2022 to $94.2B in 2025, with net income surging from $17.9B to $26.8B. Its gross margin holds strong at 72.8%, while net margin impressively reaches 28.5%. In 2025, EBIT soared 87%, signaling sharp operational momentum and enhanced profitability.
AstraZeneca PLC Analysis
AstraZeneca’s revenue jumped 18% in 2024 to $54.1B, doubling since 2020. Gross margin remains robust at 81.1%, but net margin lags at 13.0%. EBIT grew 22% year-over-year, reflecting solid top-line expansion, though EPS declined sharply, hinting at potential dilution or higher costs impacting bottom-line efficiency.
Margin Strength vs. Growth Velocity
Johnson & Johnson leads with superior net margins and a strong EBIT rebound, demonstrating exceptional operational efficiency. AstraZeneca boasts faster revenue growth and higher gross margins but suffers from weaker net profitability and EPS setbacks. For investors prioritizing consistent profitability, Johnson & Johnson’s profile stands out as the fundamentally stronger choice.
Financial Ratios Comparison
These vital ratios act as a diagnostic tool to expose the underlying fiscal health, valuation premiums, and capital efficiency of the companies compared below:
| Ratios | Johnson & Johnson (JNJ) | AstraZeneca PLC (AZN) |
|---|---|---|
| ROE | 19.7% (2024) | 17.2% (2024) |
| ROIC | 13.8% (2024) | 10.3% (2024) |
| P/E | 24.5 (2024) | 28.9 (2024) |
| P/B | 4.83 (2024) | 4.98 (2024) |
| Current Ratio | 1.11 (2024) | 0.93 (2024) |
| Quick Ratio | 0.86 (2024) | 0.74 (2024) |
| D/E | 0.51 (2024) | 0.74 (2024) |
| Debt-to-Assets | 20.3% (2024) | 28.9% (2024) |
| Interest Coverage | 29.3 (2024) | 5.95 (2024) |
| Asset Turnover | 0.49 (2024) | 0.52 (2024) |
| Fixed Asset Turnover | 4.33 (2024) | 4.64 (2024) |
| Payout ratio | 84.1% (2024) | 66.0% (2024) |
| Dividend yield | 3.43% (2024) | 2.28% (2024) |
| Fiscal Year | 2024 | 2024 |
Efficiency & Valuation Duel: The Vital Signs
Financial ratios act as a company’s DNA, exposing hidden risks and operational excellence critical for informed investment decisions.
Johnson & Johnson
JNJ demonstrates strong profitability with a favorable 28.46% net margin but lacks reported ROE and ROIC data, limiting efficiency insights. Its P/E ratio of 18.75 suggests a neutral valuation, balancing cost and growth expectations. JNJ rewards shareholders with a 2.48% dividend yield, indicating steady income rather than aggressive reinvestment.
AstraZeneca PLC
AZN shows solid core profitability, with a 17.25% ROE and 13.01% net margin, reflecting operational efficiency. However, its valuation appears stretched, with a high P/E of 28.87 and elevated P/B of 4.98. AstraZeneca offers a 2.28% dividend yield but relies heavily on R&D, as seen in its capital allocation toward growth and innovation.
Balanced Profitability vs. Growth Premium
JNJ offers a more conservative valuation with reliable dividends, fitting investors seeking income and stability. AZN delivers higher returns on equity but carries valuation risk, appealing to growth-focused investors willing to accept premium multiples. The choice hinges on appetite for risk versus desire for steady shareholder returns.
Which one offers the Superior Shareholder Reward?
Johnson & Johnson (JNJ) delivers a more attractive shareholder reward than AstraZeneca (AZN) in 2026. JNJ offers a higher dividend yield near 3.4% with a payout ratio around 84%, well-covered by strong free cash flow. JNJ complements dividends with consistent buybacks supporting total returns. AZN pays a lower 2.3% yield, with a comparable payout ratio but weaker free cash flow coverage, signaling less distribution sustainability. AZN’s reinvestment leans heavily on growth and acquisitions, but buybacks are less intense. Historically in pharma, balanced dividends plus buybacks like JNJ’s align better with long-term value. I conclude JNJ’s distribution philosophy offers superior total return reliability and sustainability for investors in 2026.
Comparative Score Analysis: The Strategic Profile
The radar chart reveals the fundamental DNA and trade-offs of Johnson & Johnson and AstraZeneca PLC, highlighting their core financial strengths and weaknesses:
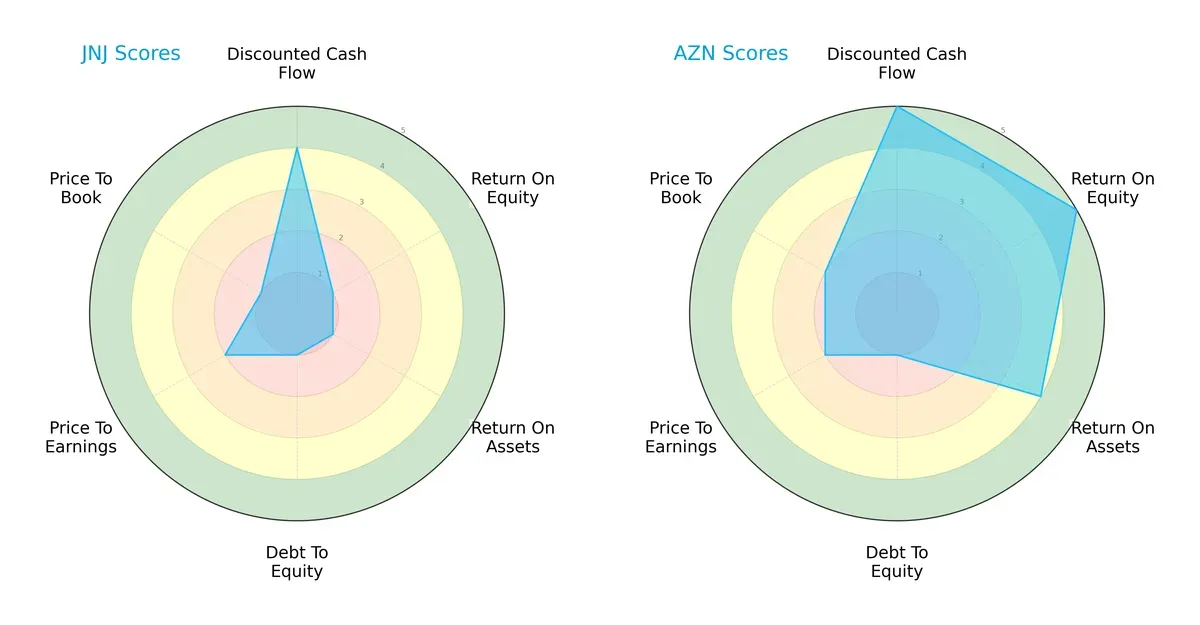
AstraZeneca excels in discounted cash flow, return on equity, and return on assets, showcasing operational efficiency and growth potential. Johnson & Johnson presents a more moderate DCF score but struggles with profitability and leverage metrics. AstraZeneca’s profile is more balanced, relying less on a single advantage, while Johnson & Johnson depends heavily on its valuation edge.
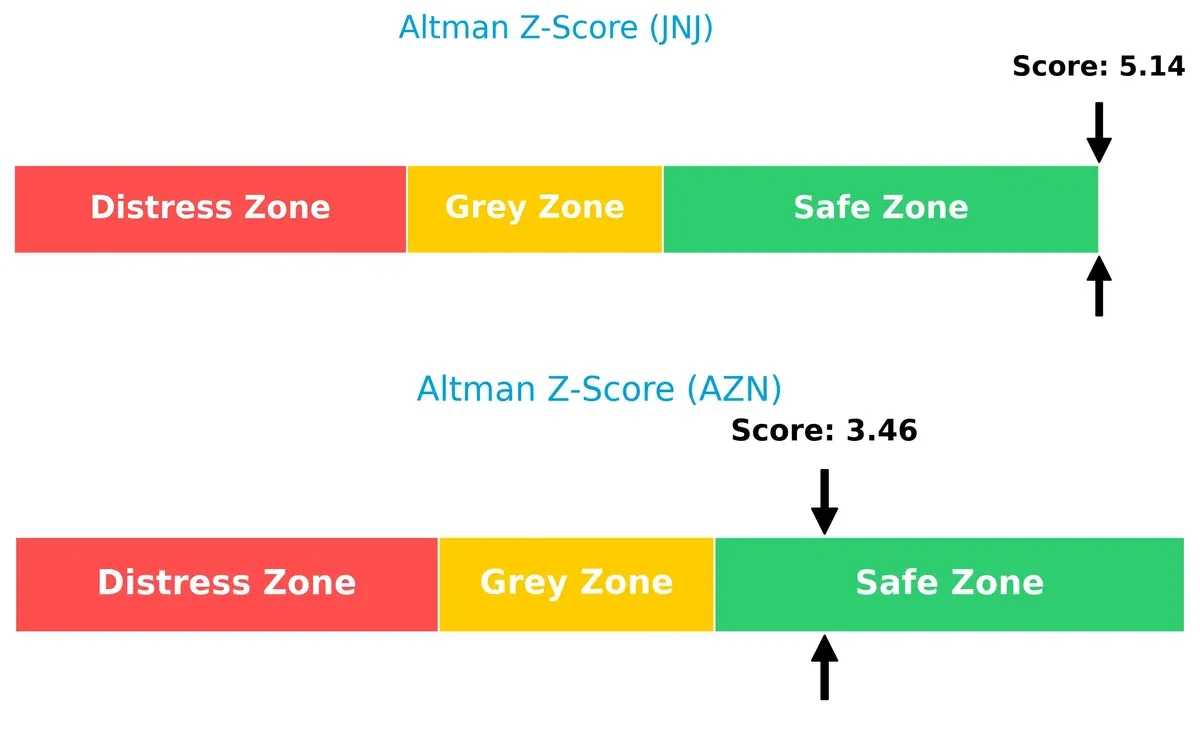
Bankruptcy Risk: Solvency Showdown
AstraZeneca’s Altman Z-Score of 3.46 versus Johnson & Johnson’s stronger 5.14 suggests both firms reside safely above distress thresholds. Johnson & Johnson’s superior score indicates a lower bankruptcy risk and greater resilience in this economic cycle:
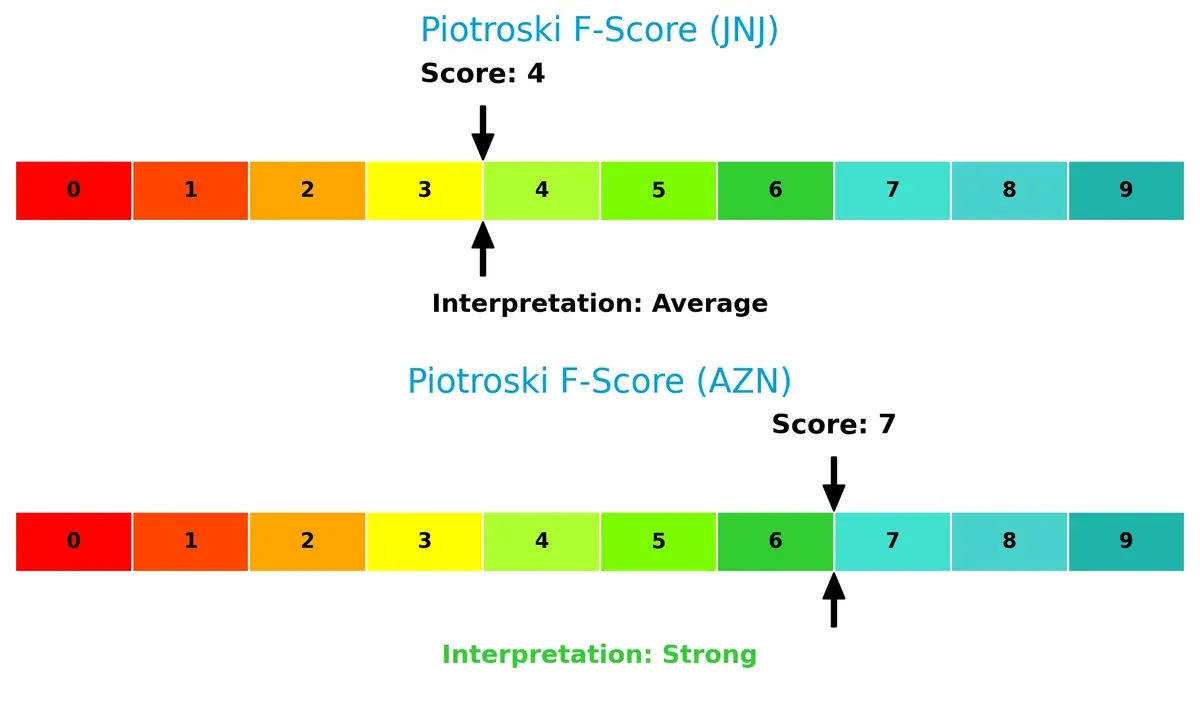
Financial Health: Quality of Operations
Johnson & Johnson’s Piotroski F-Score of 4 signals average financial health with possible internal red flags. In contrast, AstraZeneca’s stronger 7 score points to robust operational quality and fewer financial weaknesses:
How are the two companies positioned?
This section dissects the operational DNA of Johnson & Johnson and AstraZeneca by comparing their revenue distribution and internal dynamics. The goal is to confront their economic moats to reveal which model offers the most resilient competitive advantage today.
Revenue Segmentation: The Strategic Mix
This visual comparison dissects how Johnson & Johnson and AstraZeneca diversify their income streams and where their primary sector bets lie:
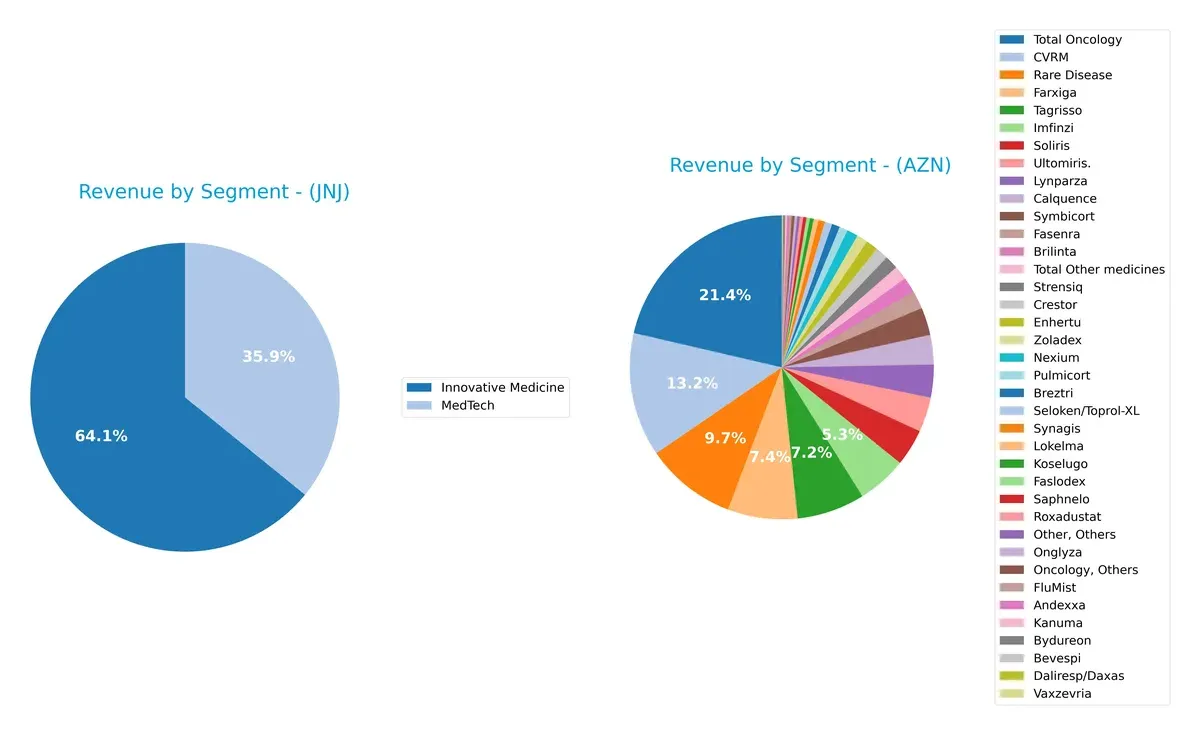
Johnson & Johnson anchors revenue in Innovative Medicine ($57B) and MedTech ($32B), showing a balanced diversification across healthcare sectors. AstraZeneca pivots heavily on Oncology ($17B) and Cardiovascular & Rare Disease segments, reflecting a focused pharmaceutical strategy. J&J’s mix reduces concentration risk, benefiting from ecosystem lock-in, while AZN’s reliance on drug innovation exposes it to patent cliffs but rewards with high-margin growth.
Strengths and Weaknesses Comparison
This table compares the strengths and weaknesses of Johnson & Johnson and AstraZeneca PLC:
Johnson & Johnson Strengths
- Diverse revenue streams across Innovative Medicine, MedTech, and Consumer segments
- Strong U.S. and European market presence
- Favorable net margin of 28.46%
- Low debt-to-equity and debt-to-assets ratios
- High interest coverage ratio
- Consistent dividend yield of 2.48%
AstraZeneca PLC Strengths
- Favorable ROE of 17.25% and ROIC of 10.3% above WACC
- Broad oncology and respiratory portfolio with high product revenue diversity
- Favorable debt-to-assets ratio with moderate leverage
- Solid interest coverage of 6.17x
- Favorable dividend yield of 2.28%
- Innovation evident in multiple high-value specialty drugs
Johnson & Johnson Weaknesses
- Unfavorable ROE and ROIC at 0%, indicating weak capital efficiency
- Unavailable WACC impairs cost of capital assessment
- Unfavorable liquidity ratios (current and quick ratios at 0) signal short-term risk
- Low asset and fixed asset turnover ratios suggest operational inefficiency
- Neutral PE ratio at 18.75 limits valuation upside
AstraZeneca PLC Weaknesses
- Unfavorable high PE (28.87) and PB (4.98) ratios imply rich valuation
- Current and quick ratios below 1 indicate liquidity concerns
- Moderate debt-to-equity ratio at 0.74 is neutral, not conservative
- Asset turnover is neutral at 0.52, showing moderate operational efficiency
Overall, Johnson & Johnson demonstrates strong diversification and financial stability but faces challenges in capital efficiency and liquidity. AstraZeneca exhibits solid profitability and innovation but contends with valuation and liquidity pressures. Both companies’ strategic focus must consider these financial strengths and weaknesses within their competitive environments.
The Moat Duel: Analyzing Competitive Defensibility
A structural moat is the only reliable barrier protecting long-term profits from relentless competition erosion. Let’s dissect the defenses of two pharma giants:
Johnson & Johnson: Diversified Innovation & MedTech Moat
JNJ’s moat stems from its diversified portfolio combining innovative medicines and advanced medical devices. This manifests in stable, high margins with 28% net margin and 35% EBIT margin in 2025. However, a declining ROIC trend signals rising capital inefficiencies, posing a risk to moat durability in 2026.
AstraZeneca PLC: Innovation-Driven Pipeline & Growing ROIC
AZN leverages a strong innovation pipeline in oncology and rare diseases, driving a very favorable moat with a 5.6% ROIC premium over WACC and consistent ROIC growth. Despite lower net margin (13%), its expanding revenues (+18% last year) suggest deepening competitive edge through new product launches and AI collaborations.
Innovation Consistency vs. Expanding Efficiency
I see AstraZeneca’s growing ROIC and focused innovation pipeline as a deeper moat compared to Johnson & Johnson’s broader but weakening capital efficiency. AZN is better positioned to defend and expand market share amid evolving healthcare demands.
Which stock offers better returns?
Over the past year, both Johnson & Johnson and AstraZeneca PLC showed strong price gains with accelerating bullish trends, marked by significant highs and distinct trading volume dynamics.
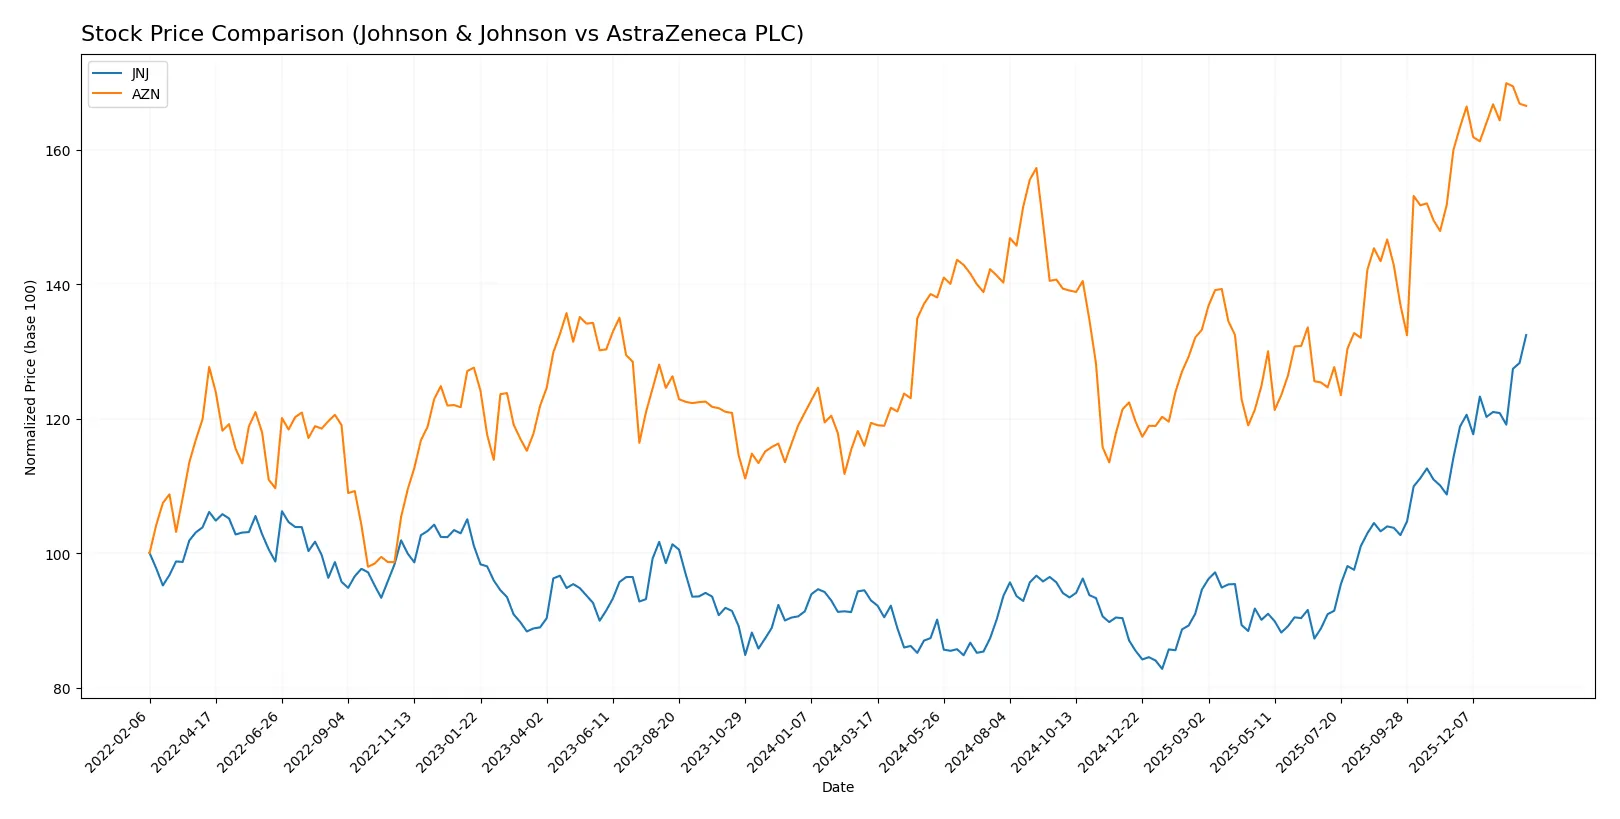
Trend Comparison
Johnson & Johnson’s stock rose 42.46% over the last 12 months, showing a bullish trend with acceleration and high volatility (19.93 std dev). It reached a peak of 227.25 and a low of 142.06.
AstraZeneca’s stock gained 39.5% in the same period, also bullish with acceleration but lower volatility (8.07 std dev). Its highest price was 94.65, lowest 63.23, reflecting steadier movement.
Comparing recent trends, JNJ’s 15.99% gain outpaced AZN’s 4.12%. JNJ also exhibited stronger buyer dominance and increasing volume, delivering superior market performance.
Target Prices
Analysts present a cautiously optimistic consensus on Johnson & Johnson and AstraZeneca PLC.
| Company | Target Low | Target High | Consensus |
|---|---|---|---|
| Johnson & Johnson | 190 | 265 | 228.33 |
| AstraZeneca PLC | 103 | 108 | 105.5 |
Johnson & Johnson’s target consensus of 228.33 slightly exceeds its current price of 227.25, indicating moderate upside potential. AstraZeneca’s consensus target of 105.5 is notably above its current 92.77 price, signaling stronger analyst confidence in future gains.

Don’t Let Luck Decide Your Entry Point
Optimize your entry points with our advanced ProRealTime indicators. You’ll get efficient buy signals with precise price targets for maximum performance. Start outperforming now!
How do institutions grade them?
Johnson & Johnson Grades
Here are recent institutional grades for Johnson & Johnson from leading financial firms:
| Grading Company | Action | New Grade | Date |
|---|---|---|---|
| Morgan Stanley | Upgrade | Overweight | 2026-01-28 |
| Freedom Capital Markets | Maintain | Hold | 2026-01-27 |
| Guggenheim | Maintain | Buy | 2026-01-23 |
| Stifel | Maintain | Hold | 2026-01-22 |
| B of A Securities | Maintain | Neutral | 2026-01-22 |
| Scotiabank | Maintain | Sector Outperform | 2026-01-22 |
| TD Cowen | Maintain | Buy | 2026-01-22 |
| Citigroup | Maintain | Buy | 2026-01-22 |
| Wells Fargo | Maintain | Overweight | 2026-01-22 |
| Morgan Stanley | Maintain | Equal Weight | 2026-01-22 |
AstraZeneca PLC Grades
Below are institutional grades for AstraZeneca PLC from recognized rating firms:
| Grading Company | Action | New Grade | Date |
|---|---|---|---|
| UBS | Upgrade | Buy | 2025-02-13 |
| UBS | Upgrade | Neutral | 2024-11-20 |
| Erste Group | Upgrade | Buy | 2024-09-11 |
| TD Cowen | Maintain | Buy | 2024-08-12 |
| Argus Research | Maintain | Buy | 2024-05-30 |
| BMO Capital | Maintain | Outperform | 2024-04-26 |
| Deutsche Bank | Upgrade | Hold | 2024-04-16 |
| BMO Capital | Maintain | Outperform | 2024-02-12 |
| Deutsche Bank | Downgrade | Hold | 2024-02-08 |
| Jefferies | Downgrade | Hold | 2024-01-03 |
Which company has the best grades?
Johnson & Johnson consistently receives “Buy,” “Overweight,” and “Sector Outperform” ratings from top-tier firms in 2026. AstraZeneca’s grades mainly date back to 2024–2025 and range from “Hold” to “Buy” with some downgrades. Investors may view Johnson & Johnson as currently favored by analysts, potentially reflecting stronger near-term confidence.
Risks specific to each company
The following categories pinpoint the critical pressure points and systemic threats facing Johnson & Johnson and AstraZeneca in the 2026 market environment:
1. Market & Competition
Johnson & Johnson
- Faces intense competition in pharmaceuticals and medical devices; innovation pace critical to maintain leadership.
AstraZeneca PLC
- Operates in a highly competitive biopharma sector with strong oncology focus; pipeline success essential for growth.
2. Capital Structure & Debt
Johnson & Johnson
- Exhibits a very favorable debt profile with strong interest coverage and low leverage.
AstraZeneca PLC
- Maintains moderate leverage with good interest coverage, but debt-to-equity ratio warrants caution.
3. Stock Volatility
Johnson & Johnson
- Low beta (0.33) indicates defensive stock with limited price swings.
AstraZeneca PLC
- Even lower beta (0.19) reflects exceptionally low volatility, appealing to risk-averse investors.
4. Regulatory & Legal
Johnson & Johnson
- Legacy litigation and regulatory scrutiny remain persistent risks in product liability and compliance.
AstraZeneca PLC
- Faces regulatory hurdles globally, especially in oncology approvals and patent cliffs.
5. Supply Chain & Operations
Johnson & Johnson
- Global operations benefit from scale but face risks from supply disruptions and operational complexity.
AstraZeneca PLC
- Supply chain risks elevated due to global reliance and complex biopharma manufacturing processes.
6. ESG & Climate Transition
Johnson & Johnson
- Committed to ESG targets but must enhance climate risk disclosures and sustainable innovation.
AstraZeneca PLC
- Proactive ESG integration with strong climate initiatives, positioning well for transition risks.
7. Geopolitical Exposure
Johnson & Johnson
- US-centric but global footprint exposes it to trade tensions and regulatory variability.
AstraZeneca PLC
- UK-based with broader exposure to Europe and emerging markets, facing Brexit and geopolitical uncertainties.
Which company shows a better risk-adjusted profile?
AstraZeneca’s most impactful risk lies in its capital structure, with a debt-to-equity ratio that signals moderate financial leverage risk. Johnson & Johnson’s primary risk resides in regulatory and legacy litigation pressures, which could impair earnings. Despite AstraZeneca’s leverage concerns, its strong profitability metrics and higher Piotroski score reflect superior operational efficiency. Johnson & Johnson’s ultra-low volatility and debt strength provide defensive qualities, but its unfavorable returns on equity and assets temper enthusiasm. Recent data shows AstraZeneca’s Altman Z-score and strong Piotroski score better position it for financial resilience, giving it a slight edge in risk-adjusted terms.
Final Verdict: Which stock to choose?
Johnson & Johnson’s superpower lies in its robust margin expansion and consistent cash generation, making it a reliable cash machine in healthcare. A point of vigilance remains its declining ROIC trend, which could pressure future value creation. It suits portfolios seeking steady income with moderate growth — a classic Defensive Growth pick.
AstraZeneca’s strategic moat is its growing ROIC that comfortably exceeds its cost of capital, reflecting efficient capital allocation and innovation-driven growth. Its higher leverage and valuation require caution but offer a favorable return profile compared to Johnson & Johnson. AstraZeneca appeals to investors targeting GARP strategies with a tolerance for moderate risk.
If you prioritize dependable cash flow and margin resilience, Johnson & Johnson is the compelling choice due to its stable income and defensive qualities. However, if you seek growth fueled by capital efficiency and innovation, AstraZeneca offers better value creation despite higher leverage and valuation premiums. Each fits distinct investor profiles with different risk appetites.
Disclaimer: Investment carries a risk of loss of initial capital. The past performance is not a reliable indicator of future results. Be sure to understand risks before making an investment decision.
Go Further
I encourage you to read the complete analyses of Johnson & Johnson and AstraZeneca PLC to enhance your investment decisions: