AstraZeneca PLC and Gilead Sciences, Inc. are two prominent biopharmaceutical companies competing in the drug manufacturing industry. Both focus on innovative therapies addressing critical medical needs, including oncology, infectious diseases, and rare conditions, with global market reach and strong pipelines. Their overlapping sectors and commitment to cutting-edge research make them natural comparators. In this article, I will help you identify which company holds the most potential for your investment portfolio.

Table of contents
Companies Overview
I will begin the comparison between AstraZeneca and Gilead Sciences by providing an overview of these two companies and their main differences.
AstraZeneca Overview
AstraZeneca PLC is a global biopharmaceutical company focused on discovering, developing, manufacturing, and commercializing prescription medicines. Its portfolio covers cardiovascular, renal, metabolism, oncology, rare diseases, and COVID-19 treatments. Headquartered in Cambridge, UK, AstraZeneca serves physicians worldwide through distributors and local offices, emphasizing innovation through collaborations in AI-powered drug discovery and pathology.
Gilead Sciences Overview
Gilead Sciences, Inc. is a biopharmaceutical company discovering, developing, and commercializing medicines targeting unmet medical needs. Its key products address HIV/AIDS, liver diseases, oncology, cell therapy, pulmonary arterial hypertension, chronic angina, and fungal infections. Based in Foster City, California, Gilead operates globally and maintains multiple collaboration agreements with biotech firms and pharmaceutical giants to enhance its therapeutic pipeline.
Key similarities and differences
Both AstraZeneca and Gilead operate in the drug manufacturing industry with a strong focus on innovative therapies for serious diseases. AstraZeneca has a broader therapeutic portfolio including cardiovascular and rare diseases, while Gilead specializes more in infectious diseases, oncology, and cell therapy. AstraZeneca employs significantly more staff and is UK-based, whereas Gilead is US-based with fewer employees but strong collaborations in immunotherapy and antiviral treatments.
Income Statement Comparison
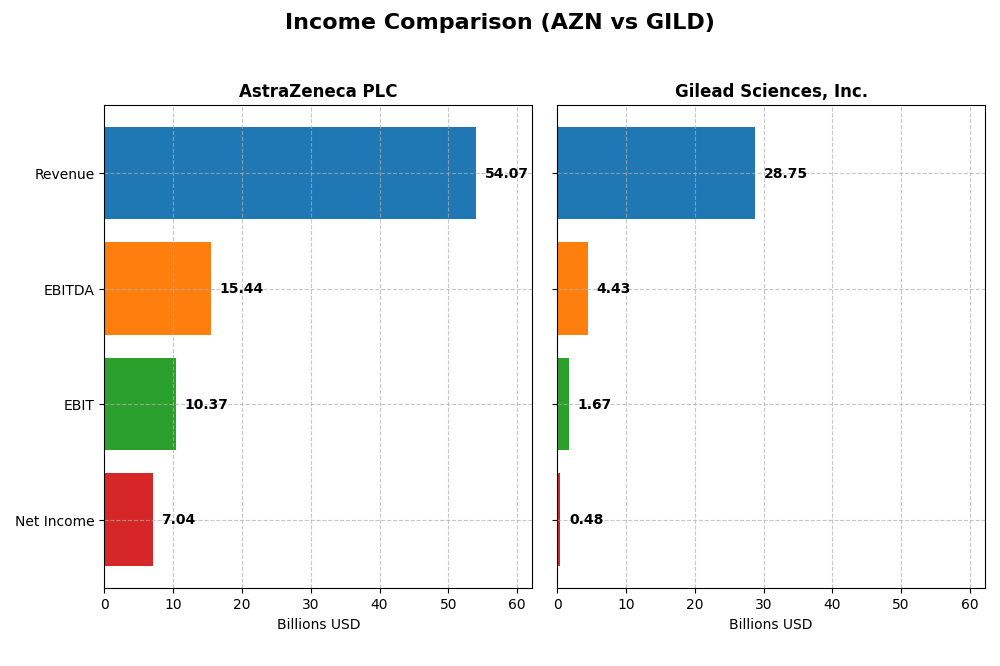
The table below compares key income statement metrics for AstraZeneca PLC and Gilead Sciences, Inc. based on their most recent fiscal year data.
| Metric | AstraZeneca PLC | Gilead Sciences, Inc. |
|---|---|---|
| Market Cap | 293B | 150B |
| Revenue | 54.07B | 28.75B |
| EBITDA | 15.44B | 4.43B |
| EBIT | 10.37B | 1.67B |
| Net Income | 7.04B | 480M |
| EPS | 1.14 | 0.38 |
| Fiscal Year | 2024 | 2024 |
Income Statement Interpretations
AstraZeneca PLC
AstraZeneca showed strong revenue growth over 2020-2024, doubling from $26.6B to $54.1B, with net income increasing over 120% to $7.0B in 2024. Margins remained favorable, with a gross margin above 81% and an EBIT margin near 19%. In 2024, revenue growth accelerated by 18%, EBIT grew 22%, while net margin was stable, though EPS declined slightly.
Gilead Sciences, Inc.
Gilead’s revenue grew moderately by 16.5% from $24.7B in 2020 to $28.8B in 2024, with net income surging nearly 290% to $480M in 2024. Gross margin held strong at 78%, but EBIT margin dropped significantly to 5.8% in 2024, reflecting a sharp 79% EBIT decline. Net margin and EPS also fell notably in the latest year despite longer-term improvements.
Which one has the stronger fundamentals?
AstraZeneca demonstrates stronger fundamentals with consistent high margins, robust revenue and net income growth, and a favorable EBIT margin. Gilead shows more volatility, with recent declines in profitability metrics despite strong long-term net income growth. AstraZeneca’s stable margin profile and accelerating recent growth contrast with Gilead’s margin compression and one-year profitability challenges.
Financial Ratios Comparison
Below is a comparison of key financial ratios for AstraZeneca PLC and Gilead Sciences, Inc. based on their most recent fiscal year data (2024).
| Ratios | AstraZeneca PLC (AZN) | Gilead Sciences, Inc. (GILD) |
|---|---|---|
| ROE | 17.2% | 2.5% |
| ROIC | 10.3% | 2.4% |
| P/E | 28.9 | 240.0 |
| P/B | 5.0 | 6.0 |
| Current Ratio | 0.93 | 1.60 |
| Quick Ratio | 0.74 | 1.45 |
| D/E (Debt-to-Equity) | 0.74 | 1.38 |
| Debt-to-Assets | 28.9% | 45.3% |
| Interest Coverage | 5.9 | 1.7 |
| Asset Turnover | 0.52 | 0.49 |
| Fixed Asset Turnover | 4.64 | 5.31 |
| Payout Ratio | 65.8% | 8.16% |
| Dividend Yield | 2.28% | 3.40% |
Interpretation of the Ratios
AstraZeneca PLC
AstraZeneca shows strong profitability with a favorable net margin of 13.01%, ROE at 17.25%, and ROIC of 10.3%, supported by a low WACC of 4.66%. However, valuation ratios like PE at 28.87 and PB at 4.98 are unfavorable, and liquidity ratios indicate potential short-term stress with current and quick ratios below 1. The company pays dividends with a 2.28% yield, suggesting stable shareholder returns without apparent payout risks.
Gilead Sciences, Inc.
Gilead’s ratios reflect weaker profitability, with net margin at 1.67%, ROE at 2.48%, and ROIC at 2.36%, all flagged as unfavorable. Its valuation metrics are stretched, notably a PE of 239.97 and PB of 5.96, while liquidity ratios are healthy, with current and quick ratios above 1. The dividend yield is 3.4%, supported by a less robust interest coverage ratio, indicating some risk in financial leverage management.
Which one has the best ratios?
AstraZeneca presents a more favorable overall ratio profile, with stronger profitability, better leverage management, and a balanced dividend yield. Gilead’s higher valuation multiples and weaker profitability ratios weigh against it despite better liquidity. Hence, AstraZeneca’s ratios appear more robust in comparison, reflecting a healthier financial position.
Strategic Positioning
This section compares the strategic positioning of AstraZeneca (AZN) and Gilead Sciences (GILD) focusing on Market position, Key segments, and Exposure to technological disruption:
AstraZeneca PLC
- Large market cap ($293B), low beta (0.19), diversified competition across global healthcare markets.
- Key segments include oncology ($17B), cardiovascular/renal/metabolism ($10.6B), rare diseases ($7.8B), respiratory, and immunology.
- Collaborations leverage AI and biotechnology for drug discovery, indicating proactive adaptation to technological disruption.
Gilead Sciences, Inc.
- Mid-sized market cap ($150B), moderate beta (0.35), operates mainly in antiviral and specialty biopharma markets.
- Key segments focus on HIV/AIDS (~$18B), cell therapy (~$2.4B), COVID-19 treatments, liver diseases, and hematology/oncology products.
- Engages in multiple collaborations in immunotherapy and antiviral innovation, but current moat evaluation shows value destruction despite growing ROIC.
AZN vs GILD Positioning
AZN adopts a diversified portfolio across oncology, cardiovascular, respiratory, and rare diseases, providing broad revenue streams. GILD concentrates on antiviral and cell therapy products, with a narrower focus but strong presence in HIV/AIDS and emerging therapies. Diversification offers AZN risk spreading; GILD’s focus may limit exposure but face concentrated risks.
Which has the best competitive advantage?
AZN demonstrates a very favorable moat with ROIC exceeding WACC by 5.64% and growing profitability, indicating durable competitive advantage. GILD shows a slightly unfavorable moat with ROIC below WACC by 2.58%, despite improving ROIC trends, suggesting weaker competitive positioning.
Stock Comparison
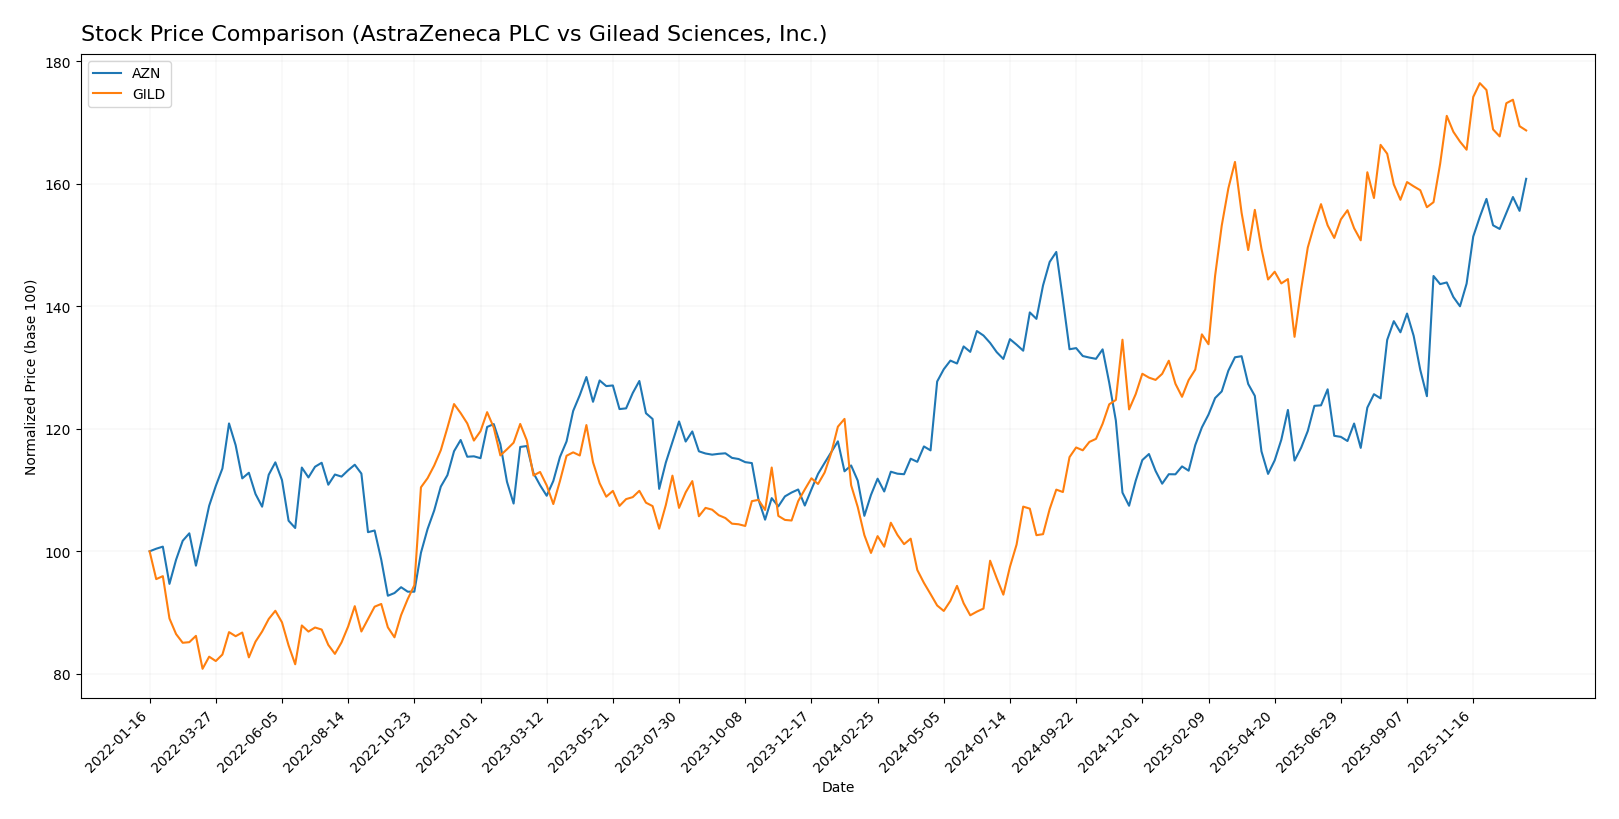
The past year has seen significant bullish momentum for both AstraZeneca PLC and Gilead Sciences, Inc., with AstraZeneca showing accelerating gains and Gilead experiencing deceleration despite a higher overall price increase.
Trend Analysis
AstraZeneca PLC’s stock rose 47.27% over the past 12 months, indicating a bullish trend with accelerating momentum and a standard deviation of 7.74. The price ranged between 63.23 and 94.65 during this period. Gilead Sciences, Inc. recorded a 69.18% price increase over the same 12 months, also bullish but with deceleration. Its volatility was higher, with a 19.55 standard deviation, and prices ranged from 64.27 to 126.64. Comparing both, Gilead’s stock delivered higher overall market performance despite slowing momentum, while AstraZeneca showed steadier acceleration in its upward trend.
Target Prices
The current analyst consensus indicates optimistic target prices for both AstraZeneca PLC and Gilead Sciences, Inc.
| Company | Target High | Target Low | Consensus |
|---|---|---|---|
| AstraZeneca PLC | 108 | 103 | 105.5 |
| Gilead Sciences, Inc. | 151 | 105 | 133.64 |
Analysts expect AstraZeneca’s price to rise moderately above the current 94.65 USD, while Gilead shows a stronger upside potential relative to its current price of 121.1 USD. This suggests favorable market sentiment with room for growth in both stocks.
Analyst Opinions Comparison
This section compares analysts’ ratings and grades for AstraZeneca PLC and Gilead Sciences, Inc.:
Rating Comparison
AstraZeneca PLC Rating
- Rating: B+, evaluated as Very Favorable by analysts.
- Discounted Cash Flow Score: 4, indicating a Favorable DCF valuation.
- ROE Score: 5, reflecting Very Favorable efficiency in generating profit from equity.
- ROA Score: 4, showing Favorable asset utilization to generate earnings.
- Debt To Equity Score: 1, denoting a Very Unfavorable financial risk due to high leverage.
- Overall Score: 3, categorized as Moderate overall financial standing.
Gilead Sciences, Inc. Rating
- Rating: A-, evaluated as Very Favorable by analysts.
- Discounted Cash Flow Score: 5, indicating a Very Favorable DCF valuation.
- ROE Score: 5, reflecting Very Favorable efficiency in generating profit from equity.
- ROA Score: 5, showing Very Favorable asset utilization to generate earnings.
- Debt To Equity Score: 1, denoting a Very Unfavorable financial risk due to high leverage.
- Overall Score: 4, categorized as Favorable overall financial standing.
Which one is the best rated?
Based strictly on the provided data, Gilead Sciences holds a superior overall rating (A-) and higher scores in discounted cash flow, ROA, and overall financial standing compared to AstraZeneca’s B+ rating and moderate overall score.
Scores Comparison
The comparison of scores between AstraZeneca PLC and Gilead Sciences, Inc. is as follows:
AstraZeneca PLC Scores
- Altman Z-Score: 3.51, indicating a safe zone for bankruptcy risk.
- Piotroski Score: 7, reflecting a strong financial health status.
Gilead Sciences, Inc. Scores
- Altman Z-Score: 4.01, indicating a safe zone for bankruptcy risk.
- Piotroski Score: 8, reflecting a very strong financial health status.
Which company has the best scores?
Gilead Sciences shows higher scores with an Altman Z-Score of 4.01 and a Piotroski Score of 8, compared to AstraZeneca’s 3.51 and 7 respectively. This suggests Gilead has a stronger financial position based on these metrics.
Grades Comparison
I compare the recent grades assigned by established financial institutions for AstraZeneca PLC and Gilead Sciences, Inc.:
AstraZeneca PLC Grades
The table below summarizes recent grades from notable grading companies for AstraZeneca PLC.
| Grading Company | Action | New Grade | Date |
|---|---|---|---|
| UBS | Buy | Buy | 2025-02-13 |
| UBS | Upgrade | Neutral | 2024-11-20 |
| Erste Group | Upgrade | Buy | 2024-09-11 |
| TD Cowen | Maintain | Buy | 2024-08-12 |
| Argus Research | Maintain | Buy | 2024-05-30 |
| BMO Capital | Maintain | Outperform | 2024-04-26 |
| Deutsche Bank | Upgrade | Hold | 2024-04-16 |
| BMO Capital | Maintain | Outperform | 2024-02-12 |
| Deutsche Bank | Downgrade | Hold | 2024-02-08 |
| Jefferies | Downgrade | Hold | 2024-01-03 |
AstraZeneca’s grades show a general upgrade trend with multiple firms moving from Hold or Sell to Buy and Outperform ratings.
Gilead Sciences, Inc. Grades
The table below presents recent grades from reputable grading companies for Gilead Sciences, Inc.
| Grading Company | Action | New Grade | Date |
|---|---|---|---|
| Citigroup | Maintain | Buy | 2026-01-07 |
| Morgan Stanley | Maintain | Overweight | 2025-12-12 |
| Wells Fargo | Maintain | Overweight | 2025-12-10 |
| Needham | Maintain | Buy | 2025-11-13 |
| Truist Securities | Maintain | Buy | 2025-11-03 |
| Cantor Fitzgerald | Maintain | Overweight | 2025-10-31 |
| Needham | Maintain | Buy | 2025-10-31 |
| RBC Capital | Maintain | Sector Perform | 2025-10-31 |
| JP Morgan | Maintain | Overweight | 2025-10-31 |
| Wells Fargo | Maintain | Overweight | 2025-10-31 |
Gilead’s grades are stable, with consistent Buy and Overweight ratings, showing confidence from analysts without recent upgrades or downgrades.
Which company has the best grades?
Both AstraZeneca and Gilead hold a consensus “Buy” rating; however, AstraZeneca’s grades reflect recent upgrades and positive momentum, while Gilead’s ratings remain steady. This difference may influence investors seeking growth signals versus stability.
Strengths and Weaknesses
Below is a comparative overview of AstraZeneca PLC (AZN) and Gilead Sciences, Inc. (GILD) highlighting key strengths and weaknesses based on recent financial and operational data.
| Criterion | AstraZeneca PLC (AZN) | Gilead Sciences, Inc. (GILD) |
|---|---|---|
| Diversification | Broad portfolio across oncology, cardiovascular, respiratory, and rare diseases; multiple high-revenue drugs | Focused primarily on antiviral therapies and cell therapy products; less diversified product range |
| Profitability | High profitability with favorable net margin (13.01%) and ROIC (10.3%); creating value with growing ROIC | Low profitability with unfavorable net margin (1.67%) and ROIC (2.36%); currently shedding value despite growth |
| Innovation | Strong innovation evidenced by growing ROIC and leading oncology pipeline (e.g., Tagrisso $5.8B revenue) | Innovation improving with growing ROIC but profitability remains weak; increasing cell therapy sales ($2.4B) |
| Global presence | Extensive global footprint with blockbuster drugs across multiple regions | Global presence focused on antiviral market; notable HIV product sales exceeding $19B |
| Market Share | Leading positions in oncology and cardiovascular/metabolic diseases markets | Strong market share in antiviral therapies, especially HIV treatments |
Key takeaways: AstraZeneca demonstrates a durable competitive advantage with diversified revenue streams and strong profitability growth, making it a more favorable investment. Gilead shows improving innovation and revenue growth but faces challenges in profitability and product diversification, suggesting higher risk.
Risk Analysis
Below is a comparative table of key risk factors for AstraZeneca PLC (AZN) and Gilead Sciences, Inc. (GILD) based on the most recent data from 2024.
| Metric | AstraZeneca PLC (AZN) | Gilead Sciences, Inc. (GILD) |
|---|---|---|
| Market Risk | Low beta (0.19) indicates low volatility relative to the market | Moderate beta (0.35), somewhat higher market sensitivity |
| Debt Level | Moderate debt-to-equity (0.74), debt-to-assets 29% – manageable | Higher debt-to-equity (1.38), debt-to-assets 45% – elevated leverage |
| Regulatory Risk | High – operates globally with exposure to diverse regulatory environments | High – US-centric with significant FDA scrutiny |
| Operational Risk | Moderate – large workforce (94,300) and complex drug portfolio | Moderate – smaller workforce (17,600) but with complex drug pipeline |
| Environmental Risk | Moderate – pharmaceutical manufacturing impact and sustainability initiatives underway | Moderate – similar sector-specific environmental concerns |
| Geopolitical Risk | Medium – UK base with global operations, including emerging markets | Medium – US base, with international markets exposure |
The most impactful and likely risks are regulatory and debt-related. AstraZeneca’s low market volatility and favorable financial health reduce market risk, while Gilead’s higher leverage and weaker profitability metrics increase financial vulnerability. Both face significant regulatory scrutiny typical for pharma, which can affect drug approvals and sales. Investors should monitor debt levels closely, especially for Gilead, and remain vigilant about regulatory changes impacting the biotech sector.
Which Stock to Choose?
AstraZeneca PLC shows a favorable income evolution with strong revenue and net income growth over 2020-2024, supported by solid profitability ratios including a 17.25% ROE and 13.01% net margin. Its debt levels are moderate, with a net debt to EBITDA of 1.6, and it holds a very favorable overall rating of B+.
Gilead Sciences, Inc. presents a mixed income profile with moderate revenue growth but volatile earnings and net margin declines in the short term. Financial ratios reveal weaker profitability, including a 2.48% ROE and 1.67% net margin, alongside higher leverage with net debt to EBITDA near 3.8. Its overall rating is very favorable at A-, reflecting strengths but also some financial concerns.
Considering ratings and financial evaluations, AstraZeneca’s very favorable moat and consistent profitability might appeal to investors seeking quality and durable competitive advantage, while Gilead’s improving profitability amid value destruction could be more aligned with risk-tolerant or growth-focused profiles. Each stock could therefore appear more suitable depending on an investor’s risk appetite and investment strategy.
Disclaimer: Investment carries a risk of loss of initial capital. The past performance is not a reliable indicator of future results. Be sure to understand risks before making an investment decision.
Go Further
I encourage you to read the complete analyses of AstraZeneca PLC and Gilead Sciences, Inc. to enhance your investment decisions: