Eli Lilly and Company (LLY) and AstraZeneca PLC (AZN) are two giants in the pharmaceutical industry, each driving innovation in drug development and healthcare solutions. Both companies overlap in therapeutic areas like oncology and diabetes, leveraging cutting-edge research and strategic collaborations. This comparison will explore their market positions and growth potential to help you decide which stock might be the smarter addition to your investment portfolio.

Table of contents
Companies Overview
I will begin the comparison between Eli Lilly and Company and AstraZeneca PLC by providing an overview of these two companies and their main differences.
Eli Lilly and Company Overview
Eli Lilly and Company, headquartered in Indianapolis, Indiana, is a global pharmaceutical firm focused on discovering, developing, and marketing human pharmaceuticals. Founded in 1876, it offers a broad portfolio including treatments for diabetes, cancer, autoimmune diseases, and mental health. With a market capitalization of approximately 955B USD and 47K employees, Eli Lilly is a leading player in the drug manufacturing industry.
AstraZeneca PLC Overview
AstraZeneca PLC is a biopharmaceutical company based in Cambridge, UK, specializing in prescription medicines across cardiovascular, renal, metabolism, oncology, and rare diseases. Incorporated in 1992, AstraZeneca’s portfolio includes key products for COVID-19 and other conditions. It employs about 94K people and has a market cap near 293B USD, serving global markets through distributors and local offices.
Key similarities and differences
Both companies operate in the drug manufacturing industry, focusing on innovative pharmaceuticals with global reach. Eli Lilly emphasizes treatments for diabetes and cancer, while AstraZeneca has a broader therapeutic range including cardiovascular and rare diseases. AstraZeneca has a larger workforce and is listed on NASDAQ as an ADR, whereas Eli Lilly trades on the NYSE with a higher market capitalization. Their collaboration strategies also differ, reflecting diverse approaches to drug discovery and commercialization.
Income Statement Comparison
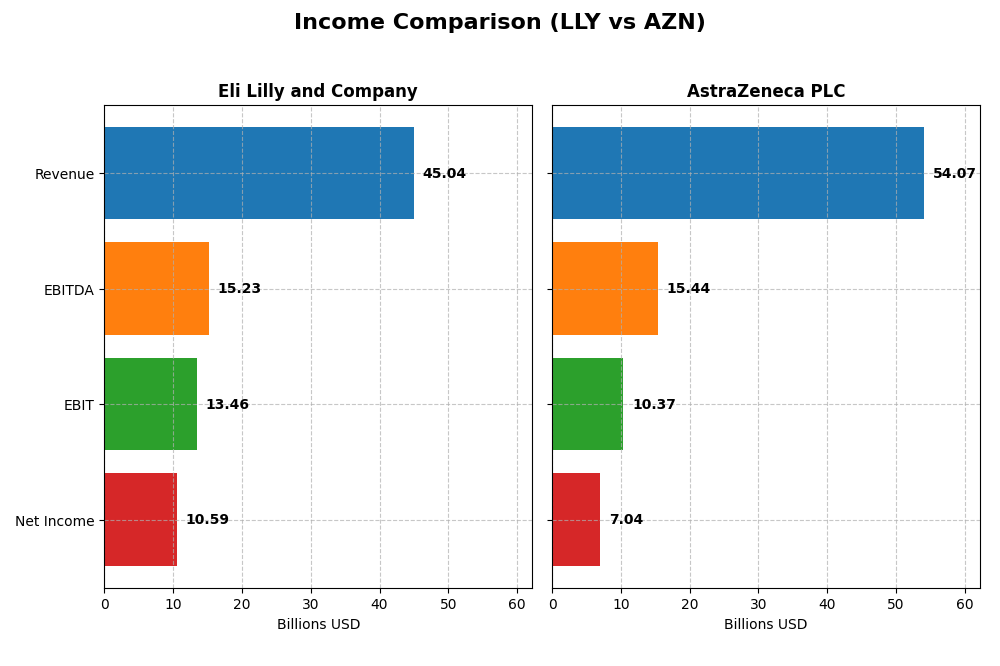
This table presents a side-by-side comparison of key income statement metrics for Eli Lilly and Company and AstraZeneca PLC for the fiscal year 2024.
| Metric | Eli Lilly and Company (LLY) | AstraZeneca PLC (AZN) |
|---|---|---|
| Market Cap | 955B | 293B |
| Revenue | 45.0B | 54.1B |
| EBITDA | 15.2B | 15.4B |
| EBIT | 13.5B | 10.4B |
| Net Income | 10.6B | 7.0B |
| EPS | 11.76 | 1.14 |
| Fiscal Year | 2024 | 2024 |
Income Statement Interpretations
Eli Lilly and Company
Eli Lilly showed strong revenue growth from 2020 to 2024, increasing from $24.5B to $45B, with net income nearly doubling from $6.2B to $10.6B. Margins remained robust, with a gross margin above 81% and net margin around 23.5%. In 2024, revenue growth accelerated by 32%, and net income surged by 53%, although net margin slightly declined overall.
AstraZeneca PLC
AstraZeneca’s revenue rose consistently from $26.6B in 2020 to $54.1B in 2024, with net income growing more than twofold to $7B. Margins improved moderately, with a gross margin near 81% and net margin at 13%. The latest year showed solid revenue growth of 18%, stable net margin, but a notable decline in EPS by over 40%, indicating mixed earnings quality.
Which one has the stronger fundamentals?
Eli Lilly demonstrates stronger fundamentals with higher margins, more favorable net margin trends, and significant recent earnings growth, supported by a 92.9% favorable income statement score. AstraZeneca’s fundamentals are solid but tempered by lower margins, EPS decline, and a 78.6% favorable rating, reflecting some earnings volatility despite robust top-line expansion.
Financial Ratios Comparison
The table below presents a side-by-side comparison of key financial ratios for Eli Lilly and Company (LLY) and AstraZeneca PLC (AZN) based on their most recent fiscal year data from 2024.
| Ratios | Eli Lilly and Company (LLY) | AstraZeneca PLC (AZN) |
|---|---|---|
| ROE | 74.62% | 17.25% |
| ROIC | 26.36% | 10.30% |
| P/E | 65.65 | 28.87 |
| P/B | 48.99 | 4.98 |
| Current Ratio | 1.15 | 0.93 |
| Quick Ratio | 0.89 | 0.74 |
| D/E (Debt to Equity) | 2.37 | 0.74 |
| Debt-to-Assets | 42.74% | 28.95% |
| Interest Coverage | 22.42 | 5.95 |
| Asset Turnover | 0.57 | 0.52 |
| Fixed Asset Turnover | 2.63 | 4.64 |
| Payout Ratio | 44.20% | 65.80% |
| Dividend Yield | 0.67% | 2.28% |
Interpretation of the Ratios
Eli Lilly and Company
Eli Lilly shows strong profitability ratios with a net margin of 23.51% and an impressive return on equity of 74.62%, indicating effective capital management. However, valuation multiples like P/E at 65.65 and P/B at 48.99 appear stretched, while debt-to-equity at 2.37 raises concerns about leverage. The dividend yield is modest at 0.67%, reflecting cautious shareholder returns.
AstraZeneca PLC
AstraZeneca presents favorable ratios with a net margin of 13.01% and a return on equity of 17.25%, demonstrating solid but more moderate profitability than Lilly. Its capital structure is less leveraged with a debt-to-equity of 0.74, supporting financial stability. The company offers a higher dividend yield of 2.28%, indicating stronger income distribution to shareholders.
Which one has the best ratios?
AstraZeneca’s ratios are generally more balanced, with a higher proportion of favorable metrics including profitability, leverage, and dividend yield. Eli Lilly excels in profitability but shows weaker valuation and leverage ratios. Overall, AstraZeneca’s financial profile appears more favorable considering risk and return metrics in 2024.
Strategic Positioning
This section compares the strategic positioning of Eli Lilly and Company (LLY) and AstraZeneca PLC (AZN), focusing on Market position, Key segments, and Exposure to technological disruption:
Eli Lilly and Company
- Leading global pharmaceutical with strong market cap of $955B and moderate beta 0.35.
- Focuses on human pharmaceuticals, diabetes, oncology, immunology, and collaboration revenues.
- Collaborates with biotech firms and AI companies, embracing drug discovery innovation but no direct disruption stated.
AstraZeneca PLC
- Large biopharma with $293B market cap and low beta 0.19, facing competitive pressures globally.
- Diversified in oncology, cardiovascular, respiratory, rare diseases, and extensive prescription medicines.
- Engages in AI-driven drug discovery and digital pathology, indicating proactive technological adaptation.
Eli Lilly and Company vs AstraZeneca PLC Positioning
LLY’s focus is concentrated on human pharmaceuticals and diabetes with strong collaborations, while AZN pursues a more diversified portfolio including rare diseases and respiratory. LLY’s greater market cap contrasts with AZN’s broader segment spread, reflecting varied strategic scopes.
Which has the best competitive advantage?
Both companies demonstrate a very favorable moat with growing ROIC trends and value creation. LLY shows a higher ROIC spread over WACC and faster growth, indicating a potentially stronger competitive advantage based on capital efficiency.
Stock Comparison
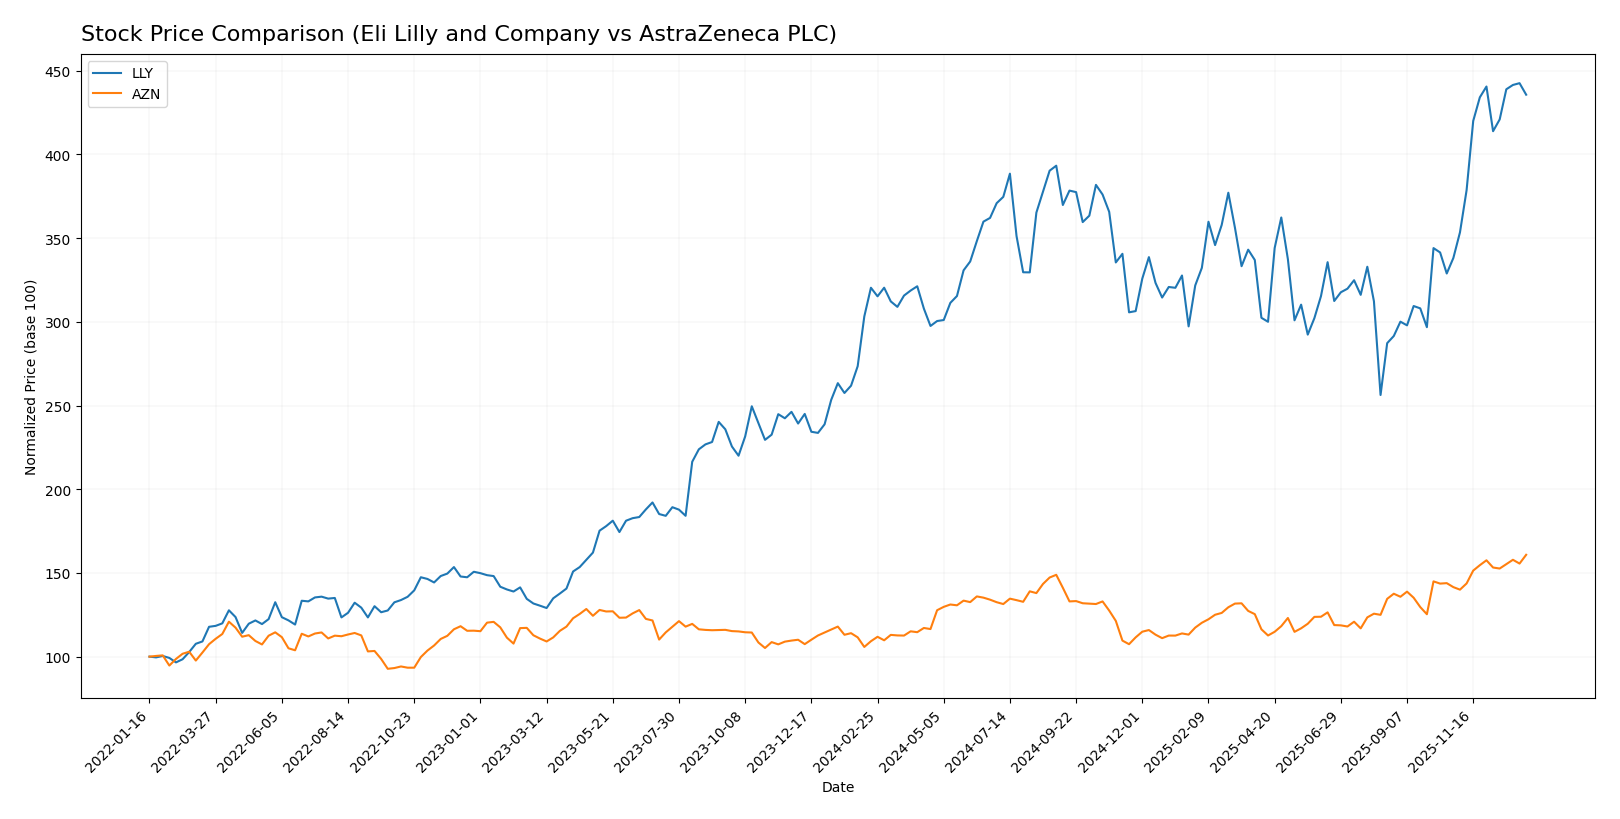
The stock price charts of Eli Lilly and Company (LLY) and AstraZeneca PLC (AZN) reveal strong bullish trends over the past 12 months, with notable price acceleration and distinct trading volume dynamics for each company.
Trend Analysis
Eli Lilly and Company (LLY) experienced a 35.99% price increase over the past year, indicating a bullish trend with accelerating momentum and significant volatility, reflected in a standard deviation of 95.89.
AstraZeneca PLC (AZN) showed a 47.27% price increase during the same period, also bullish with acceleration, but with far lower volatility, as its standard deviation was 7.74.
Comparing both, AstraZeneca outperformed Eli Lilly in market performance with a higher overall price gain, despite Eli Lilly’s stronger recent buyer dominance and volume acceleration.
Target Prices
The consensus target prices from verified analysts indicate expected appreciation potential for these pharmaceutical giants.
| Company | Target High | Target Low | Consensus |
|---|---|---|---|
| Eli Lilly and Company | 1300 | 830 | 1151.07 |
| AstraZeneca PLC | 108 | 103 | 105.5 |
Analysts expect Eli Lilly’s stock to rise moderately above its current price of 1063.56 USD, while AstraZeneca’s consensus target is also notably higher than its current 94.65 USD, signaling bullish sentiment for both.
Analyst Opinions Comparison
This section compares analysts’ ratings and financial scores for Eli Lilly and Company (LLY) and AstraZeneca PLC (AZN):
Rating Comparison
LLY Rating
- Rating: B+, categorized as Very Favorable by analysts.
- Discounted Cash Flow Score: 4, indicating a Favorable valuation outlook.
- Return on Equity Score: 5, rated Very Favorable for profit generation efficiency.
- Return on Assets Score: 5, showing Very Favorable asset utilization.
- Debt To Equity Score: 1, seen as Very Unfavorable reflecting high financial risk.
- Overall Score: 3, assessed as Moderate in overall financial standing.
AZN Rating
- Rating: B+, categorized as Very Favorable by analysts.
- Discounted Cash Flow Score: 4, indicating a Favorable valuation outlook.
- Return on Equity Score: 5, rated Very Favorable for profit generation efficiency.
- Return on Assets Score: 4, considered Favorable for asset utilization.
- Debt To Equity Score: 1, seen as Very Unfavorable reflecting high financial risk.
- Overall Score: 3, assessed as Moderate in overall financial standing.
Which one is the best rated?
Both LLY and AZN share the same overall rating (B+) and overall score (3). LLY shows slightly better asset utilization with a higher Return on Assets Score, while both face similar financial risk indicated by their Debt to Equity Scores.
Scores Comparison
The scores comparison between Eli Lilly and Company (LLY) and AstraZeneca PLC (AZN) is as follows:
LLY Scores
- Altman Z-Score: 8.08, indicating a safe zone with low bankruptcy risk.
- Piotroski Score: 7, categorized as strong financial health.
AZN Scores
- Altman Z-Score: 3.51, indicating a safe zone with low bankruptcy risk.
- Piotroski Score: 7, categorized as strong financial health.
Which company has the best scores?
Both LLY and AZN have Altman Z-Scores in the safe zone and strong Piotroski Scores of 7. LLY’s significantly higher Altman Z-Score suggests a stronger margin of financial safety than AZN.
Grades Comparison
Here is a comparison of the recent grades assigned to Eli Lilly and Company and AstraZeneca PLC by reputable grading firms:
Eli Lilly and Company Grades
The following table shows the latest grades for Eli Lilly from established grading companies:
| Grading Company | Action | New Grade | Date |
|---|---|---|---|
| B of A Securities | Maintain | Buy | 2025-12-15 |
| Wells Fargo | Maintain | Overweight | 2025-12-10 |
| BMO Capital | Maintain | Outperform | 2025-12-04 |
| Guggenheim | Maintain | Buy | 2025-12-03 |
| Morgan Stanley | Maintain | Overweight | 2025-11-24 |
| Bernstein | Maintain | Outperform | 2025-11-24 |
| Truist Securities | Maintain | Buy | 2025-11-19 |
| JP Morgan | Maintain | Overweight | 2025-11-18 |
| Morgan Stanley | Maintain | Overweight | 2025-11-13 |
| Citigroup | Maintain | Buy | 2025-11-12 |
Overall, Eli Lilly’s grades consistently indicate strong buy-side sentiment, with multiple “Buy,” “Overweight,” and “Outperform” ratings maintained in late 2025.
AstraZeneca PLC Grades
The following table displays recent grades for AstraZeneca from recognized grading firms:
| Grading Company | Action | New Grade | Date |
|---|---|---|---|
| UBS | Upgrade | Buy | 2025-02-13 |
| UBS | Upgrade | Neutral | 2024-11-20 |
| Erste Group | Upgrade | Buy | 2024-09-11 |
| TD Cowen | Maintain | Buy | 2024-08-12 |
| Argus Research | Maintain | Buy | 2024-05-30 |
| BMO Capital | Maintain | Outperform | 2024-04-26 |
| Deutsche Bank | Upgrade | Hold | 2024-04-16 |
| BMO Capital | Maintain | Outperform | 2024-02-12 |
| Deutsche Bank | Downgrade | Hold | 2024-02-08 |
| Jefferies | Downgrade | Hold | 2024-01-03 |
AstraZeneca’s grades show a mixture of upgrades and downgrades with a trend toward improvement from neutral or hold to buy, but also some recent holds, reflecting a more variable rating pattern.
Which company has the best grades?
Eli Lilly consistently holds strong buy and outperform ratings from multiple firms, while AstraZeneca shows mixed and somewhat less recent activity with upgrades and downgrades. Eli Lilly’s more stable and positive grades might suggest stronger analyst confidence, potentially impacting investor sentiment and portfolio positioning differently than AstraZeneca’s more fluctuating ratings.
Strengths and Weaknesses
Below is a comparison table highlighting key strengths and weaknesses of Eli Lilly and Company (LLY) and AstraZeneca PLC (AZN) based on their recent financials and market positions.
| Criterion | Eli Lilly and Company (LLY) | AstraZeneca PLC (AZN) |
|---|---|---|
| Diversification | Moderate diversification; strong focus on human pharmaceutical products with growing collaboration revenues (>$4.2B in 2024) | Highly diversified portfolio across oncology, cardiovascular, respiratory, and rare diseases |
| Profitability | High profitability with net margin 23.5%, ROIC 26.4%, and strong ROE of 74.6% | Solid profitability with net margin 13.0%, ROIC 10.3%, and ROE 17.3% |
| Innovation | Strong innovation evidenced by growing ROIC (+46%) and durable competitive advantage | Consistent innovation with growing ROIC (+21%) and a very favorable moat status |
| Global presence | Well-established global presence with product revenues reaching $40.7B in 2024 | Extensive global reach across multiple therapeutic areas with oncology sales ~$17.1B |
| Market Share | Leading positions in endocrinology and neuroscience; expanding oncology pipeline | Large market share in oncology and cardiovascular segments with growing rare disease portfolio |
Key takeaways: Eli Lilly exhibits stronger profitability and capital efficiency, while AstraZeneca boasts greater diversification and a broader therapeutic reach. Both companies demonstrate durable competitive moats with sustained innovation, but investors should weigh LLY’s higher valuation multiples against AZN’s more balanced financial ratios.
Risk Analysis
The table below summarizes key risks for Eli Lilly and Company (LLY) and AstraZeneca PLC (AZN) based on the latest 2024 data:
| Metric | Eli Lilly and Company (LLY) | AstraZeneca PLC (AZN) |
|---|---|---|
| Market Risk | Low beta 0.35 indicates low sensitivity to market swings | Very low beta 0.19, very defensive stock |
| Debt level | High debt-to-equity (2.37), moderate debt-to-assets (42.7%) | Moderate debt-to-equity (0.74), low debt-to-assets (28.95%) |
| Regulatory Risk | High due to pharma industry, ongoing drug approvals and patent expiries | High, with global regulatory environment and patent cliffs |
| Operational Risk | Medium, with diverse drug portfolio but reliance on key drugs | Medium-high, large scale and complexity across many countries |
| Environmental Risk | Moderate, increasing focus on sustainable pharma production | Moderate, active in ESG initiatives but complex supply chain |
| Geopolitical Risk | Moderate US-centric exposure, some global partnerships | High, significant exposure to Europe, Asia, and emerging markets |
The most impactful risks are regulatory and geopolitical. AstraZeneca faces higher geopolitical risk due to its broad international footprint, while Eli Lilly’s elevated debt level warrants cautious monitoring despite strong operational performance. Both companies operate in highly regulated environments, making drug approvals and patent expiries critical risk factors.
Which Stock to Choose?
Eli Lilly and Company (LLY) shows a strong income growth with a 32% revenue increase in 2024 and favorable profitability ratios, including a 23.51% net margin and 74.62% ROE. Despite a high debt-to-equity ratio of 2.37, LLY maintains a very favorable rating with a B+ score and demonstrates a very favorable moat with growing ROIC above WACC.
AstraZeneca PLC (AZN) also reports favorable income growth with an 18.03% revenue increase in 2024 and solid profitability, including a 13.01% net margin and 17.25% ROE. Its debt levels are more moderate with a debt-to-equity ratio of 0.74, supported by a very favorable B+ rating and a very favorable moat with a growing ROIC above WACC.
For investors prioritizing growth and strong profitability, LLY’s higher margins and robust ROIC trend might appear more attractive, whereas those valuing moderate leverage and steadier financial ratios could find AZN’s profile more fitting. Both companies show durable competitive advantages and favorable ratings, suggesting their suitability depends on individual risk tolerance and investment strategy.
Disclaimer: Investment carries a risk of loss of initial capital. The past performance is not a reliable indicator of future results. Be sure to understand risks before making an investment decision.
Go Further
I encourage you to read the complete analyses of Eli Lilly and Company and AstraZeneca PLC to enhance your investment decisions: