Home > Comparison > Healthcare > AZN vs BMY
The strategic rivalry between AstraZeneca PLC and Bristol-Myers Squibb Company shapes the healthcare sector’s evolution. AstraZeneca operates as a global biopharmaceutical leader with a broad portfolio spanning oncology and rare diseases. Bristol-Myers Squibb focuses on specialized biopharma with strengths in hematology and immunology. This analysis evaluates which model offers superior risk-adjusted returns amid sector innovation and regulatory pressures, guiding investors toward the optimal portfolio allocation.

Table of contents
Companies Overview
AstraZeneca and Bristol-Myers Squibb command significant influence in the global pharmaceutical landscape.
AstraZeneca PLC: Biopharma Innovator with a Global Reach
AstraZeneca leads as a biopharmaceutical powerhouse specializing in prescription medicines across oncology, cardiovascular, and rare diseases. Its revenue stems from a diversified portfolio including Tagrisso and Farxiga. In 2026, AstraZeneca sharpens its strategic focus on AI-driven drug discovery and global collaborations to expand its therapeutic footprint and innovation pipeline.
Bristol-Myers Squibb Company: Specialty Pharma Leader
Bristol-Myers Squibb commands the specialty pharmaceutical sector with a focus on immunology, oncology, and cardiovascular therapies. Its core revenue drivers include blockbuster drugs like Eliquis and Opdivo. The company’s 2026 strategy emphasizes expanding its immuno-oncology pipeline and leveraging genetic therapies to address unmet medical needs worldwide.
Strategic Collision: Similarities & Divergences
Both companies prioritize innovation in specialty medicines but diverge in approach—AstraZeneca invests heavily in AI partnerships, while Bristol-Myers Squibb focuses on genetic and immuno-oncology therapies. Their primary competition unfolds in oncology and cardiovascular markets. Investors face distinct profiles: AstraZeneca’s broad global footprint contrasts with Bristol-Myers Squibb’s concentrated specialty portfolio.
Income Statement Comparison
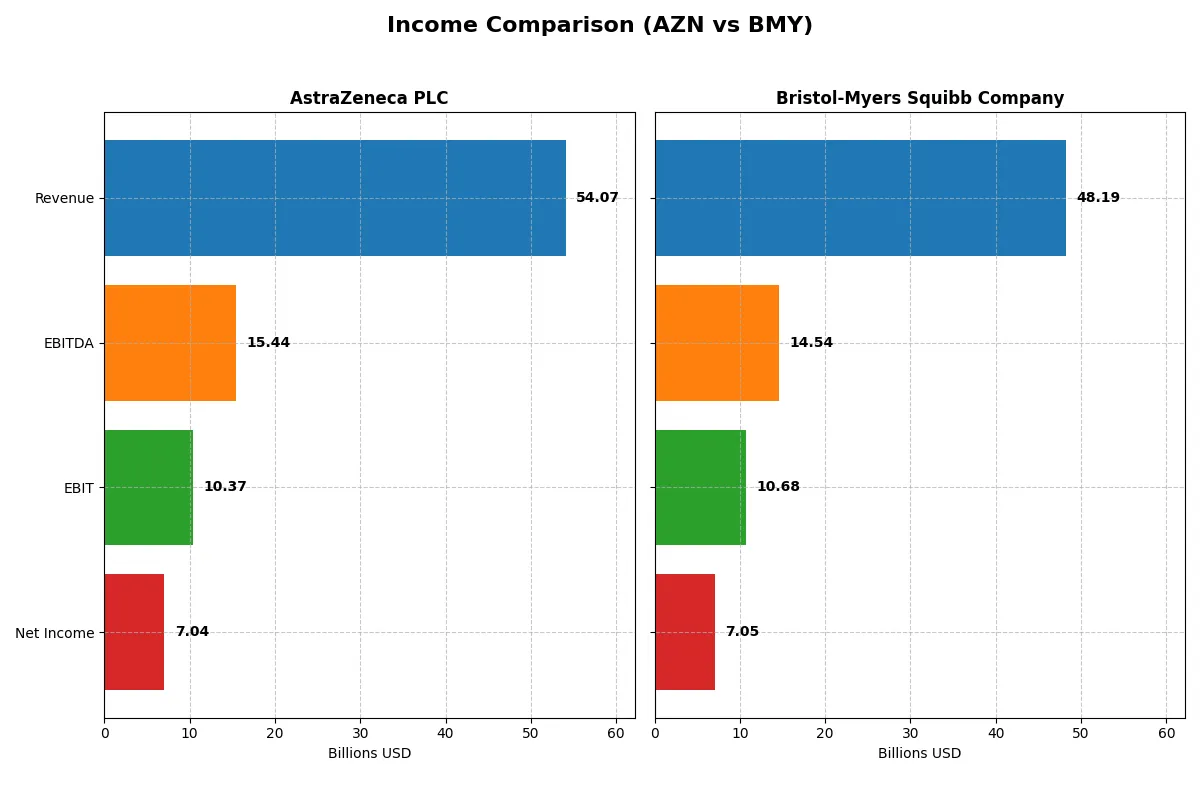
This data dissects the core profitability and scalability of both corporate engines to reveal who dominates the bottom line:
| Metric | AstraZeneca PLC (AZN) | Bristol-Myers Squibb Company (BMY) |
|---|---|---|
| Revenue | 54.1B | 48.2B |
| Cost of Revenue | 10.2B | 15.6B |
| Operating Expenses | 33.9B | 19.9B |
| Gross Profit | 43.9B | 32.6B |
| EBITDA | 15.4B | 14.5B |
| EBIT | 10.4B | 10.7B |
| Interest Expense | 1.68B | 1.51B |
| Net Income | 7.04B | 7.05B |
| EPS | 1.14 | 3.46 |
| Fiscal Year | 2024 | 2025 |
Income Statement Analysis: The Bottom-Line Duel
This income statement comparison will reveal which company drives greater efficiency and profitability in its core operations.
AstraZeneca PLC Analysis
AstraZeneca’s revenue surged from 26.6B in 2020 to 54.1B in 2024, doubling over five years. Net income followed suit, growing from 3.2B to 7.0B. Gross margin remains robust at 81.1%, and net margin steady at 13.0%. In 2024, AstraZeneca accelerated EBIT by 22%, signaling strong operational momentum and cost control.
Bristol-Myers Squibb Company Analysis
Bristol-Myers Squibb’s revenue plateaued near 48B from 2021 to 2025, with net income hovering around 7B. Gross margin stands at 67.7%, while net margin is slightly higher at 14.6%. After a negative net income in 2024, BMY rebounded sharply in 2025, delivering 178% EPS growth and a 266% surge in EBIT, evidencing a powerful recovery phase.
Margin Strength vs. Recovery Momentum
AstraZeneca boasts superior revenue growth and consistently high margins, reflecting steady operational efficiency. Bristol-Myers Squibb shows resilience with a dramatic rebound in profitability after a challenging year, though revenue growth lags. AstraZeneca’s profile suits investors valuing sustained expansion; BMY appeals to those betting on turnaround potential.
Financial Ratios Comparison
These vital ratios act as a diagnostic tool to expose the underlying fiscal health, valuation premiums, and capital efficiency of the companies compared below:
| Ratios | AstraZeneca (AZN) | Bristol-Myers Squibb (BMY) |
|---|---|---|
| ROE | 17.25% | 27.27% |
| ROIC | 10.30% | 10.59% |
| P/E | 57.29 | 15.55 |
| P/B | 9.88 | 3.61 |
| Current Ratio | 0.93 | 1.25 |
| Quick Ratio | 0.74 | 1.15 |
| D/E | 0.74 | 1.41 |
| Debt-to-Assets | 28.95% | 43.57% |
| Interest Coverage | 5.95 | 7.27 |
| Asset Turnover | 0.52 | 0.47 |
| Fixed Asset Turnover | 4.64 | 5.60 |
| Payout Ratio | 65.80% | 59.12% |
| Dividend Yield | 1.15% | 4.47% |
| Fiscal Year | 2024 | 2023 |
Efficiency & Valuation Duel: The Vital Signs
Financial ratios act as the company’s DNA, revealing hidden risks and operational excellence critical for sound investment decisions.
AstraZeneca PLC
AstraZeneca delivers strong profitability with a 17.25% ROE and 13.01% net margin, signaling efficient operations. However, its valuation appears stretched, with a high P/E of 57.29 and P/B of 9.88. The company balances shareholder returns with a modest 1.15% dividend yield amid significant reinvestment in R&D, reflecting growth focus.
Bristol-Myers Squibb Company
Bristol-Myers posts a favorable net margin of 14.64%, yet shows zero ROE and ROIC, indicating profitability challenges. Its P/E of 15.55 suggests a reasonable valuation. The firm offers a robust 4.6% dividend yield, emphasizing shareholder income over growth, while some liquidity metrics are unavailable, raising caution on short-term resilience.
Premium Valuation vs. Income Stability
AstraZeneca’s high profitability and reinvestment contrast with Bristol-Myers’ steady dividend and lower valuation. AstraZeneca suits growth-oriented investors accepting valuation risk. Bristol-Myers fits income-focused investors seeking yield amid operational uncertainty. The best balance depends on individual risk tolerance and investment goals.
Which one offers the Superior Shareholder Reward?
I compare AstraZeneca (AZN) and Bristol-Myers Squibb (BMY) by focusing on dividend yields, payout ratios, and buyback intensity. AZN pays a modest 1.15% yield with a high 66% payout ratio, supported by solid free cash flow coverage (1.29x). BMY yields nearly 4.6% with a more sustainable 71.5% payout ratio, backed by strong free cash flow and dividend-capex coverage. AZN’s buybacks are modest, while BMY aggressively returns capital through dividends and share buybacks, enhancing total return. Given BMY’s higher yield, healthier payout, and intense buyback activity, I find BMY offers the superior total shareholder reward in 2026.
Comparative Score Analysis: The Strategic Profile
The radar chart reveals the fundamental DNA and trade-offs of AstraZeneca PLC and Bristol-Myers Squibb Company, highlighting their financial strengths and valuation dynamics:
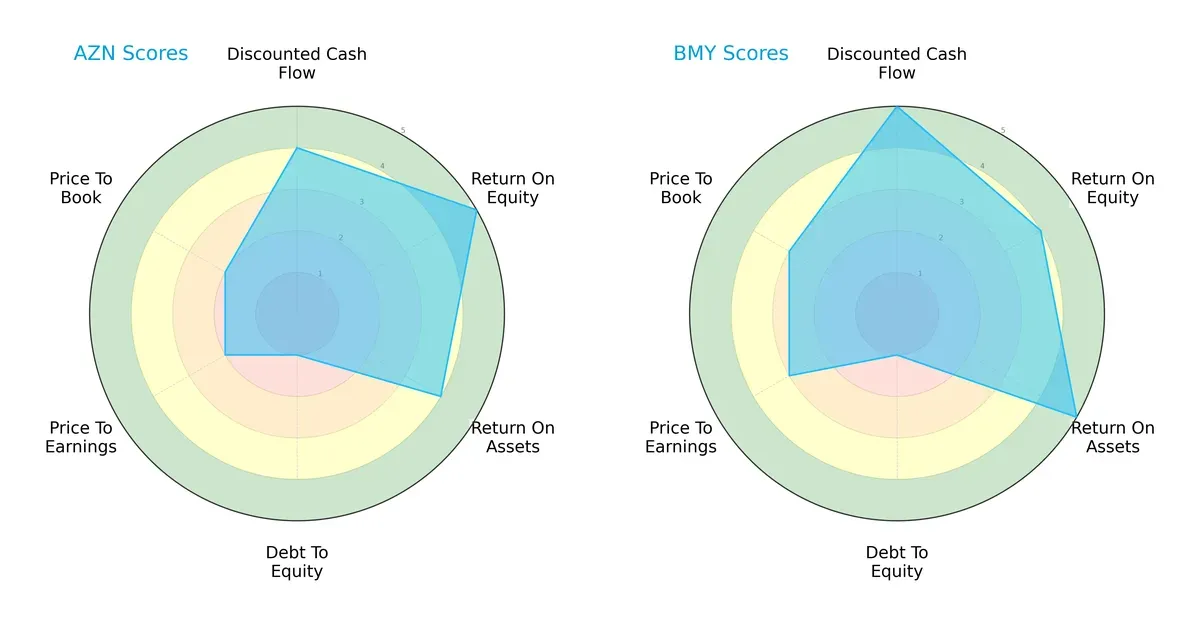
AstraZeneca shows strengths in ROE (5) and ROA (4) but suffers from weak debt management (1) and valuation scores (PE and PB at 2). Bristol-Myers Squibb delivers a more balanced profile with solid DCF (5), ROA (5), and moderate valuation scores (3), despite also struggling with high leverage. Bristol-Myers Squibb’s overall score (4) outperforms AstraZeneca’s (3), reflecting a more stable and diversified financial footing.
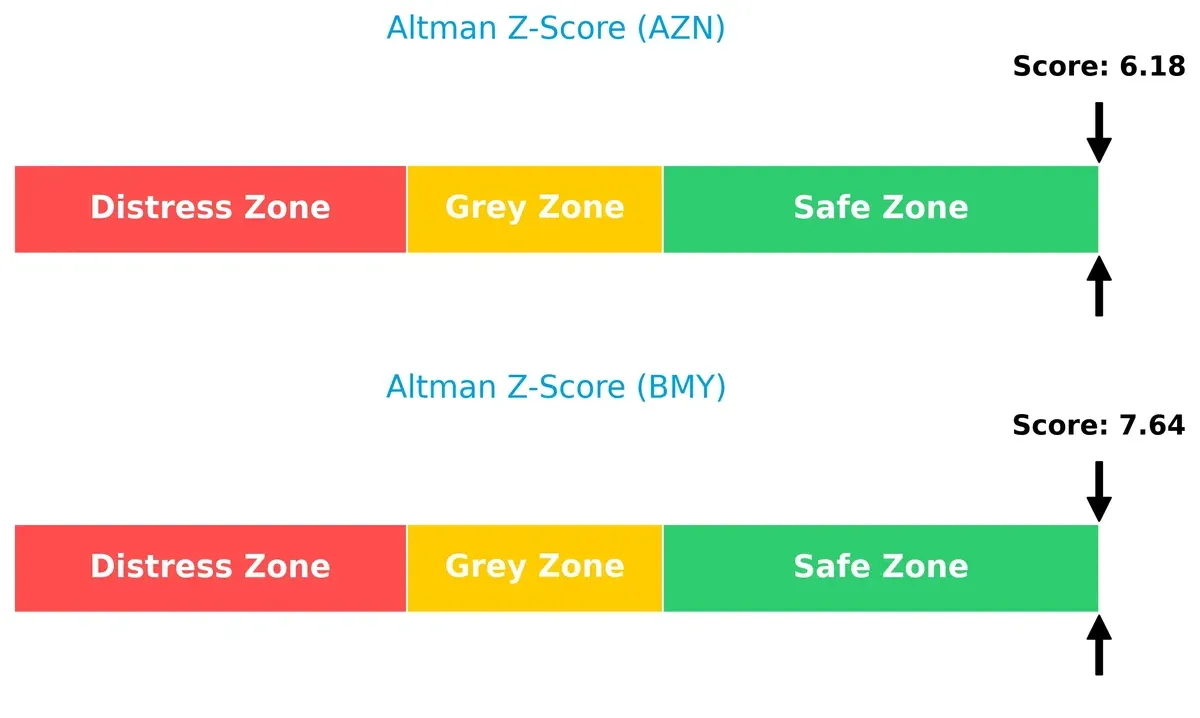
Bankruptcy Risk: Solvency Showdown
Bristol-Myers Squibb’s higher Altman Z-Score (7.64) versus AstraZeneca’s (6.18) indicates stronger solvency. Both firms sit comfortably in the safe zone, but BMY’s superior score better insulates it against economic downturns:
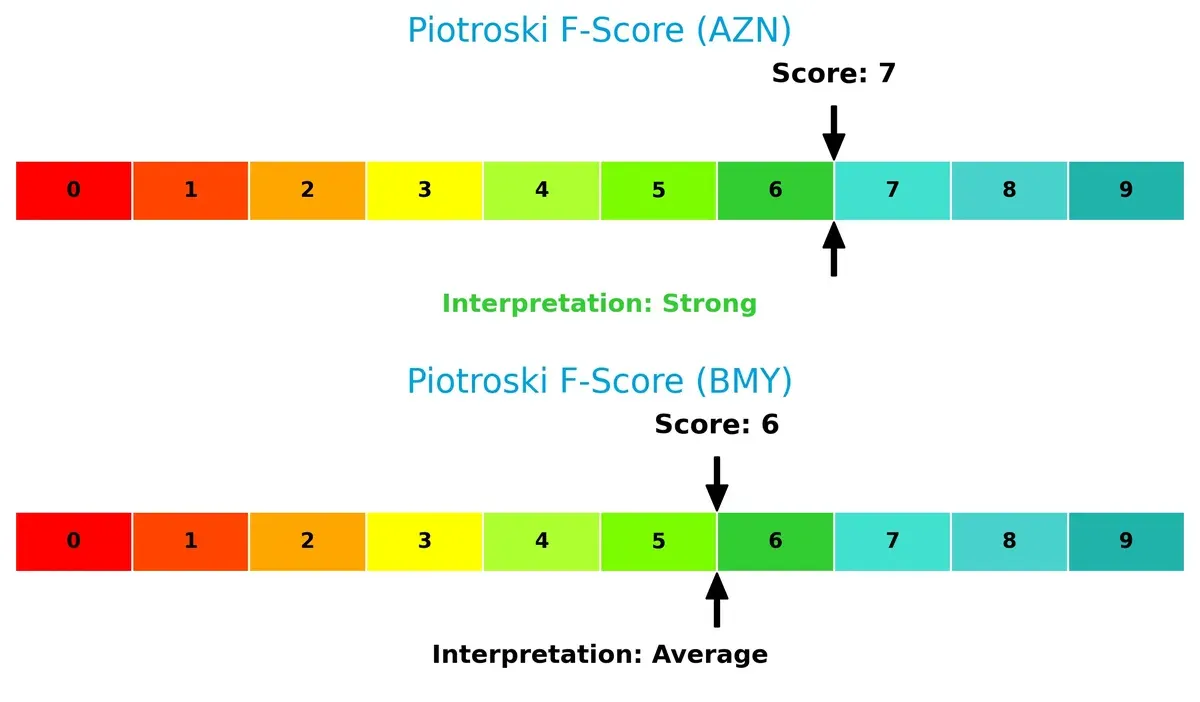
Financial Health: Quality of Operations
AstraZeneca’s Piotroski score of 7 signals strong financial health, outperforming Bristol-Myers Squibb’s average score of 6. This suggests AstraZeneca maintains more robust internal operations and profitability metrics:
How are the two companies positioned?
This section dissects AstraZeneca and Bristol-Myers Squibb’s operational DNA by comparing revenue distribution and internal strengths and weaknesses. The goal is to confront their economic moats and identify which model delivers a more resilient, sustainable competitive advantage in today’s market.
Revenue Segmentation: The Strategic Mix
This visual comparison dissects how AstraZeneca PLC and Bristol-Myers Squibb Company diversify their income streams and where their primary sector bets lie:
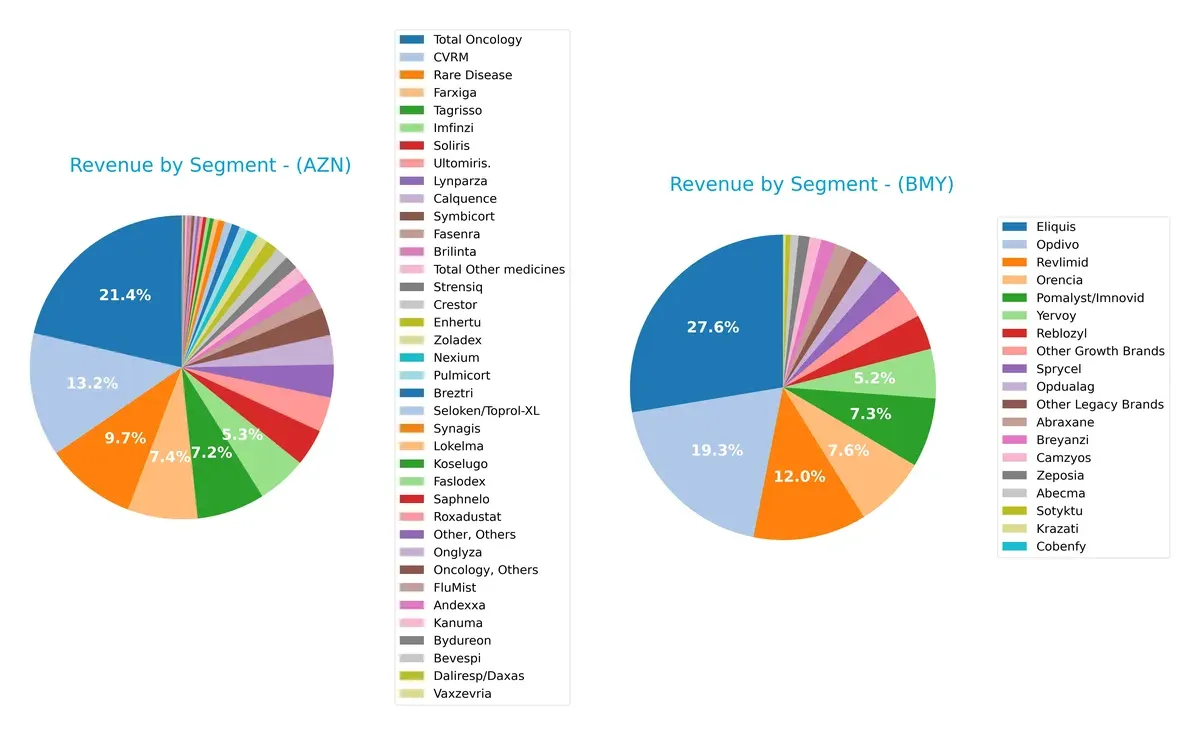
AstraZeneca leans heavily on its Oncology segment, which anchors $17.1B, supplemented by strong Rare Disease ($7.8B) and CVRM ($10.6B) revenues, showcasing a balanced yet focused portfolio. Bristol-Myers Squibb pivots around Eliquis at $13.3B and Opdivo at $9.3B, with other brands trailing far behind, indicating a concentration risk. AstraZeneca’s diversification supports resilience, while BMY’s dominance in a few key drugs exposes it to patent cliffs and competitive pressure.
Strengths and Weaknesses Comparison
This table compares the strengths and weaknesses of AstraZeneca PLC and Bristol-Myers Squibb Company:
AstraZeneca PLC Strengths
- Favorable profitability with 13.01% net margin and 17.25% ROE
- Strong ROIC at 10.3% above WACC of 4.67%
- Solid interest coverage at 6.17
- Diverse oncology and cardiovascular product portfolio with over $17B oncology revenue
- Favorable debt to assets at 28.95%
- High fixed asset turnover at 4.64
Bristol-Myers Squibb Company Strengths
- Highest net margin at 14.64%
- Strong interest coverage at 7.08
- Low debt-to-equity and debt-to-assets ratios favorable for balance sheet strength
- Diverse portfolio led by Eliquis ($13.3B) and Opdivo ($9.3B)
- Significant dividend yield at 4.6%
- Geographic diversification with $34B US and $13B rest-of-world sales
AstraZeneca PLC Weaknesses
- Unfavorable valuation multiples: PE at 57.29 and PB at 9.88
- Liquidity risk with current ratio 0.93 and quick ratio 0.74 below 1
- Neutral to low asset turnover at 0.52
- Moderate leverage with debt-to-equity at 0.74
Bristol-Myers Squibb Company Weaknesses
- Unfavorable ROE and ROIC at 0%, indicating low capital efficiency
- Missing WACC data impairs cost of capital assessment
- Zero current and quick ratios raise liquidity concerns
- Unfavorable asset and fixed asset turnover at 0
- Neutral PE at 15.55 but zero PB value complicates valuation
Overall, AstraZeneca demonstrates solid profitability and capital efficiency but faces valuation and liquidity challenges. Bristol-Myers Squibb shows strong margin and balance sheet metrics but suffers from weak capital returns and unclear liquidity. These differences highlight contrasting strategic and financial profiles.
The Moat Duel: Analyzing Competitive Defensibility
A structural moat is the only reliable shield protecting long-term profits from relentless competition erosion. Let’s dissect the sources of moats for AstraZeneca and Bristol-Myers Squibb:
AstraZeneca PLC: Innovation-Powered Intangible Asset Moat
AstraZeneca leverages strong intangible assets—patents and proprietary drugs—yielding high ROIC above WACC by 5.6%. Stable margins and growing ROIC confirm durable value creation. Pipeline expansions in oncology and rare diseases deepen its moat in 2026.
Bristol-Myers Squibb Company: Portfolio Scale & Market Penetration Moat
Bristol-Myers relies on a broad product portfolio and extensive U.S. market presence. Its moat contrasts AstraZeneca’s innovation edge but shows declining ROIC trends. Recent margin improvements and drug approvals offer rebound potential, though competitive pressure persists.
Innovation Intangibles vs. Scale Penetration: The Moat Verdict
AstraZeneca’s growing ROIC and patent-driven moat are wider and more sustainable than Bristol-Myers’ scale-based advantages. I see AstraZeneca better positioned to defend profits amid intensifying competition in 2026.
Which stock offers better returns?
Over the past year, AstraZeneca and Bristol-Myers Squibb showed notable price gains, with AstraZeneca exhibiting stronger acceleration and higher volatility in trading dynamics.
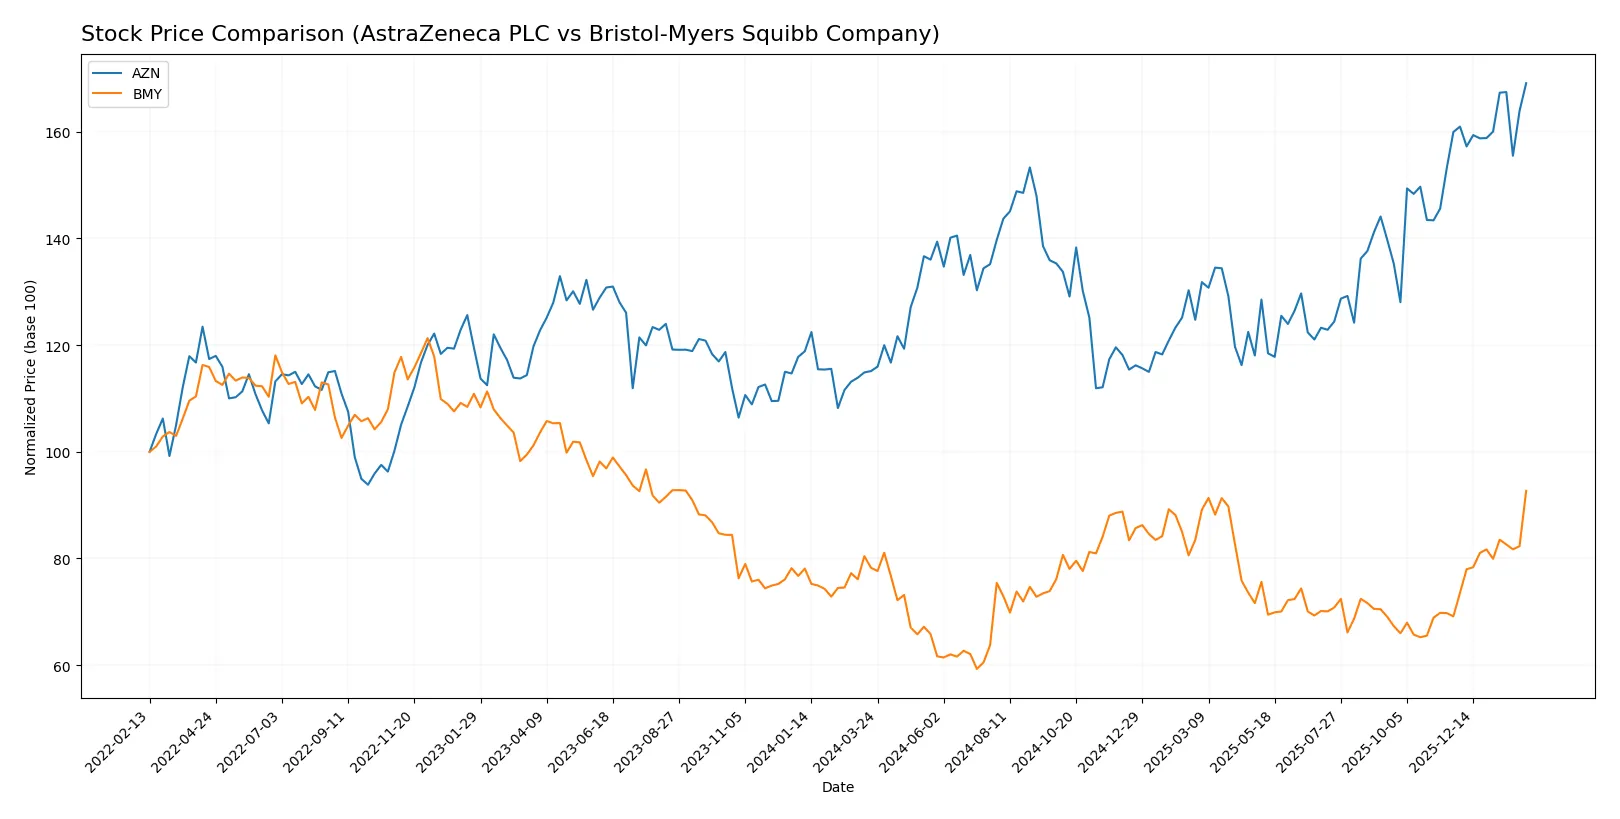
Trend Comparison
AstraZeneca PLC’s stock rose 46.88% over the past 12 months, signaling a bullish trend with accelerating momentum and a high volatility of 16.38%. It reached a peak of 193.03 and a low of 127.74.
Bristol-Myers Squibb’s stock gained 18.44% in the same period, also bullish with acceleration but lower volatility at 5.52%. Its price ranged between 39.66 and 61.99, showing steadier growth.
AstraZeneca’s trend outperformed Bristol-Myers Squibb’s by a wide margin, delivering the highest market return and stronger upward price acceleration.
Target Prices
Analysts provide a mixed outlook with clear target ranges for AstraZeneca and Bristol-Myers Squibb.
| Company | Target Low | Target High | Consensus |
|---|---|---|---|
| AstraZeneca PLC | 103 | 108 | 105.5 |
| Bristol-Myers Squibb Company | 40 | 72 | 60.11 |
The consensus target for AstraZeneca is significantly below its current price of 193, signaling potential overvaluation. Bristol-Myers Squibb’s target consensus at 60 aligns closely with its current price near 62, reflecting balanced expectations.

Don’t Let Luck Decide Your Entry Point
Optimize your entry points with our advanced ProRealTime indicators. You’ll get efficient buy signals with precise price targets for maximum performance. Start outperforming now!
How do institutions grade them?
Below is a summary of recent institutional grades for AstraZeneca PLC and Bristol-Myers Squibb Company:
AstraZeneca PLC Grades
This table shows recent grade changes and recommendations for AstraZeneca PLC by reputable firms.
| Grading Company | Action | New Grade | Date |
|---|---|---|---|
| UBS | Upgrade | Buy | 2025-02-13 |
| UBS | Upgrade | Neutral | 2024-11-20 |
| Erste Group | Upgrade | Buy | 2024-09-11 |
| TD Cowen | Maintain | Buy | 2024-08-12 |
| Argus Research | Maintain | Buy | 2024-05-30 |
| BMO Capital | Maintain | Outperform | 2024-04-26 |
| Deutsche Bank | Upgrade | Hold | 2024-04-16 |
| BMO Capital | Maintain | Outperform | 2024-02-12 |
| Deutsche Bank | Downgrade | Hold | 2024-02-08 |
| Jefferies | Downgrade | Hold | 2024-01-03 |
Bristol-Myers Squibb Company Grades
This table presents recent institutional grades and actions for Bristol-Myers Squibb Company.
| Grading Company | Action | New Grade | Date |
|---|---|---|---|
| Citigroup | Maintain | Neutral | 2026-02-06 |
| Wells Fargo | Maintain | Equal Weight | 2026-02-06 |
| Guggenheim | Maintain | Buy | 2026-02-06 |
| Piper Sandler | Maintain | Overweight | 2026-01-28 |
| Citigroup | Maintain | Neutral | 2026-01-27 |
| Leerink Partners | Maintain | Outperform | 2026-01-13 |
| Scotiabank | Maintain | Sector Perform | 2026-01-09 |
| UBS | Upgrade | Buy | 2026-01-07 |
| Citigroup | Maintain | Neutral | 2026-01-07 |
| B of A Securities | Upgrade | Buy | 2025-12-15 |
Which company has the best grades?
Bristol-Myers Squibb generally holds more consistent Buy and Outperform ratings by top-tier firms in 2026. AstraZeneca’s grades show mixed upgrades and downgrades with several Hold ratings. Investors may interpret Bristol-Myers Squibb’s steadier high grades as stronger institutional conviction.
Risks specific to each company
In the complex 2026 market, these categories pinpoint critical pressure points and systemic threats facing AstraZeneca PLC and Bristol-Myers Squibb Company:
1. Market & Competition
AstraZeneca PLC
- Strong global presence with diversified oncology and rare disease portfolio
Bristol-Myers Squibb Company
- Solid hematology and immunology focus but smaller market cap limits scale benefits
2. Capital Structure & Debt
AstraZeneca PLC
- Moderate debt-to-equity (0.74), manageable interest coverage (6.17)
Bristol-Myers Squibb Company
- Debt metrics unavailable but favorable debt-to-equity score suggests conservative leverage
3. Stock Volatility
AstraZeneca PLC
- Low beta (0.192) signals stable stock, less market sensitivity
Bristol-Myers Squibb Company
- Slightly higher beta (0.295) implies modestly greater volatility risk
4. Regulatory & Legal
AstraZeneca PLC
- Exposure to global regulatory environments, especially EU and US
Bristol-Myers Squibb Company
- US-centric regulation focus with risks in patent cliffs and litigation
5. Supply Chain & Operations
AstraZeneca PLC
- Extensive global supply network vulnerable to geopolitical disruptions
Bristol-Myers Squibb Company
- Concentrated US operations may face fewer international supply chain risks
6. ESG & Climate Transition
AstraZeneca PLC
- Increasing ESG initiatives but climate-related risks persist in manufacturing
Bristol-Myers Squibb Company
- Strong ESG policies with ongoing sustainability commitments, but data gaps exist
7. Geopolitical Exposure
AstraZeneca PLC
- Significant exposure to Europe, Asia, and emerging markets
Bristol-Myers Squibb Company
- Primarily US exposure reduces geopolitical complexity but limits diversification
Which company shows a better risk-adjusted profile?
AstraZeneca faces market and liquidity risks with elevated valuation multiples and weaker current ratios. Bristol-Myers Squibb lacks complete financial transparency but benefits from a more favorable valuation and dividend yield. AstraZeneca’s robust global reach contrasts with Bristol-Myers’ concentrated US operations. The critical risk for AstraZeneca is its stretched liquidity position in a competitive market. For Bristol-Myers, uncertainty around capital structure and operational efficiency is key. Overall, Bristol-Myers Squibb presents a slightly better risk-adjusted profile given its more favorable valuation and dividend yield, despite some data gaps. AstraZeneca’s high P/E ratio (57.3) signals elevated market expectations that warrant caution.
Final Verdict: Which stock to choose?
AstraZeneca’s superpower lies in its sustainable competitive advantage, demonstrated by a growing ROIC well above its cost of capital. This efficient capital allocation drives solid profitability and innovation. However, its stretched liquidity ratios call for caution. AstraZeneca suits investors seeking aggressive growth with a tolerance for operational complexity.
Bristol-Myers Squibb commands a strategic moat through steady recurring revenue and a strong safety profile, reflected in robust free cash flow yield and dividend yield. Its more conservative balance sheet and recent earnings acceleration offer relative stability versus AstraZeneca. It fits well in GARP portfolios aiming for growth with moderate risk.
If you prioritize dynamic growth with a proven ability to create value, AstraZeneca outshines due to its rising profitability and innovation edge. However, if you seek better stability and income with a solid cash flow foundation, Bristol-Myers Squibb offers a more balanced risk-return profile. Each choice aligns with distinct investor profiles and risk appetites.
Disclaimer: Investment carries a risk of loss of initial capital. The past performance is not a reliable indicator of future results. Be sure to understand risks before making an investment decision.
Go Further
I encourage you to read the complete analyses of AstraZeneca PLC and Bristol-Myers Squibb Company to enhance your investment decisions: