Home > Comparison > Healthcare > AZN vs BIIB
The strategic rivalry between AstraZeneca PLC and Biogen Inc. defines the current trajectory of the healthcare sector. AstraZeneca operates as a global biopharmaceutical powerhouse with diversified prescription medicines, while Biogen focuses on specialized neurological therapies. This head-to-head pits broad portfolio scale against niche innovation in drug manufacturing. This analysis will clarify which company offers superior risk-adjusted returns for a diversified portfolio navigating evolving healthcare dynamics.

Table of contents
Companies Overview
AstraZeneca and Biogen stand as key players in the pharmaceutical landscape, shaping treatments globally.
AstraZeneca PLC: Global Biopharma Powerhouse
AstraZeneca dominates as a biopharmaceutical leader specializing in prescription medicines across cardiovascular, oncology, and rare diseases. Its core revenue flows from blockbuster drugs like Tagrisso and Imfinzi, supported by a broad international footprint. In 2026, AstraZeneca emphasizes strategic collaborations and AI-driven drug discovery to accelerate innovation and market penetration.
Biogen Inc.: Neurological Therapy Specialist
Biogen excels as a neurological disease-focused pharmaceutical firm, generating revenue mainly from therapies treating multiple sclerosis and neurodegenerative disorders. Its pipeline centers on advancing treatments for Alzheimer’s and Parkinson’s disease, backed by biosimilars and cutting-edge neuroimmunology programs. In 2026, Biogen prioritizes expanding its neurological portfolio and strengthening partnerships to fuel growth.
Strategic Collision: Similarities & Divergences
Both companies pursue innovation but diverge in focus—AstraZeneca embraces a diversified therapeutic scope, while Biogen zeroes in on neurological conditions. Their primary battleground lies in specialty drug development and commercialization. AstraZeneca’s scale offers stability; Biogen’s niche expertise presents high-risk, high-reward potential, defining distinct investment profiles for cautious versus growth-oriented investors.
Income Statement Comparison
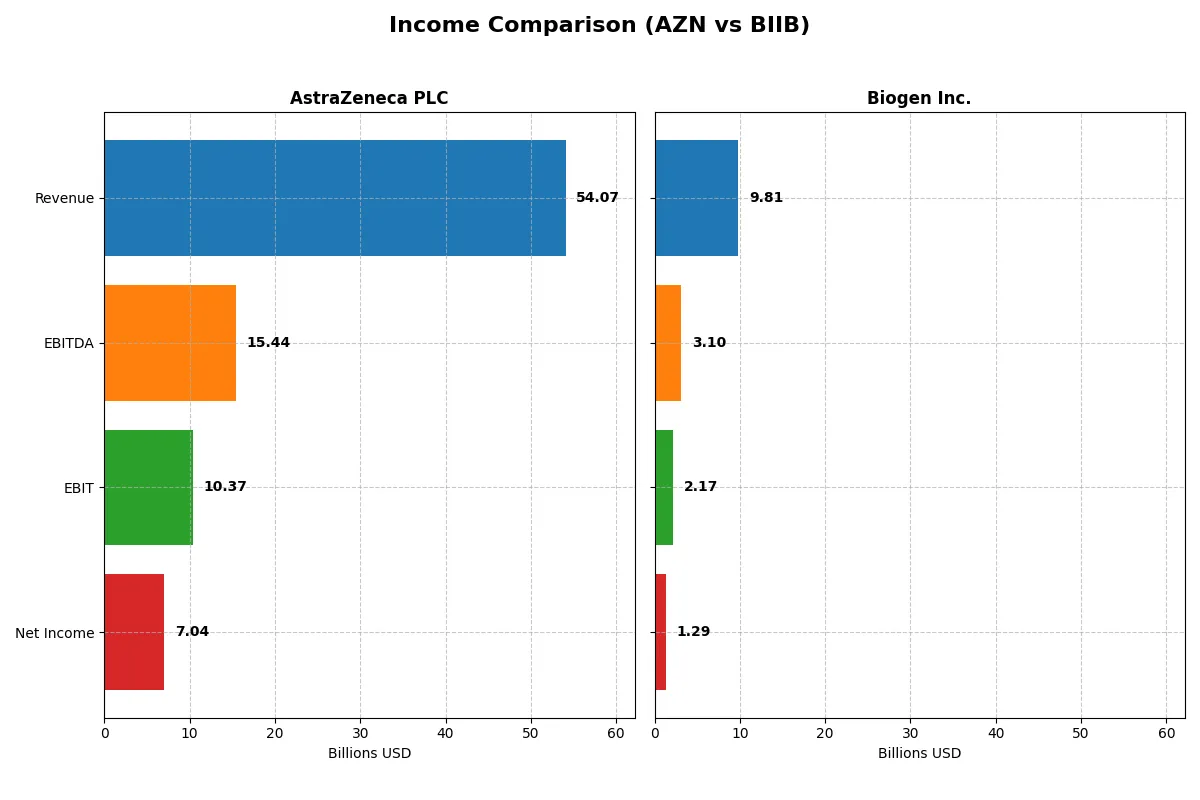
This data dissects the core profitability and scalability of both corporate engines to reveal who dominates the bottom line:
| Metric | AstraZeneca PLC (AZN) | Biogen Inc. (BIIB) |
|---|---|---|
| Revenue | 54.1B | 9.8B |
| Cost of Revenue | 10.2B | 2.9B |
| Operating Expenses | 33.9B | 5.0B |
| Gross Profit | 43.9B | 6.9B |
| EBITDA | 15.4B | 3.1B |
| EBIT | 10.4B | 2.2B |
| Interest Expense | 1.7B | 246M |
| Net Income | 7.0B | 1.3B |
| EPS | 1.14 | 8.85 |
| Fiscal Year | 2024 | 2025 |
Income Statement Analysis: The Bottom-Line Duel
The following income statement comparison reveals which company runs a more efficient and profitable business engine in recent years.
AstraZeneca PLC Analysis
AstraZeneca’s revenue surged from $26.6B in 2020 to $54.1B in 2024, doubling over five years. Net income followed suit, rising from $3.2B to $7.0B. The firm maintains an impressive gross margin above 80% and a net margin around 13%, signaling strong cost control and profitability momentum in 2024 despite a slight EPS decline.
Biogen Inc. Analysis
Biogen’s revenue held steady near $9.8B–$10.2B from 2021 to 2025 but declined 10.7% overall. Net income decreased from $1.6B in 2021 to $1.3B in 2025. Gross margin remained healthy at about 70%, and net margin hovered near 13%. However, Biogen’s recent growth deteriorated sharply, with falling EPS and margins indicating operational challenges.
Growth Dominance vs. Stability Struggles
AstraZeneca outperforms Biogen with robust top-line and bottom-line growth, alongside superior margin expansion. Biogen’s stagnant revenue and declining earnings highlight structural headwinds. Investors prioritizing growth and improving profitability may find AstraZeneca’s profile more compelling, while Biogen’s stability is overshadowed by its unfavorable income statement trends.
Financial Ratios Comparison
These vital ratios act as a diagnostic tool to expose the underlying fiscal health, valuation premiums, and capital efficiency of the compared companies:
| Ratios | AstraZeneca (AZN) | Biogen (BIIB) |
|---|---|---|
| ROE | 17.2% | 7.1% |
| ROIC | 10.3% | 6.6% |
| P/E | 57.3 | 19.96 |
| P/B | 9.88 | 1.41 |
| Current Ratio | 0.93 | 2.68 |
| Quick Ratio | 0.74 | 2.03 |
| D/E (Debt to Equity) | 0.74 | 0.38 |
| Debt-to-Assets | 28.9% | 23.6% |
| Interest Coverage | 5.95 | 7.63 |
| Asset Turnover | 0.52 | 0.33 |
| Fixed Asset Turnover | 4.64 | 2.95 |
| Payout ratio | 65.8% | 0% |
| Dividend yield | 1.15% | 0% |
| Fiscal Year | 2024 | 2025 |
Efficiency & Valuation Duel: The Vital Signs
Financial ratios serve as a company’s DNA, unveiling hidden risks and operational strengths crucial for investor insight.
AstraZeneca PLC
AstraZeneca shows strong profitability with a 17.25% ROE and a 13.01% net margin, signaling operational efficiency. However, its valuation appears stretched, with a P/E of 57.29 and a P/B near 10. The company balances shareholder returns via a modest 1.15% dividend yield, while reinvesting heavily in R&D for growth.
Biogen Inc.
Biogen delivers a favorable net margin of 13.18% but a weaker 7.08% ROE, indicating less profitability efficiency. Its valuation looks reasonable, with a P/E near 20 and a low P/B of 1.41. Biogen offers no dividend, opting to channel cash flow into research and development to fuel future expansion.
Premium Valuation vs. Operational Safety
AstraZeneca’s high ROE and margin come at a premium valuation, raising risk concerns. Biogen’s cheaper valuation and solid margins offer a more balanced risk-reward profile. Investors seeking growth with operational discipline may prefer Biogen, while those accepting valuation stretch for profitability might lean toward AstraZeneca.
Which one offers the Superior Shareholder Reward?
AstraZeneca (AZN) pays a modest dividend yield near 1.15% with a high payout ratio around 65-75%. Its dividend is well-covered by free cash flow, signaling sustainability. AZN also executes steady buybacks, boosting total returns. Biogen (BIIB) pays no dividend, reinvesting aggressively in R&D and growth. BIIB’s buyback intensity is solid, with a lower payout risk and stronger cash ratios. Historically, AZN’s balanced income and buybacks suit income-focused investors. BIIB offers higher growth potential but lacks immediate yield. In 2026, I favor AZN for a superior total return profile, blending reliable income and capital return with prudent cash flow coverage.
Comparative Score Analysis: The Strategic Profile
The radar chart reveals the fundamental DNA and trade-offs of AstraZeneca PLC and Biogen Inc., highlighting their distinct strategic strengths and vulnerabilities:
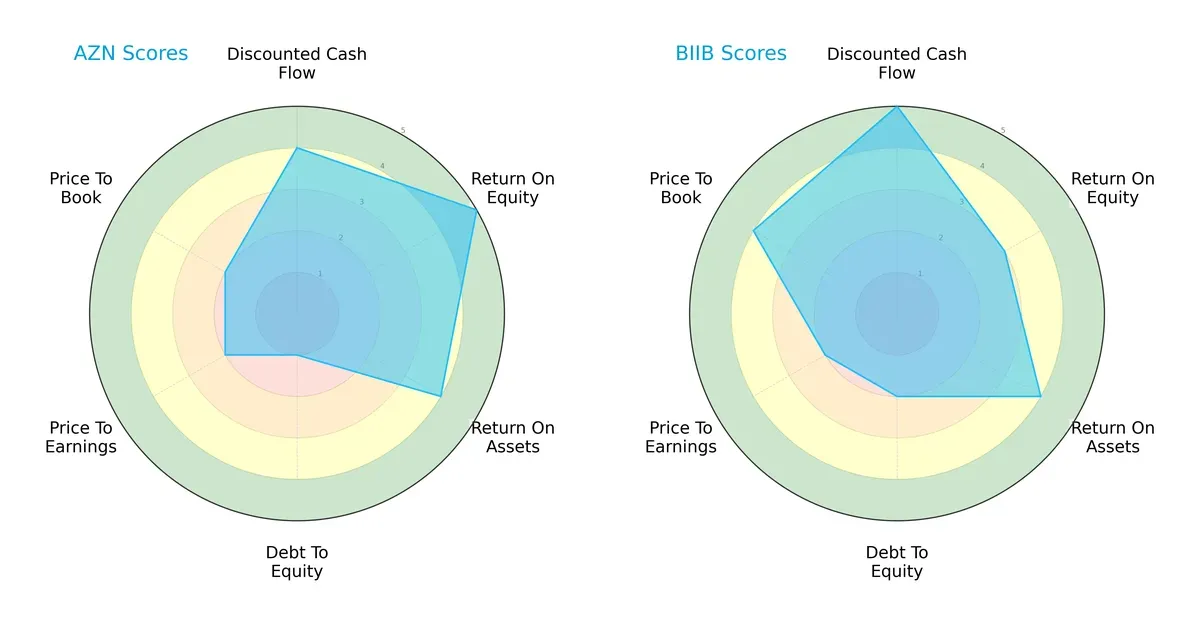
AstraZeneca excels in Return on Equity (5) and Return on Assets (4), demonstrating operational efficiency. Biogen leads in Discounted Cash Flow (5) and Price-to-Book (4), indicating robust valuation appeal. AstraZeneca’s very unfavorable Debt/Equity score (1) contrasts with Biogen’s moderately unfavorable (2), giving Biogen a more balanced financial profile. AstraZeneca relies heavily on profitability edges, while Biogen shows a more diversified strength across valuation and leverage.
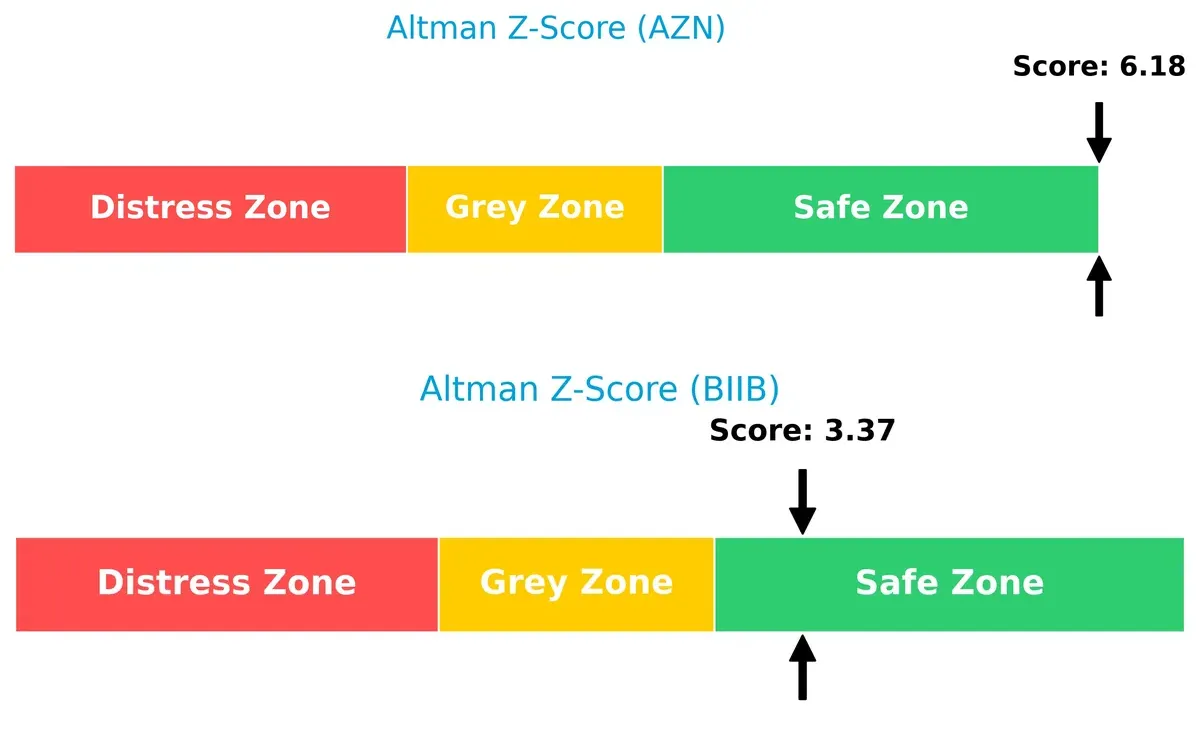
Bankruptcy Risk: Solvency Showdown
AstraZeneca’s Altman Z-Score of 6.18 versus Biogen’s 3.37 signals stronger solvency for AstraZeneca, suggesting a safer long-term survival outlook in this cycle:
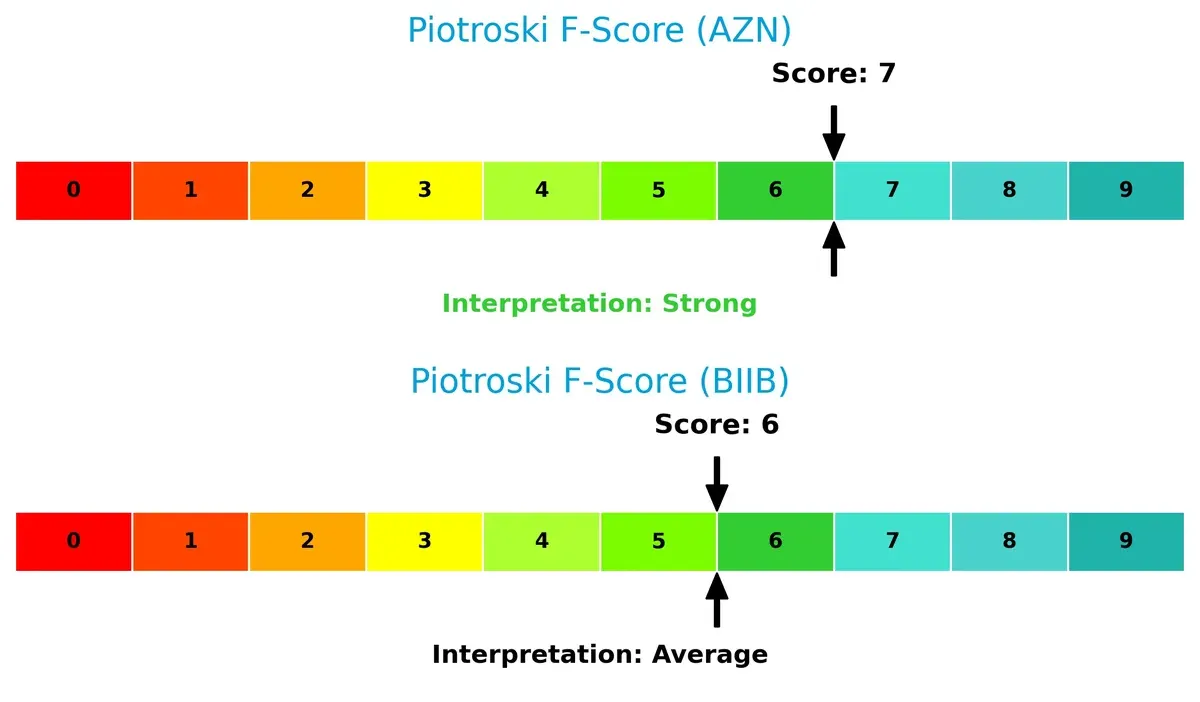
Financial Health: Quality of Operations
AstraZeneca’s Piotroski F-Score of 7 outperforms Biogen’s 6, indicating superior financial health and fewer internal red flags, which supports AstraZeneca’s operational resilience:
How are the two companies positioned?
This section dissects the operational DNA of AstraZeneca and Biogen by comparing their revenue distribution and internal dynamics. The goal is to confront their economic moats to reveal which model delivers the most resilient competitive advantage today.
Revenue Segmentation: The Strategic Mix
The following visual comparison dissects how AstraZeneca PLC and Biogen Inc. diversify their income streams and where their primary sector bets lie:
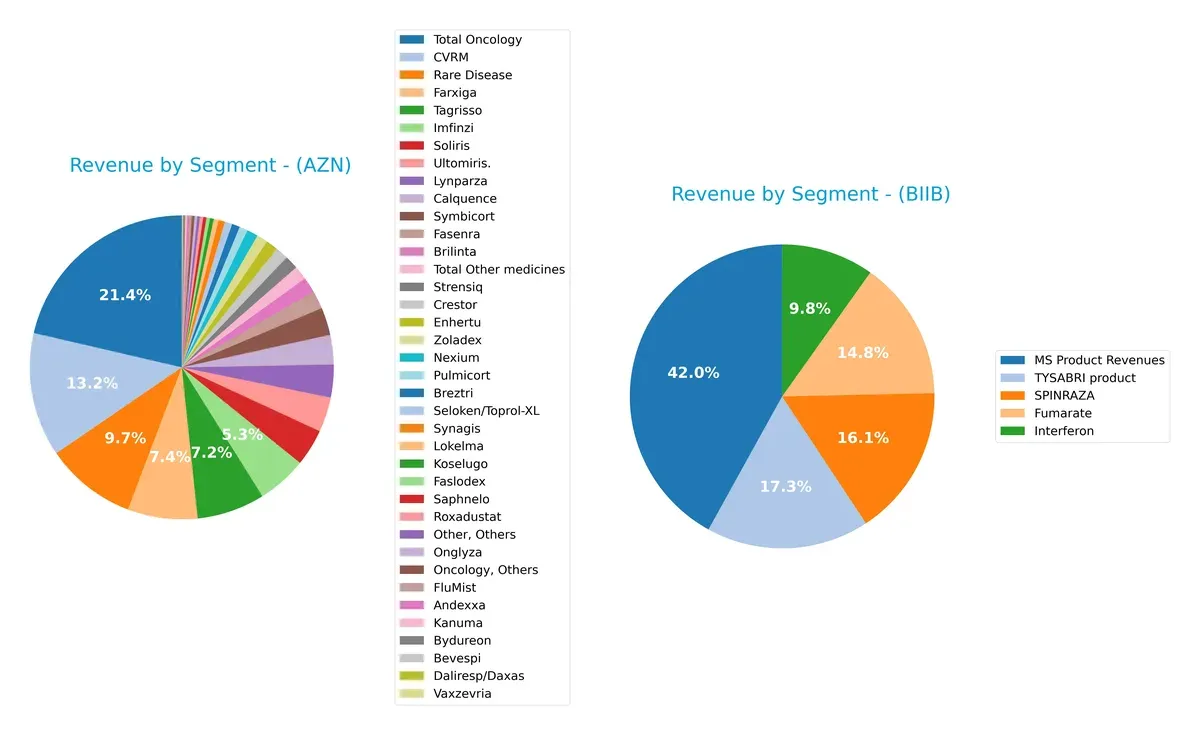
AstraZeneca anchors its revenue heavily in Oncology, with $17.1B in 2023 dwarfing other segments like CVRM at $10.6B and Rare Disease at $7.8B. This signals a strategic pivot towards high-margin, innovation-driven therapies. Biogen, by contrast, relies on a more concentrated MS Product Revenues base at $4.7B, complemented by SPINRAZA and TYSABRI products around $1.7B and $1.9B, respectively. Biogen’s narrower portfolio heightens concentration risk but benefits from focused expertise in neurology.
Strengths and Weaknesses Comparison
This table compares the strengths and weaknesses of AstraZeneca PLC and Biogen Inc. based on diversification, profitability, financial health, innovation, global presence, and market share:
AstraZeneca PLC Strengths
- Broad product portfolio across oncology, CVRM, respiratory, and rare diseases
- Favorable net margin (13.01%) and ROE (17.25%) indicate strong profitability
- Low debt-to-assets (28.95%) and solid interest coverage (6.17) reflect financial stability
Biogen Inc. Strengths
- Favorable net margin (13.18%) and WACC (4.44%) support efficient capital use
- Strong liquidity with current ratio (2.68) and quick ratio (2.03) above 2.0
- Global revenue presence with significant US and non-US sales enhances geographic diversification
AstraZeneca PLC Weaknesses
- Current and quick ratios below 1 indicate weaker short-term liquidity
- High PE (57.29) and PB (9.88) ratios suggest overvaluation risks
- Moderate asset turnover (0.52) signals potential efficiency constraints
Biogen Inc. Weaknesses
- Low ROE (7.08%) and neutral ROIC (6.62%) imply weaker profitability on equity
- Asset turnover low at 0.33, indicating less efficient asset use
- Lack of dividend yield may deter income-focused investors
AstraZeneca exhibits robust diversification and profitability but faces liquidity and valuation concerns. Biogen offers stronger liquidity and global reach but lags in return metrics and asset efficiency. These contrasts shape their strategic positions in pharmaceutical markets.
The Moat Duel: Analyzing Competitive Defensibility
A structural moat is the sole barrier protecting long-term profits from competition’s relentless erosion. Here’s how AstraZeneca and Biogen fare:
AstraZeneca PLC: Innovation-Driven Patent Moat
AstraZeneca’s competitive advantage stems from its robust patent portfolio and R&D pipeline. This moat shows in its strong ROIC exceeding WACC by 5.6%, signaling efficient capital use. In 2026, new oncology and rare disease therapies could deepen this edge.
Biogen Inc.: Specialized Neurological Focus with Narrower Moat
Biogen relies on specialized neurological drugs, creating a niche moat. Unlike AstraZeneca, Biogen’s ROIC margin is slimmer and trending down, indicating weakening capital efficiency. Its future depends on successful launches in Alzheimer’s and neuroimmunology, which remain high risk.
Patents and Pipeline vs. Niche Specialization: Who Holds the Moat Stronger?
AstraZeneca’s wider moat and growing profitability outmatch Biogen’s narrower, eroding advantage. AstraZeneca is better positioned to defend and expand market share amid intensifying competition.
Which stock offers better returns?
The past year reveals diverging paths: AstraZeneca’s stock surges with sustained acceleration, while Biogen’s price declines despite recent positive momentum.
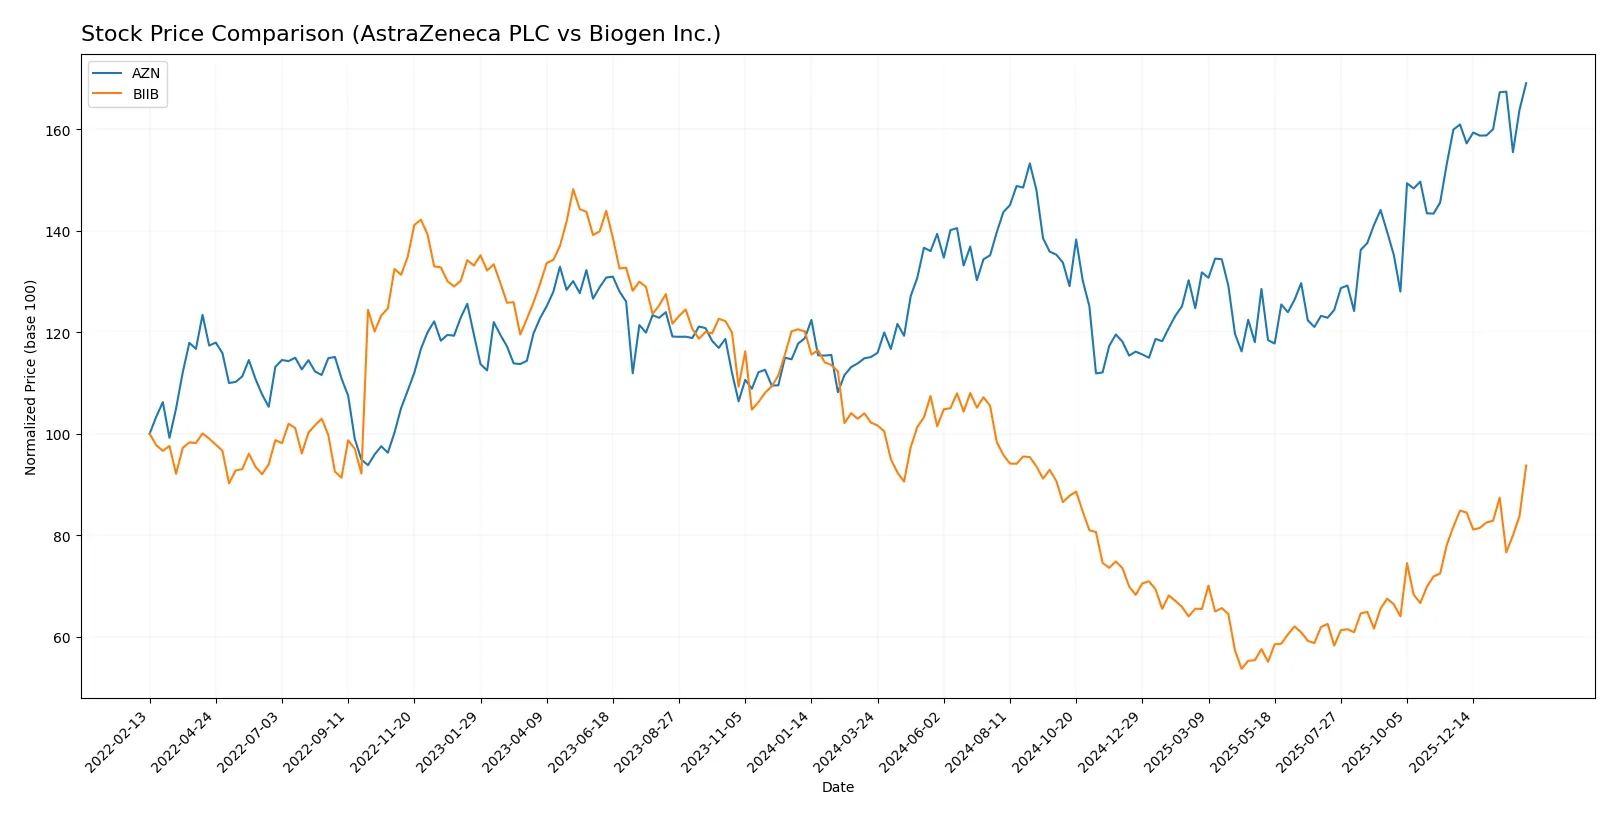
Trend Comparison
AstraZeneca’s stock rose 46.88% over 12 months, showing a bullish trend with accelerating gains. Its volatility remains moderate with a 16.38 standard deviation. The price peaked at 193.03 and held a low of 127.74.
Biogen’s stock fell 8.27% over the same period, marking a bearish trend despite acceleration. Volatility is high with a 34.43 standard deviation. The highest price reached 231.82, dropping to a low of 115.17.
AstraZeneca outperformed Biogen over the past year, delivering the strongest market gains with a clear bullish trajectory versus Biogen’s overall decline.
Target Prices
Analysts present a mixed target consensus for AstraZeneca PLC and Biogen Inc.
| Company | Target Low | Target High | Consensus |
|---|---|---|---|
| AstraZeneca PLC | 103 | 108 | 105.5 |
| Biogen Inc. | 143 | 250 | 188.75 |
AstraZeneca’s consensus target of 105.5 is significantly below its current price near 193, signaling potential overvaluation. Biogen’s 188.75 target is also below its 201 price, suggesting cautious analyst sentiment despite recent gains.

Don’t Let Luck Decide Your Entry Point
Optimize your entry points with our advanced ProRealTime indicators. You’ll get efficient buy signals with precise price targets for maximum performance. Start outperforming now!
How do institutions grade them?
AstraZeneca PLC Grades
Here are recent institutional grades for AstraZeneca PLC from leading analysts:
| Grading Company | Action | New Grade | Date |
|---|---|---|---|
| UBS | Upgrade | Buy | 2025-02-13 |
| UBS | Upgrade | Neutral | 2024-11-20 |
| Erste Group | Upgrade | Buy | 2024-09-11 |
| TD Cowen | Maintain | Buy | 2024-08-12 |
| Argus Research | Maintain | Buy | 2024-05-30 |
| BMO Capital | Maintain | Outperform | 2024-04-26 |
| Deutsche Bank | Upgrade | Hold | 2024-04-16 |
| BMO Capital | Maintain | Outperform | 2024-02-12 |
| Deutsche Bank | Downgrade | Hold | 2024-02-08 |
| Jefferies | Downgrade | Hold | 2024-01-03 |
Biogen Inc. Grades
The table below summarizes Biogen Inc.’s recent grades from reputable financial institutions:
| Grading Company | Action | New Grade | Date |
|---|---|---|---|
| Oppenheimer | Maintain | Outperform | 2026-01-30 |
| Citigroup | Maintain | Neutral | 2026-01-27 |
| Truist Securities | Maintain | Hold | 2026-01-08 |
| Citigroup | Maintain | Neutral | 2026-01-07 |
| Morgan Stanley | Maintain | Equal Weight | 2025-12-12 |
| Wells Fargo | Maintain | Equal Weight | 2025-12-10 |
| HSBC | Downgrade | Reduce | 2025-12-10 |
| Piper Sandler | Maintain | Neutral | 2025-11-21 |
| Stifel | Upgrade | Buy | 2025-11-06 |
| Bernstein | Maintain | Market Perform | 2025-11-03 |
Which company has the best grades?
AstraZeneca holds stronger and more consistently positive grades, including multiple Buy and Outperform ratings. Biogen’s grades lean toward Neutral and Hold, with recent downgrades. Investors might view AstraZeneca as having greater institutional confidence.
Risks specific to each company
The following categories identify the critical pressure points and systemic threats facing both firms in the 2026 market environment:
1. Market & Competition
AstraZeneca PLC
- Large market cap (598B) supports strong competitive positioning but faces high P/E and P/B ratios signaling valuation risks.
Biogen Inc.
- Smaller market cap (29.5B) and better valuation metrics (P/E 20, P/B 1.41) offer potential but face intense niche competition in neurology.
2. Capital Structure & Debt
AstraZeneca PLC
- Moderate debt-to-equity (0.74) with favorable debt-to-assets (29%) and interest coverage (6.17) but weak liquidity ratios (current ratio 0.93).
Biogen Inc.
- Lower debt-to-equity (0.38) and stronger liquidity (current ratio 2.68) reduce financial risk with robust interest coverage (8.8).
3. Stock Volatility
AstraZeneca PLC
- Beta of 0.19 indicates low market sensitivity, offering relative stability.
Biogen Inc.
- Even lower beta at 0.16 suggests Biogen’s stock is less volatile, appealing for risk-averse investors.
4. Regulatory & Legal
AstraZeneca PLC
- Broad global footprint exposes AZN to varying regulatory regimes and patent litigations in multiple jurisdictions.
Biogen Inc.
- Focus on neurological disorders entails complex FDA scrutiny and patent challenges, especially for Alzheimer’s therapies.
5. Supply Chain & Operations
AstraZeneca PLC
- Large global operations with 94K employees increase complexity and exposure to supply chain disruptions.
Biogen Inc.
- Smaller workforce (7.6K) and focused manufacturing reduce operational risk but increase dependency on key suppliers.
6. ESG & Climate Transition
AstraZeneca PLC
- UK-based with increasing ESG commitments; faces pressure to align with EU and UK climate regulations.
Biogen Inc.
- US-based, advancing in ESG but less public data on climate initiatives; risks tied to evolving US regulatory standards.
7. Geopolitical Exposure
AstraZeneca PLC
- Global presence spans Europe, Americas, Asia, and Africa, heightening geopolitical risk amid trade tensions and sanctions.
Biogen Inc.
- Primarily US-focused with some international collaborations; lower geopolitical risk but dependent on US policy stability.
Which company shows a better risk-adjusted profile?
AstraZeneca’s most significant risk lies in its stretched liquidity and complex global operations. Biogen’s key vulnerability is regulatory and competitive pressure in niche neurology markets. Biogen exhibits a better risk-adjusted profile, supported by stronger liquidity and lower leverage. Notably, AstraZeneca’s weak current ratio underlines a liquidity red flag in a volatile market.
Final Verdict: Which stock to choose?
AstraZeneca’s superpower lies in its robust and growing return on invested capital, signaling a strong economic moat and efficient capital use. Its bullish momentum underpins confidence, but the sub-1 current ratio is a point of vigilance for liquidity-conscious investors. AstraZeneca suits portfolios aiming for aggressive growth with a tolerance for operational leverage.
Biogen’s strategic moat emerges from its healthy balance sheet, marked by a high current ratio and low debt-to-equity, providing a safety cushion absent in AstraZeneca. Despite recent revenue headwinds, Biogen maintains steady cash flow yields, fitting well within Growth at a Reasonable Price (GARP) portfolios that prioritize stability alongside growth potential.
If you prioritize dynamic growth backed by a proven ability to create shareholder value, AstraZeneca outshines Biogen with its expanding profitability and market momentum. However, if you seek a more conservative profile with stronger liquidity and balance sheet stability, Biogen offers better stability despite its growth challenges and commands a more reasonable valuation premium. Both scenarios require careful risk assessment aligned with your investment horizon and tolerance.
Disclaimer: Investment carries a risk of loss of initial capital. The past performance is not a reliable indicator of future results. Be sure to understand risks before making an investment decision.
Go Further
I encourage you to read the complete analyses of AstraZeneca PLC and Biogen Inc. to enhance your investment decisions: