Home > Comparison > Healthcare > AZN vs AMGN
The strategic rivalry between AstraZeneca PLC and Amgen Inc. shapes the healthcare sector’s evolution. AstraZeneca operates as a global biopharmaceutical innovator with a broad product portfolio and extensive geographic reach. Amgen, a US-based biotechnology pioneer, focuses on human therapeutics with a streamlined operational model. This head-to-head contrasts global scale versus specialized innovation. This analysis will identify which corporate trajectory offers a superior risk-adjusted return for diversified investors.

Table of contents
Companies Overview
AstraZeneca and Amgen dominate the global biopharmaceutical landscape with distinct market footprints and strategic drives.
AstraZeneca: Global Oncology and Specialty Care Leader
AstraZeneca anchors its identity in biopharmaceutical innovation, focusing on cardiovascular, renal, metabolism, and oncology therapies. Its revenue stems from prescription medicines like Tagrisso and Imfinzi, targeting specialty care physicians worldwide. In 2026, AstraZeneca emphasizes AI-driven drug discovery collaborations, exemplifying a strategic pivot towards advanced technology integration.
Amgen: Therapeutics Powerhouse with Broad Disease Focus
Amgen defines itself through human therapeutics discovery and delivery, tackling inflammation, oncology, bone health, and cardiovascular diseases. Core revenues come from products like Enbrel and Neulasta, serving hospitals and clinics globally. In 2026, the company prioritizes joint development deals and expanding monoclonal antibody treatments, reinforcing its commitment to innovative autoimmune and cancer therapies.
Strategic Collision: Similarities & Divergences
Both companies pursue specialty drug innovation, yet AstraZeneca integrates AI partnerships more aggressively, while Amgen leans on collaborative clinical developments. Their primary battleground lies in oncology and autoimmune disease treatments, competing for physician and healthcare provider preference. AstraZeneca’s vast global reach contrasts with Amgen’s focused therapeutic portfolio, creating distinct investment profiles rooted in scale versus specialized innovation.
Income Statement Comparison
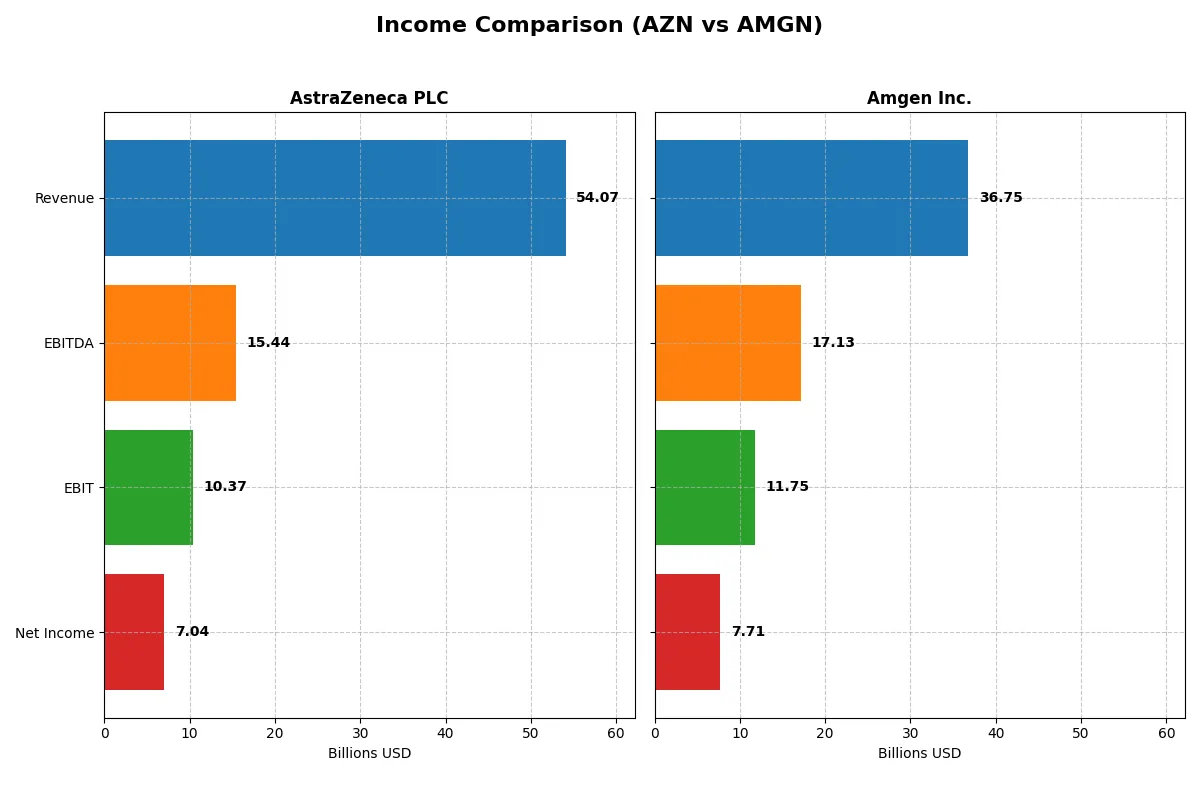
This data dissects the core profitability and scalability of both corporate engines to reveal who dominates the bottom line:
| Metric | AstraZeneca PLC (AZN) | Amgen Inc. (AMGN) |
|---|---|---|
| Revenue | 54B | 33.4B |
| Cost of Revenue | 10.2B | 12.9B |
| Operating Expenses | 33.9B | 13.3B |
| Gross Profit | 43.9B | 20.6B |
| EBITDA | 15.4B | 13.4B |
| EBIT | 10.4B | 7.8B |
| Interest Expense | 1.7B | 3.2B |
| Net Income | 7.0B | 4.1B |
| EPS | 1.14 | 7.62 |
| Fiscal Year | 2024 | 2024 |
Income Statement Analysis: The Bottom-Line Duel
This income statement comparison reveals how AstraZeneca and Amgen convert revenues into profits, exposing the true efficiency of their business models.
AstraZeneca PLC Analysis
AstraZeneca’s revenue surged from 26.6B in 2020 to 54.1B in 2024, doubling over five years. Net income followed suit, rising from 3.2B to 7.0B. Gross margins remain robust at 81.1%, with net margins steady near 13%. The 2024 performance shows strong revenue and EBIT growth, but EPS growth lags, indicating capital structure or share count impacts.
Amgen Inc. Analysis
Amgen grew revenue from 26.0B in 2021 to 36.8B in 2025, a solid 41% increase. Net income climbed from 5.9B to 7.7B, supported by a commanding gross margin of 82.5% and a superior net margin of 21.0%. The latest year highlights excellent EBIT and EPS growth, reflecting operational leverage and disciplined capital allocation despite higher interest expenses.
Margin Discipline vs. Earnings Momentum
AstraZeneca excels in margin stability and consistent revenue expansion, doubling sales in five years. Amgen offers stronger net margins and superior EPS momentum, reflecting efficient cost controls and leverage. Amgen’s profile suits investors prioritizing earnings growth, while AstraZeneca appeals to those valuing steady margin improvement and broad revenue scale.
Financial Ratios Comparison
These vital ratios act as a diagnostic tool to expose the underlying fiscal health, valuation premiums, and capital efficiency of the companies compared below:
| Ratios | AstraZeneca PLC (AZN) | Amgen Inc. (AMGN) |
|---|---|---|
| ROE | 17.25% | 89.06% |
| ROIC | 10.30% | 18.35% |
| P/E | 28.87 | 22.84 |
| P/B | 4.98 | 20.34 |
| Current Ratio | 0.93 | 1.14 |
| Quick Ratio | 0.74 | 0.90 |
| D/E | 0.74 | 6.31 |
| Debt-to-Assets | 28.95% | 60.28% |
| Interest Coverage | 5.95 | 5.41 |
| Asset Turnover | 0.52 | 0.41 |
| Fixed Asset Turnover | 4.64 | 4.64 |
| Payout ratio | 65.80% | 66.42% |
| Dividend yield | 2.28% | 2.91% |
| Fiscal Year | 2024 | 2025 |
Efficiency & Valuation Duel: The Vital Signs
Financial ratios serve as a company’s DNA, exposing hidden risks and operational strengths critical for investment analysis.
AstraZeneca PLC
AstraZeneca delivers solid profitability with a 17.25% ROE and a 13.01% net margin, signaling operational efficiency. Its valuation appears stretched, reflected by a high P/E of 28.87 and a P/B of 4.98. AstraZeneca supports shareholders through a 2.28% dividend yield, balancing growth investments with steady returns.
Amgen Inc.
Amgen outperforms on profitability with an exceptional 89.06% ROE and a 20.98% net margin, demonstrating strong capital efficiency. The stock trades at a neutral P/E of 22.84 but suffers from an expensive P/B of 20.34. Amgen maintains shareholder value via a 2.91% dividend yield while sustaining robust reinvestment in R&D.
Premium Valuation vs. Operational Safety
Amgen presents superior profitability and dividend yield but carries heavier leverage and valuation concerns. AstraZeneca offers more balanced leverage and operational safety, though at a higher relative price. Investors prioritizing growth may lean toward Amgen’s aggressive returns; conservative profiles may prefer AstraZeneca’s steadiness.
Which one offers the Superior Shareholder Reward?
I compare AstraZeneca PLC (AZN) and Amgen Inc. (AMGN) based on dividends and buybacks. AZN yields ~2.3% with a payout near 66%, backed by solid free cash flow coverage (~1.3x). AMGN offers a higher yield near 3%, with a similar payout ratio (~66%) and stronger free cash flow coverage (~1.4x). Both execute intense buybacks, but AMGN’s free cash flow per share ($15B+) far exceeds AZN’s ($2.3B), supporting more sustainable returns. Historically, AMGN’s higher margins and cash flow generation enable a more robust distribution strategy. For 2026, I favor AMGN for superior total shareholder reward due to its stronger capital allocation and higher yield sustainability.
Comparative Score Analysis: The Strategic Profile
The radar chart reveals the fundamental DNA and trade-offs of AstraZeneca PLC and Amgen Inc., highlighting their distinct financial strengths and vulnerabilities:
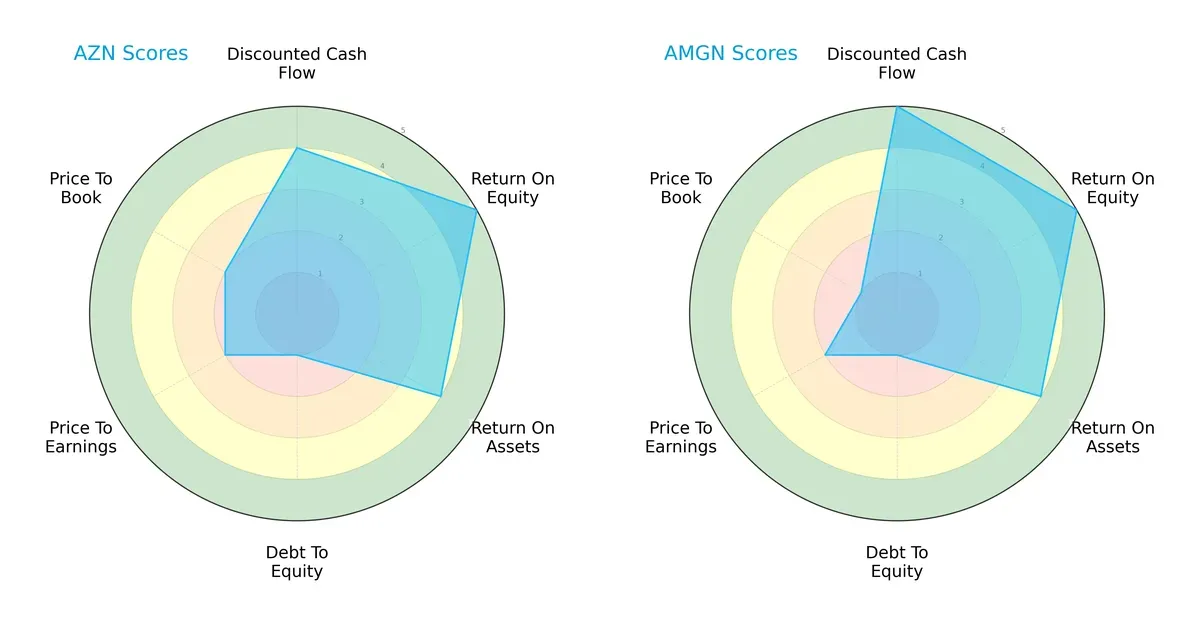
AstraZeneca and Amgen share equal overall scores (3) with strong ROE (5) and ROA (4) metrics, indicating efficient profit generation and asset use. Amgen edges out AstraZeneca in DCF (5 vs. 4) and price-to-book valuation (1 vs. 2), suggesting better cash flow valuation and bargain potential. Both face challenges in debt-to-equity (score 1), reflecting high leverage risk. AstraZeneca’s valuation metrics (PE and PB) are more moderate, while Amgen leans on its cash flow advantage, making AstraZeneca’s profile more balanced overall.
Bankruptcy Risk: Solvency Showdown
The Altman Z-Score difference signals varying solvency outlooks:
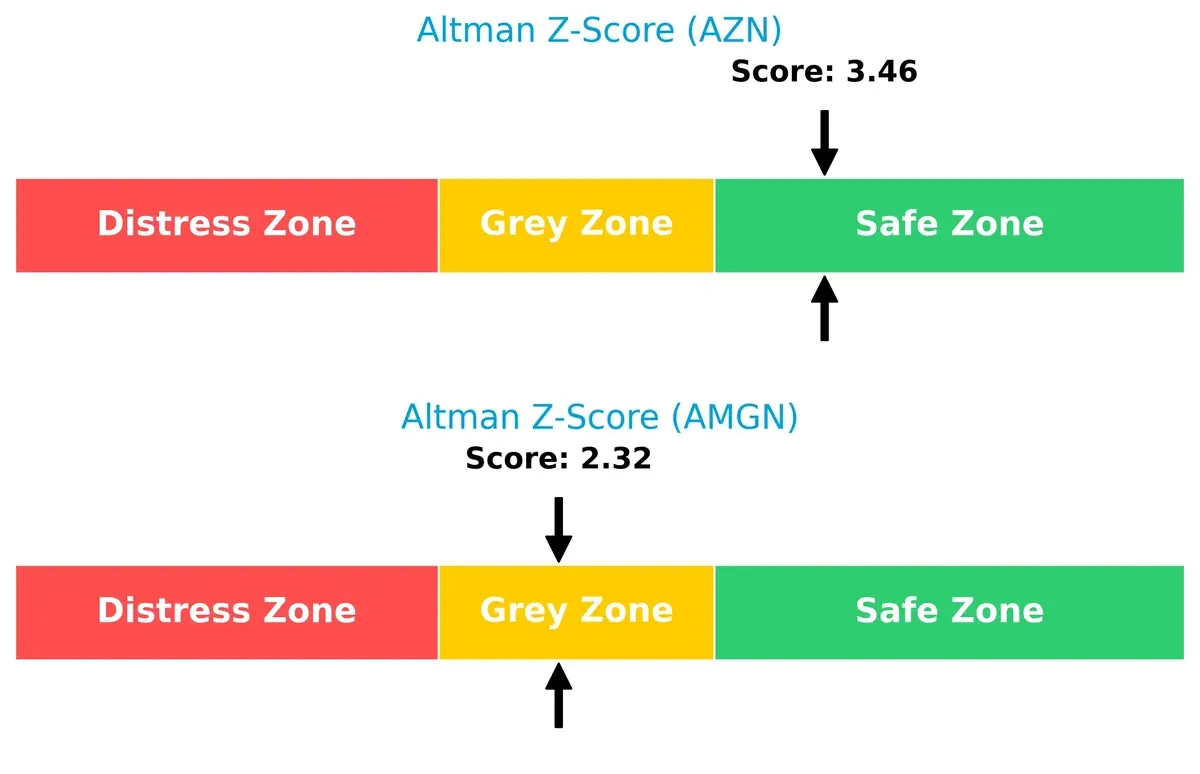
AstraZeneca’s Z-score of 3.46 places it comfortably in the safe zone, implying strong long-term survival potential. Amgen’s 2.32 falls in the grey zone, indicating moderate bankruptcy risk and more caution warranted amid economic cycles.
Financial Health: Quality of Operations
Piotroski F-Scores highlight operational robustness and internal financial quality:
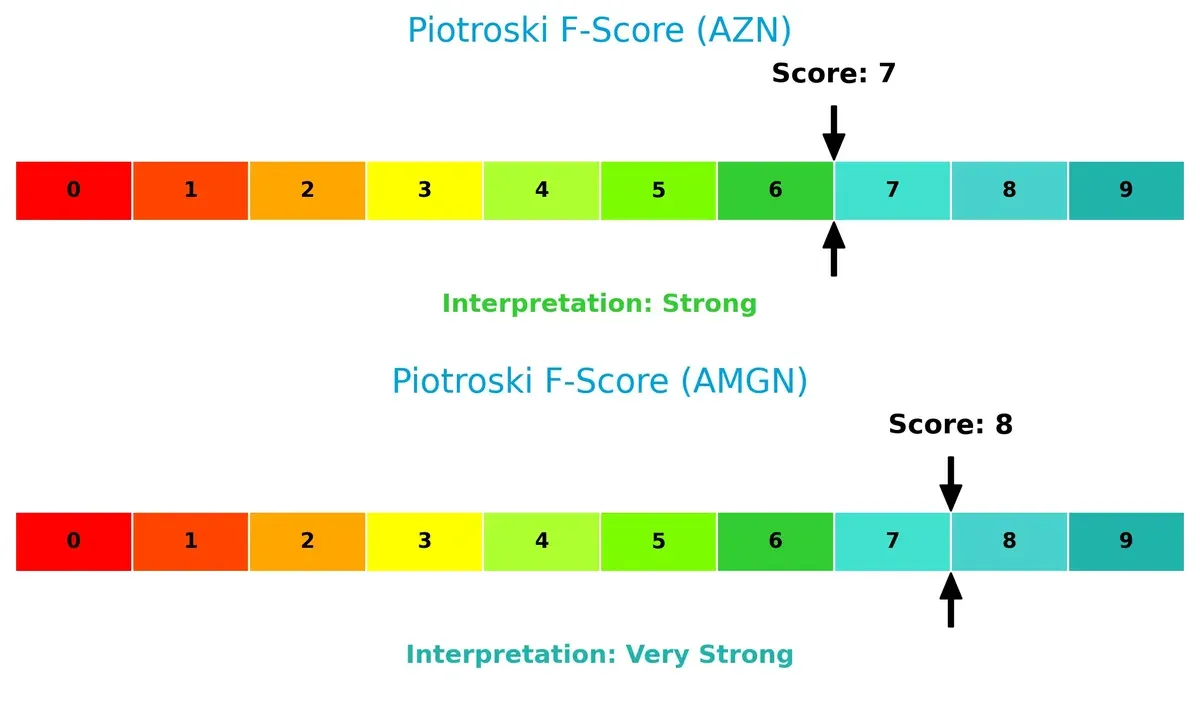
Amgen’s score of 8 signals very strong financial health with solid profitability and efficiency metrics. AstraZeneca’s 7, while strong, suggests marginally weaker internal fundamentals. Neither shows critical red flags, but Amgen’s internal metrics inspire greater confidence for value-conscious investors.
How are the two companies positioned?
This section dissects the operational DNA of AstraZeneca and Amgen by comparing their revenue distribution and internal dynamics, including strengths and weaknesses. The final goal is to confront their economic moats to identify which business model offers the most resilient and sustainable competitive advantage in today’s market.
Revenue Segmentation: The Strategic Mix
This visual comparison dissects how AstraZeneca PLC and Amgen Inc. diversify their income streams and where their primary sector bets lie:
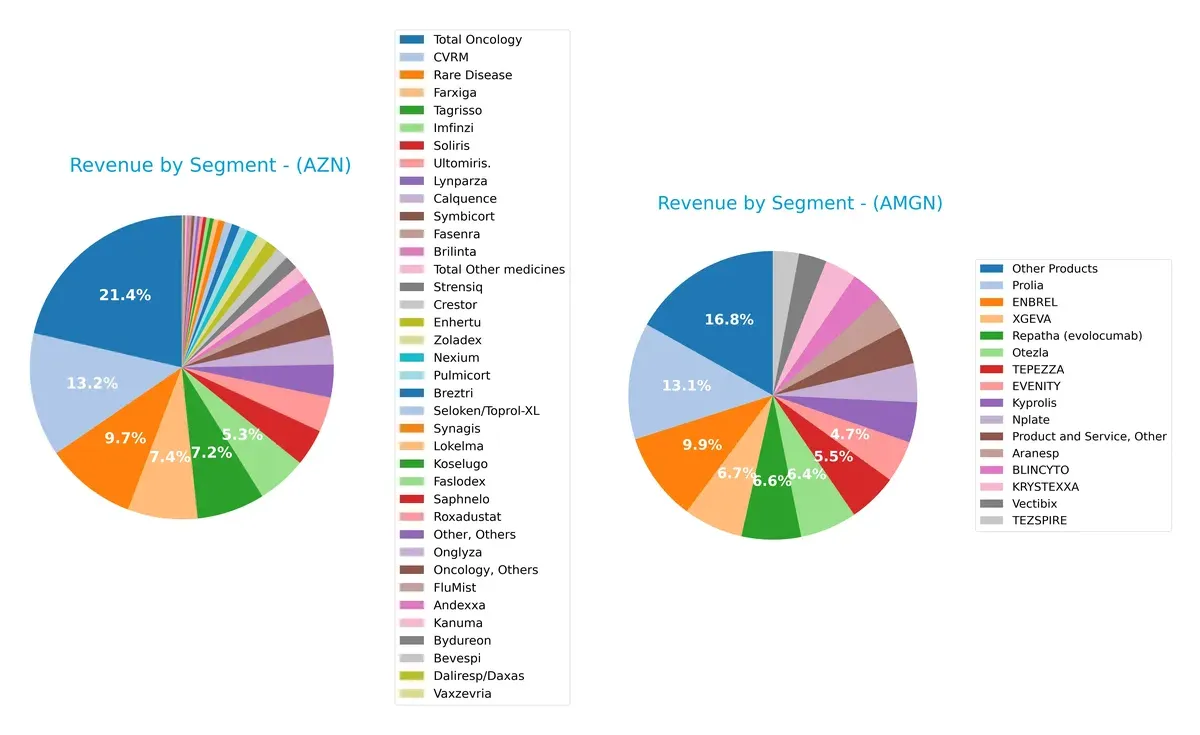
AstraZeneca pivots heavily on Oncology, which dwarfs other segments at $17.1B in 2023, anchoring its revenue mix. Its Rare Disease ($7.8B) and CVRM ($10.6B) segments add some diversification but still lean on specialty drugs. Amgen, meanwhile, showcases a more balanced portfolio with no single product exceeding $4.4B (Prolia), spreading risk across multiple biologics like ENBREL ($3.7B) and Otezla ($2.1B). AstraZeneca faces concentration risk; Amgen leverages broad therapeutic exposure.
Strengths and Weaknesses Comparison
This table compares the strengths and weaknesses of AstraZeneca PLC and Amgen Inc. based on key financial and strategic criteria:
AstraZeneca PLC Strengths
- Diverse product portfolio across oncology, cardiovascular, respiratory, and rare diseases
- Favorable profitability metrics: ROE 17.25%, ROIC 10.3%
- Lower debt-to-assets ratio at 29% indicating conservative leverage
- Strong interest coverage ratio of 6.17x
- Consistent dividend yield of 2.28%
- Efficient fixed asset turnover at 4.64
Amgen Inc. Strengths
- Higher net margin at 21% and strong ROE at 89% reflecting superior profitability
- Robust ROIC of 18.35% above WACC of 5.7% demonstrating value creation
- Solid dividend yield of 2.91%
- Larger scale with significant U.S. and Non-U.S. revenue streams
- Extensive product lineup with blockbuster drugs like ENBREL and Prolia
- Favorable fixed asset turnover at 4.64
AstraZeneca PLC Weaknesses
- Unfavorable valuation multiples with PE of 28.87 and PB of 4.98
- Current and quick ratios below 1 indicating potential liquidity concerns
- Moderate asset turnover at 0.52 limiting capital efficiency
- Neutral debt-to-equity ratio at 0.74, indicating moderate leverage
- Heavy reliance on oncology and CVRM segments may limit diversification
Amgen Inc. Weaknesses
- High debt-to-equity ratio at 6.31 and debt-to-assets at 60% signaling elevated leverage risk
- Lower interest coverage ratio at 4.27x raising financial risk
- Unfavorable asset turnover at 0.41 indicating less efficient asset use
- Elevated PB ratio of 20.34 suggesting expensive valuation
- Neutral to slightly unfavorable liquidity ratios (current 1.14, quick 0.9)
Overall, AstraZeneca demonstrates a broad product diversification and prudent leverage but faces liquidity and valuation challenges. Amgen excels in profitability and scale but carries higher financial risk due to elevated leverage and valuation premiums. This contrast shapes each company’s strategic financial management and risk profile.
The Moat Duel: Analyzing Competitive Defensibility
A structural moat is the only barrier protecting long-term profits from relentless competition and market forces. Let’s dissect the moats of two pharma giants:
AstraZeneca PLC: Intangible Assets Powerhouse
AstraZeneca’s moat hinges on patented drugs and R&D prowess, reflected in a strong 5.57% ROIC premium over WACC and margin stability. Expansion into AI-driven drug discovery in 2026 could deepen this intangible moat.
Amgen Inc.: Cost Advantage and Scale Dominance
Amgen leverages scale and efficient capital allocation, boasting a 12.65% ROIC premium over WACC, nearly double AstraZeneca’s, with expanding margins. Its US-heavy footprint and pipeline collaborations fuel sustained growth and cost leadership.
Intangible Assets vs. Scale Efficiency: Moat Strength Showdown
Amgen’s wider moat stems from superior ROIC spread and operational scale, driving higher profitability than AstraZeneca’s intangible asset moat. I see Amgen better positioned to defend and expand market share amidst evolving healthcare dynamics.
Which stock offers better returns?
AstraZeneca and Amgen both display strong price gains over the past year, with noticeable acceleration in their upward trends and significant trading volume dynamics.
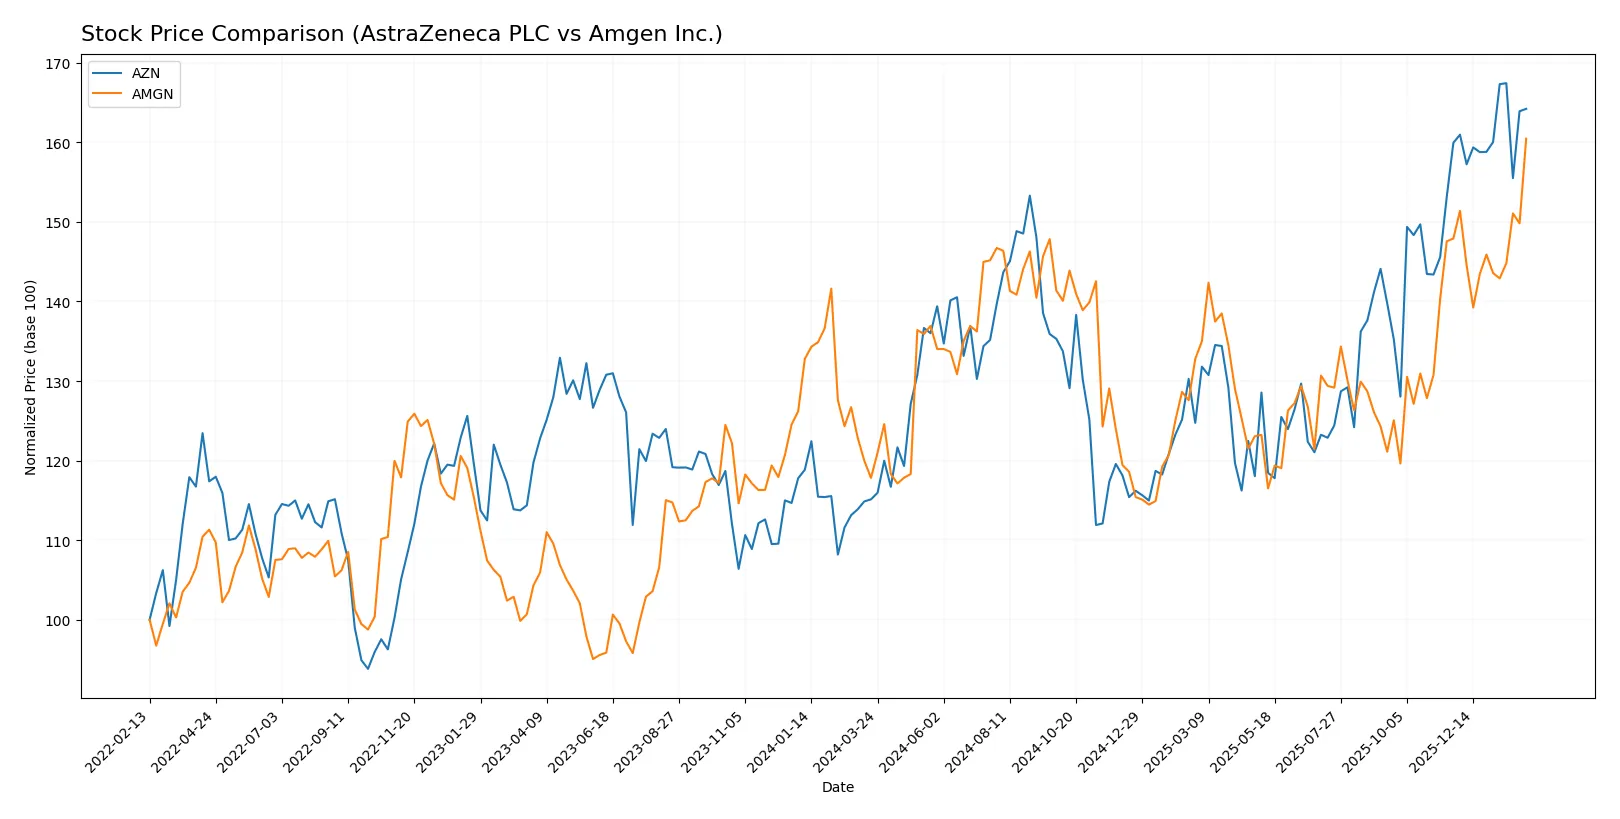
Trend Comparison
AstraZeneca’s stock rose 42.63% over the past 12 months, showing a bullish trend with accelerating momentum and a high of 191.13. Volatility remained moderate with a standard deviation of 16.26.
Amgen’s stock increased 36.2% over the same period, also bullish with accelerating gains. It reached a peak at 366.2 but showed higher volatility, reflected in a 23.79 standard deviation.
AstraZeneca outperformed Amgen with a higher total return of 42.63% versus 36.2%, both exhibiting accelerating bullish trends and increased trading volumes.
Target Prices
Analyst consensus shows varied expectations for AstraZeneca and Amgen, reflecting differing outlooks in the biopharma sector.
| Company | Target Low | Target High | Consensus |
|---|---|---|---|
| AstraZeneca PLC | 103 | 108 | 105.5 |
| Amgen Inc. | 309 | 425 | 364.09 |
AstraZeneca’s target consensus at 105.5 is substantially below its current price near 187, signaling bearish analyst views. Amgen’s consensus target of 364 aligns closely with its current 366 price, indicating a stable outlook.

Don’t Let Luck Decide Your Entry Point
Optimize your entry points with our advanced ProRealTime indicators. You’ll get efficient buy signals with precise price targets for maximum performance. Start outperforming now!
How do institutions grade them?
AstraZeneca PLC Grades
The table below shows recent institutional grades for AstraZeneca PLC:
| Grading Company | Action | New Grade | Date |
|---|---|---|---|
| UBS | Upgrade | Buy | 2025-02-13 |
| UBS | Upgrade | Neutral | 2024-11-20 |
| Erste Group | Upgrade | Buy | 2024-09-11 |
| TD Cowen | Maintain | Buy | 2024-08-12 |
| Argus Research | Maintain | Buy | 2024-05-30 |
| BMO Capital | Maintain | Outperform | 2024-04-26 |
| Deutsche Bank | Upgrade | Hold | 2024-04-16 |
| BMO Capital | Maintain | Outperform | 2024-02-12 |
| Deutsche Bank | Downgrade | Hold | 2024-02-08 |
| Jefferies | Downgrade | Hold | 2024-01-03 |
Amgen Inc. Grades
The table below shows recent institutional grades for Amgen Inc.:
| Grading Company | Action | New Grade | Date |
|---|---|---|---|
| Morgan Stanley | Maintain | Equal Weight | 2026-02-04 |
| Leerink Partners | Maintain | Outperform | 2026-02-04 |
| Citigroup | Maintain | Neutral | 2026-02-04 |
| Cantor Fitzgerald | Maintain | Neutral | 2026-02-04 |
| UBS | Maintain | Buy | 2026-01-26 |
| Bernstein | Downgrade | Market Perform | 2026-01-20 |
| Truist Securities | Maintain | Hold | 2026-01-08 |
| Morgan Stanley | Maintain | Equal Weight | 2025-12-12 |
| Wells Fargo | Maintain | Equal Weight | 2025-12-10 |
| BMO Capital | Maintain | Outperform | 2025-12-03 |
Which company has the best grades?
AstraZeneca shows a trend of upgrades culminating in multiple Buy and Outperform ratings. Amgen maintains mixed ratings, mostly Equal Weight and Neutral, with some Outperform and Buy. AstraZeneca’s stronger grades suggest more institutional confidence, potentially influencing investor sentiment positively.
Risks specific to each company
The following categories identify the critical pressure points and systemic threats facing both firms in the 2026 market environment:
1. Market & Competition
AstraZeneca PLC
- Faces intense competition in oncology and rare diseases; innovation pace critical to maintain market share.
Amgen Inc.
- Strong in inflammation and hematology; must defend against biosimilars and emerging biotech rivals.
2. Capital Structure & Debt
AstraZeneca PLC
- Moderate debt-to-equity ratio (0.74) reflects balanced leverage; interest coverage solid at 6.17x.
Amgen Inc.
- High debt-to-equity (6.31) and debt-to-assets (60.28%) ratios increase financial risk despite adequate interest coverage.
3. Stock Volatility
AstraZeneca PLC
- Very low beta (0.192) suggests defensive stock with limited price swings.
Amgen Inc.
- Moderate beta (0.472) indicates higher sensitivity to market moves and sector volatility.
4. Regulatory & Legal
AstraZeneca PLC
- Global regulatory approvals and patent expirations remain key risks in a heavily regulated environment.
Amgen Inc.
- Faces patent cliffs and regulatory scrutiny in multiple therapeutic areas, requiring robust compliance frameworks.
5. Supply Chain & Operations
AstraZeneca PLC
- Extensive global footprint exposes it to operational disruptions but benefits from diversified manufacturing.
Amgen Inc.
- Supply chain concentrated in the US; potential vulnerability to domestic disruptions and cost pressures.
6. ESG & Climate Transition
AstraZeneca PLC
- Strong ESG commitments linked to climate targets; transition risks mitigated by innovation in sustainable practices.
Amgen Inc.
- ESG initiatives advancing, but higher debt levels may pressure capital allocation towards climate investments.
7. Geopolitical Exposure
AstraZeneca PLC
- Significant exposure to Europe, Asia, and emerging markets increases geopolitical risk but diversifies revenue.
Amgen Inc.
- Primarily US-based operations limit geopolitical risk but also reduce geographic diversification.
Which company shows a better risk-adjusted profile?
AstraZeneca’s moderate leverage, low stock volatility, and global diversification underpin a more balanced risk profile. Amgen’s higher debt load and concentrated US operations elevate financial and operational risks despite strong profitability. AstraZeneca’s Altman Z-score in the safe zone (3.46) contrasts with Amgen’s grey zone (2.32), signaling greater financial stability. AstraZeneca’s lower beta (0.19 vs. 0.47) also underscores its defensive market position. The key risk for AstraZeneca lies in patent expirations and regulatory pressures, while Amgen’s largest concern is its elevated leverage compromising financial flexibility. The data reveals AstraZeneca maintains a sturdier risk-adjusted footing amid 2026’s complex healthcare landscape.
Final Verdict: Which stock to choose?
AstraZeneca’s superpower lies in its consistent value creation, driven by a rising ROIC well above its cost of capital. Its aggressive investment in R&D fuels innovation, but a suboptimal liquidity position remains a point of vigilance. It fits best in a growth-focused portfolio willing to tolerate short-term cash cycle pressures.
Amgen commands a strategic moat through robust returns and operational efficiency, highlighted by exceptional ROE and free cash flow yields. It offers comparatively better liquidity and a stronger cash conversion cycle, providing a safer harbor amid market volatility. It suits investors favoring growth at a reasonable price with a margin of safety.
If you prioritize sustained value creation and innovation-led growth, AstraZeneca is the compelling choice due to its superior capital efficiency and expanding profitability. However, if you seek better financial stability and cash flow reliability, Amgen offers superior resilience and a more conservative risk profile. Both companies have their merits, demanding alignment with specific investor risk tolerances.
Disclaimer: Investment carries a risk of loss of initial capital. The past performance is not a reliable indicator of future results. Be sure to understand risks before making an investment decision.
Go Further
I encourage you to read the complete analyses of AstraZeneca PLC and Amgen Inc. to enhance your investment decisions: