Astera Labs, Inc. (ALAB) and Tower Semiconductor Ltd. (TSEM) are two influential players in the semiconductor industry, each driving innovation in connectivity and mixed-signal device manufacturing. While Astera Labs focuses on cutting-edge AI and cloud infrastructure solutions, Tower Semiconductor offers diverse process technologies across multiple markets. This article will explore their strengths and risks to help you identify the most compelling investment opportunity in 2026.
Table of contents
Companies Overview
I will begin the comparison between Astera Labs and Tower Semiconductor by providing an overview of these two companies and their main differences.
Astera Labs Overview
Astera Labs, Inc. focuses on designing and manufacturing semiconductor-based connectivity solutions tailored for cloud and AI infrastructure. Its Intelligent Connectivity Platform includes data, network, and memory connectivity products built on a software-defined architecture, enabling scalable high-performance cloud operations. Founded in 2017, the company is headquartered in Santa Clara, CA, and trades on NASDAQ with a market cap around 29.5B USD.
Tower Semiconductor Overview
Tower Semiconductor Ltd. is an independent foundry specializing in analog intensive mixed-signal semiconductor devices. It offers a broad range of customizable process technologies, including SiGe, BiCMOS, RF CMOS, and MEMS, serving diverse markets such as consumer electronics, automotive, aerospace, and medical devices. Incorporated in 1993 and based in Migdal Haemek, Israel, Tower has a market cap near 13.9B USD and is also listed on NASDAQ.
Key similarities and differences
Both companies operate in the semiconductor industry, but Astera Labs focuses on connectivity solutions for cloud and AI infrastructure, while Tower Semiconductor provides foundry services and process technologies for a wider range of analog and mixed-signal applications. Astera Labs is younger with a smaller workforce, emphasizing software-defined architectures, whereas Tower has a longer history and broader market reach across multiple sectors.
Income Statement Comparison
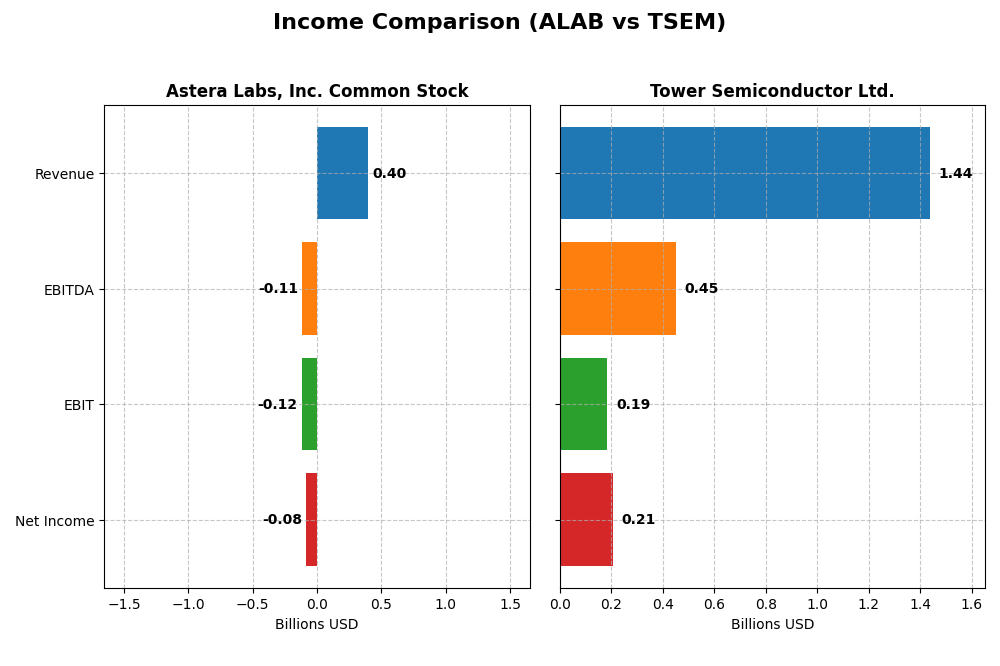
This table presents a side-by-side comparison of key income statement metrics for Astera Labs, Inc. (ALAB) and Tower Semiconductor Ltd. (TSEM) for the fiscal year 2024.
| Metric | Astera Labs, Inc. Common Stock (ALAB) | Tower Semiconductor Ltd. (TSEM) |
|---|---|---|
| Market Cap | 29.5B USD | 13.9B USD |
| Revenue | 396M USD | 1.44B USD |
| EBITDA | -113M USD | 451M USD |
| EBIT | -116M USD | 185M USD |
| Net Income | -83.4M USD | 208M USD |
| EPS | -0.64 USD | 1.87 USD |
| Fiscal Year | 2024 | 2024 |
Income Statement Interpretations
Astera Labs, Inc. Common Stock
Astera Labs experienced strong revenue growth from $79.9M in 2022 to $396.3M in 2024, a 396% increase, but net income remained negative, widening from -$58.3M to -$83.4M. Gross margin held favorably high at 76.4%, while EBIT and net margins stayed negative. The latest year saw revenue growth slow but margins improve slightly, reflecting ongoing investment costs.
Tower Semiconductor Ltd.
Tower Semiconductor’s revenue rose moderately from $1.27B in 2020 to $1.44B in 2024, with net income increasing significantly from $82.3M to $208M. Margins remained positive and stable, with gross margin around 23.6% and net margin at 14.5%. However, recent performance shows a decline in year-over-year growth and margins, indicating short-term pressure despite overall profitability.
Which one has the stronger fundamentals?
Tower Semiconductor demonstrates stronger fundamentals with consistent profitability, positive net margins, and significant net income growth over five years. Astera Labs shows rapid revenue expansion but persistent net losses and unfavorable EBIT margins. While Astera’s gross margins are higher, Tower’s overall profitability and positive income trends suggest a more stable income statement profile.
Financial Ratios Comparison
The table below compares the key financial ratios of Astera Labs, Inc. (ALAB) and Tower Semiconductor Ltd. (TSEM) for the fiscal year 2024, providing a snapshot of their profitability, liquidity, leverage, and operational efficiency.
| Ratios | Astera Labs, Inc. (ALAB) | Tower Semiconductor Ltd. (TSEM) |
|---|---|---|
| ROE | -8.65% | 7.83% |
| ROIC | -12.0% | 6.41% |
| P/E | -208.4 | 27.54 |
| P/B | 18.02 | 2.16 |
| Current Ratio | 11.71 | 6.18 |
| Quick Ratio | 11.21 | 5.23 |
| D/E (Debt-to-Equity) | 0.0013 | 0.0681 |
| Debt-to-Assets | 0.12% | 5.87% |
| Interest Coverage | 0 | 32.64 |
| Asset Turnover | 0.38 | 0.47 |
| Fixed Asset Turnover | 11.12 | 1.11 |
| Payout Ratio | 0 | 0 |
| Dividend Yield | 0 | 0 |
Interpretation of the Ratios
Astera Labs, Inc. Common Stock
Astera Labs displays predominantly unfavorable ratios, including negative net margin (-21.05%) and return on equity (-8.65%), suggesting profitability and efficiency challenges. Its high price-to-book ratio (18.02) and elevated current ratio (11.71) raise concerns about valuation and asset utilization. No dividends are paid, likely reflecting its reinvestment focus amid negative returns and growth phase.
Tower Semiconductor Ltd.
Tower Semiconductor shows a mixed ratio profile with a positive net margin (14.47%) and strong interest coverage (31.57), indicating solid operational performance and debt management. However, its return on equity (7.83%) and EV/EBITDA multiples are less impressive, with some neutral metrics like price-to-book (2.16). The company does not pay dividends, possibly prioritizing R&D and growth investments.
Which one has the best ratios?
Tower Semiconductor holds a more favorable overall ratio evaluation with 42.86% favorable ratios versus Astera Labs’ 35.71%. While Astera Labs struggles with profitability and asset efficiency, Tower Semiconductor’s stronger margins and coverage ratios suggest comparatively better financial health. Nonetheless, both companies have notable weaknesses requiring attention.
Strategic Positioning
This section compares the strategic positioning of Astera Labs, Inc. (ALAB) and Tower Semiconductor Ltd. (TSEM), covering Market position, Key segments, and Exposure to technological disruption:
Astera Labs, Inc. (ALAB)
- Smaller market cap (~29.5B USD), faces competitive pressure in cloud and AI connectivity solutions.
- Focused on semiconductor-based connectivity for cloud and AI infrastructure, with products and software-defined architecture.
- Exposure to disruption via evolving cloud and AI infrastructure demands requiring innovation in connectivity.
Tower Semiconductor Ltd. (TSEM)
- Mid-size market cap (~13.9B USD), operates in a competitive foundry market globally.
- Specializes in analog mixed-signal semiconductors and wafer fabrication services across multiple industries.
- Faces disruption from rapid semiconductor process technology changes and diverse industry requirements.
ALAB vs TSEM Positioning
ALAB pursues a concentrated strategy specializing in AI and cloud connectivity, which offers focused innovation but narrower market scope. TSEM adopts a diversified foundry approach serving multiple sectors, diversifying risk but facing broader competitive challenges.
Which has the best competitive advantage?
Both companies show slightly unfavorable MOAT evaluations due to ROIC below WACC but have improving profitability trends. Neither currently demonstrates a strong sustainable competitive advantage based on the available MOAT data.
Stock Comparison
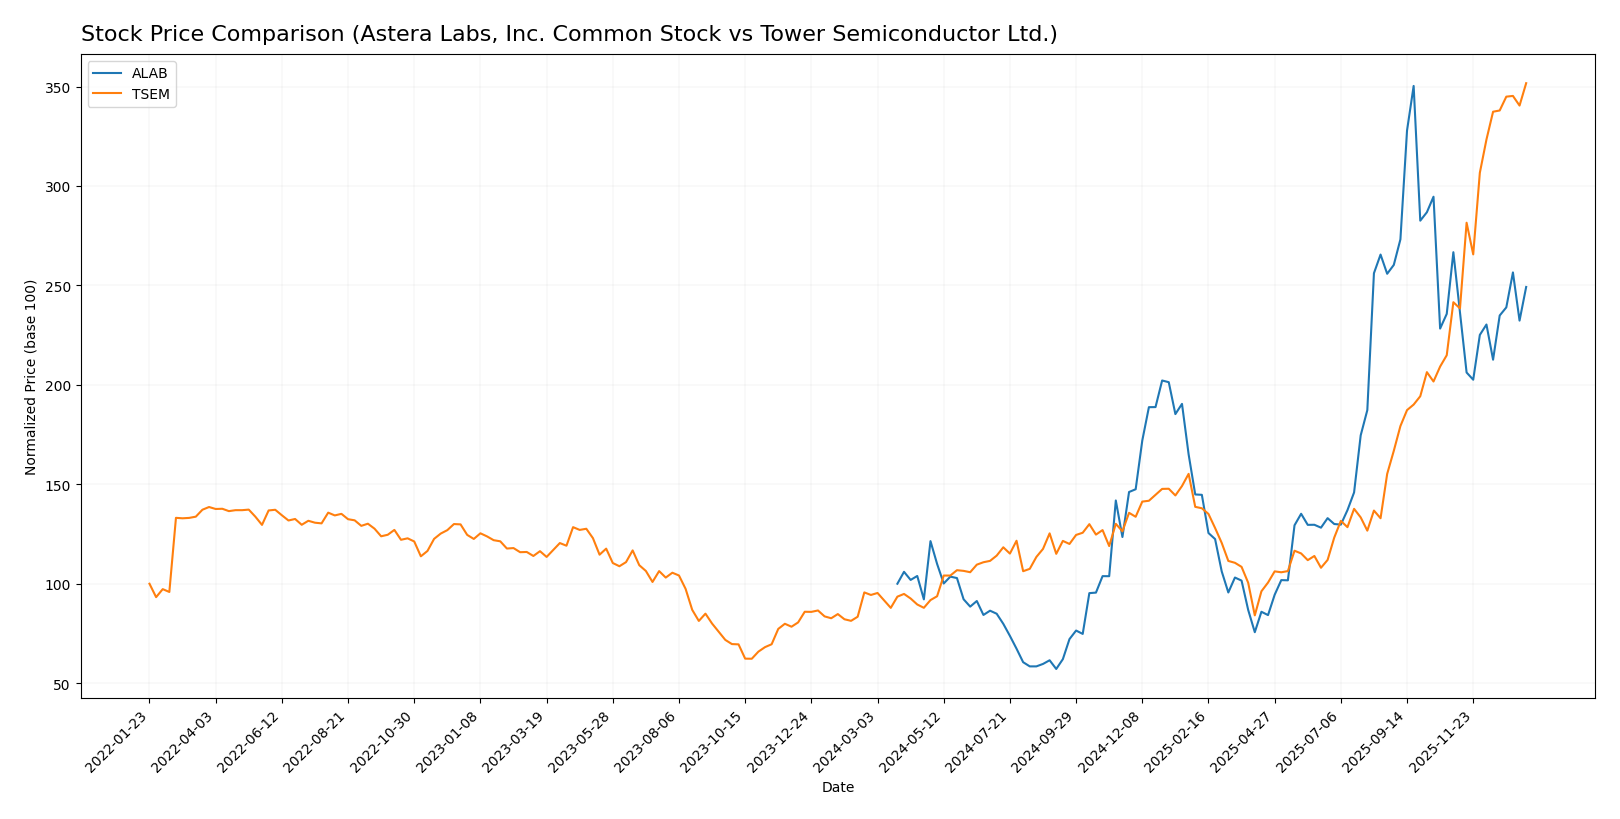
The stock price movements of Astera Labs, Inc. Common Stock (ALAB) and Tower Semiconductor Ltd. (TSEM) over the past 12 months reveal significant bullish trends with contrasting recent momentum and volume dynamics.
Trend Analysis
Astera Labs, Inc. (ALAB) exhibited a strong bullish trend over the past year with a 149.21% price increase, though recent months show a slight bearish reversal of -6.55%, accompanied by decelerating momentum and moderate volatility (std deviation 50.14).
Tower Semiconductor Ltd. (TSEM) showed a pronounced bullish trend with a 272.71% gain over the past year, supported by accelerating momentum and a recent strong upward move of 45.59%, alongside lower volatility (std deviation 23.67) compared to ALAB.
Comparing the two, TSEM delivered the highest market performance with a greater overall price appreciation and recent strong buyer dominance, outperforming ALAB in both trend strength and recent price acceleration.
Target Prices
The current analyst consensus indicates moderate upside potential for these semiconductor companies.
| Company | Target High | Target Low | Consensus |
|---|---|---|---|
| Astera Labs, Inc. Common Stock | 225 | 165 | 202.14 |
| Tower Semiconductor Ltd. | 125 | 66 | 96 |
Astera Labs shows a consensus target about 16% above its current price of 174.45 USD, while Tower Semiconductor’s consensus target is slightly below its current price of 124 USD, suggesting mixed near-term outlooks.
Analyst Opinions Comparison
This section compares analysts’ ratings and grades for Astera Labs, Inc. Common Stock (ALAB) and Tower Semiconductor Ltd. (TSEM):
Rating Comparison
ALAB Rating
- Rating: B, classified as Very Favorable overall rating.
- Discounted Cash Flow Score: 1, rated Very Unfavorable, indicating concerns about valuation.
- Return on Equity Score: 4, Favorable, showing efficient profit generation from equity.
- Return on Assets Score: 5, Very Favorable, demonstrating excellent asset utilization.
- Debt To Equity Score: 4, Favorable, suggesting a relatively strong balance sheet.
- Overall Score: 3, Moderate, summarizing a balanced but cautious financial standing.
TSEM Rating
- Rating: B+, also classified as Very Favorable overall rating.
- Discounted Cash Flow Score: 3, Moderate rating, suggesting a more balanced valuation outlook.
- Return on Equity Score: 3, Moderate, indicating average efficiency in generating equity profits.
- Return on Assets Score: 4, Favorable, reflecting good asset utilization.
- Debt To Equity Score: 4, Favorable, indicating similar financial stability.
- Overall Score: 3, Moderate, reflecting comparable overall financial health.
Which one is the best rated?
Based strictly on the provided data, TSEM holds a slightly better rating (B+) compared to ALAB’s B. TSEM also scores higher on discounted cash flow but slightly lower on return on equity and assets. Both share the same overall moderate score.
Scores Comparison
Here is a comparison of the Altman Z-Score and Piotroski Score for both companies:
ALAB Scores
- Altman Z-Score: 137, indicating a safe zone, very low bankruptcy risk.
- Piotroski Score: 6, reflecting average financial strength.
TSEM Scores
- Altman Z-Score: 21, indicating a safe zone with low bankruptcy risk.
- Piotroski Score: 7, indicating strong financial health.
Which company has the best scores?
TSEM holds a strong Piotroski Score of 7 compared to ALAB’s average 6, while both have Altman Z-Scores in the safe zone. TSEM shows slightly stronger financial health based on these metrics.
Grades Comparison
The following analysis compares the recent grades and rating trends of Astera Labs, Inc. Common Stock and Tower Semiconductor Ltd.:
Astera Labs, Inc. Common Stock Grades
Here are the latest grades and actions from notable grading companies for Astera Labs, Inc.:
| Grading Company | Action | New Grade | Date |
|---|---|---|---|
| Northland Capital Markets | Maintain | Outperform | 2025-12-09 |
| Northland Capital Markets | Upgrade | Outperform | 2025-11-17 |
| Stifel | Maintain | Buy | 2025-11-05 |
| Morgan Stanley | Maintain | Overweight | 2025-11-05 |
| Roth Capital | Maintain | Buy | 2025-11-05 |
| Needham | Maintain | Buy | 2025-11-05 |
| JP Morgan | Maintain | Overweight | 2025-11-05 |
| TD Cowen | Maintain | Hold | 2025-11-05 |
| Barclays | Downgrade | Equal Weight | 2025-10-20 |
| Stifel | Maintain | Buy | 2025-10-17 |
Astera Labs shows a strong buy and outperform trend, with a minor downgrade from Barclays to equal weight noted in October 2025.
Tower Semiconductor Ltd. Grades
Below are the recent grades and recommendations from established grading firms for Tower Semiconductor Ltd.:
| Grading Company | Action | New Grade | Date |
|---|---|---|---|
| Benchmark | Maintain | Buy | 2026-01-09 |
| Wedbush | Downgrade | Neutral | 2025-12-31 |
| Benchmark | Maintain | Buy | 2025-11-11 |
| Susquehanna | Maintain | Positive | 2025-11-11 |
| Wedbush | Maintain | Outperform | 2025-11-11 |
| Barclays | Maintain | Equal Weight | 2025-11-11 |
| Benchmark | Maintain | Buy | 2025-09-08 |
| Susquehanna | Maintain | Positive | 2025-08-05 |
| Benchmark | Maintain | Buy | 2025-08-05 |
| Benchmark | Maintain | Buy | 2025-08-04 |
Tower Semiconductor maintains predominantly buy and positive ratings, although Wedbush downgraded it to neutral at the end of 2025.
Which company has the best grades?
Both companies have a consensus rating of “Buy” with multiple buy and outperform grades. Astera Labs exhibits a stronger recent upgrade trend and fewer downgrades, potentially indicating more positive analyst sentiment, which may influence investor confidence differently compared to Tower Semiconductor’s mixed but stable ratings.
Strengths and Weaknesses
Below is a comparison of key strengths and weaknesses for Astera Labs, Inc. Common Stock (ALAB) and Tower Semiconductor Ltd. (TSEM) based on the most recent data available for 2024-2026.
| Criterion | Astera Labs, Inc. (ALAB) | Tower Semiconductor Ltd. (TSEM) |
|---|---|---|
| Diversification | Moderate, mainly Product segment (393M USD) with minor Technology Service | Information not disclosed, likely focused |
| Profitability | Negative net margin (-21.05%), ROIC -11.97%, value destroying but improving | Positive net margin (14.47%), ROIC 6.41%, slightly favorable profitability trend |
| Innovation | High ROIC growth trend (+65.5%), indicating improving operational efficiency | Growing ROIC trend (+44.6%), reflecting ongoing innovation and efficiency gains |
| Global presence | Limited data, with strong fixed asset turnover (11.12) indicating operational intensity | Established global footprint with strong interest coverage (31.57) and moderate debt |
| Market Share | Challenged, as indicated by high PB ratio (18.02) and unfavorable valuation metrics | Stable market position with reasonable P/B (2.16) and P/E (27.54) ratios |
Key takeaways: Astera Labs shows rapid improvement in operational efficiency but suffers from current value destruction and profitability challenges. Tower Semiconductor presents a more balanced profile with positive profitability and financial stability, making it a slightly more favorable choice for investors seeking moderate risk.
Risk Analysis
Below is a comparative table of key risks for Astera Labs, Inc. (ALAB) and Tower Semiconductor Ltd. (TSEM) based on the latest 2024 data:
| Metric | Astera Labs, Inc. (ALAB) | Tower Semiconductor Ltd. (TSEM) |
|---|---|---|
| Market Risk | High beta (1.51) indicates above-average volatility | Moderate beta (0.88), less volatile than ALAB |
| Debt level | Very low debt (D/E = 0.0), minimal financial leverage | Low debt (D/E = 0.07), financially stable |
| Regulatory Risk | US-based, exposed to evolving semiconductor regulations and trade policies | Israel-based, exposed to US, EU, and Asia semiconductor regulations |
| Operational Risk | Smaller employee base (440), higher risk scaling operations | Larger workforce (5613), more diversified operations, lower scaling risk |
| Environmental Risk | Moderate, semiconductor manufacturing impact not fully disclosed | Moderate, with diverse manufacturing locations increasing complexity |
| Geopolitical Risk | US-centric, moderate geopolitical exposure | Higher geopolitical exposure due to Israel location and international markets |
Astera Labs faces the most impactful risks from market volatility and operational scaling challenges given its smaller size and high beta. Tower Semiconductor’s main risks lie in geopolitical tensions and regulatory complexities due to its Israeli base and global footprint. Both maintain low debt, reducing financial risk, but investors should monitor geopolitical and market environment shifts closely.
Which Stock to Choose?
Astera Labs, Inc. Common Stock (ALAB) shows strong revenue growth of 242% in 2024 but suffers from negative profitability ratios including a -21.05% net margin and -8.65% ROE. The company carries low debt and a very high current ratio but has an unfavorable global financial ratios evaluation and a slightly unfavorable economic moat due to ROIC below WACC.
Tower Semiconductor Ltd. (TSEM) displays moderate revenue growth of 0.94% in 2024 with a positive net margin of 14.47% and a 7.83% ROE. It has favorable debt metrics, solid income quality, and a slightly favorable overall financial ratios rating. The company’s moat evaluation also indicates value destruction but with improving profitability and a strong Piotroski score.
For investors prioritizing growth potential, ALAB’s rapid revenue expansion and improving profitability might appear attractive despite current losses and financial risks. Conversely, TSEM’s consistent profitability, stronger financial health, and favorable rating may appeal to more risk-averse or quality-focused investors seeking stability. Both companies show signs of value destruction but with growing profitability, suggesting cautious consideration aligned with individual risk tolerance and investment strategy.
Disclaimer: Investment carries a risk of loss of initial capital. The past performance is not a reliable indicator of future results. Be sure to understand risks before making an investment decision.
Go Further
I encourage you to read the complete analyses of Astera Labs, Inc. Common Stock and Tower Semiconductor Ltd. to enhance your investment decisions: