Home > Comparison > Technology > TXN vs ALAB
The strategic rivalry between Texas Instruments and Astera Labs shapes the semiconductor sector’s future. Texas Instruments operates as a capital-intensive industrial giant, delivering analog and embedded processing solutions worldwide. In contrast, Astera Labs, a nimble innovator, focuses on high-performance connectivity for cloud and AI infrastructure. This analysis pits established scale against cutting-edge growth to identify which company offers the superior risk-adjusted return for a diversified portfolio in 2026.
Table of contents
Companies Overview
Texas Instruments and Astera Labs represent two powerful forces in the semiconductor industry, each shaping critical technology sectors.
Texas Instruments Incorporated: Analog and Embedded Processing Leader
Texas Instruments dominates the semiconductor market with a diverse revenue base split between Analog and Embedded Processing segments. It generates steady cash flow by selling power management and signal processing chips to broad industrial, automotive, and consumer electronics markets. In 2026, TI’s strategic focus remains on enhancing its analog portfolio to sustain its competitive advantage in power and sensing solutions globally.
Astera Labs, Inc. Common Stock: Cloud and AI Connectivity Innovator
Astera Labs positions itself as a cutting-edge provider of semiconductor connectivity solutions tailored for cloud and AI infrastructure. Its Intelligent Connectivity Platform integrates data, network, and memory products with a software-defined architecture. The company’s 2026 strategy emphasizes scaling its platform to capture growing demand in high-performance cloud computing environments, leveraging rapid innovation to challenge established players.
Strategic Collision: Similarities & Divergences
Texas Instruments relies on a broad, mature analog and embedded product portfolio, while Astera Labs pursues a niche, software-driven connectivity approach. Their primary battleground lies in the expanding cloud and AI infrastructure market, where performance and scalability are paramount. TI offers stability and scale, whereas Astera Labs presents high growth potential but with elevated execution risk, reflecting distinct investment profiles.
Income Statement Comparison
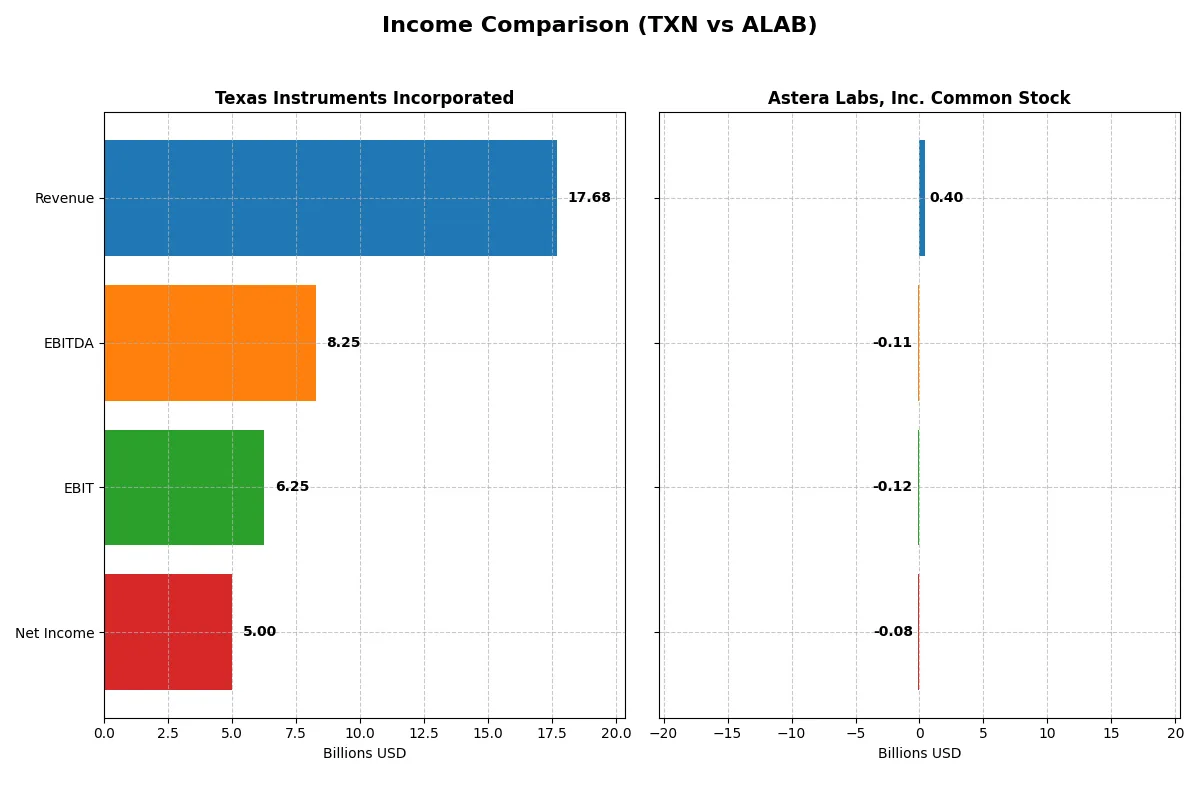
This data dissects the core profitability and scalability of both corporate engines to reveal who dominates the bottom line:
| Metric | Texas Instruments Incorporated (TXN) | Astera Labs, Inc. Common Stock (ALAB) |
|---|---|---|
| Revenue | 17.7B | 396M |
| Cost of Revenue | 7.6B | 94M |
| Operating Expenses | 4.1B | 419M |
| Gross Profit | 10.1B | 303M |
| EBITDA | 8.3B | -113M |
| EBIT | 6.3B | -116M |
| Interest Expense | 543M | 0 |
| Net Income | 5.0B | -83M |
| EPS | 5.45 | -0.64 |
| Fiscal Year | 2025 | 2024 |
Income Statement Analysis: The Bottom-Line Duel
This income statement comparison reveals how efficiently each company converts sales into profit, exposing the true power of their corporate engines.
Texas Instruments Incorporated Analysis
Texas Instruments’ revenue dipped slightly over five years to $17.7B in 2025, but its net income remained robust at $5B, reflecting strong operational control. The company maintains healthy gross (57%) and net margins (28%), illustrating efficient cost management. In 2025, TI sustained momentum with favorable revenue growth (13%) and stable EBIT, underscoring its steady profitability.
Astera Labs, Inc. Common Stock Analysis
Astera Labs grew revenue sharply by 242% to $396M in 2024, signaling rapid top-line expansion. However, this came at the expense of heavy operating losses, with EBIT margin at -29% and net margin at -21%, reflecting ongoing investment and scaling costs. Despite a favorable gross margin of 76%, the firm posted a net loss of $83M, indicating it is still in a growth and investment phase.
Verdict: Established Margin Strength vs. Emerging Growth Challenges
Texas Instruments clearly dominates in margin efficiency and profitability, generating steady net income despite modest revenue fluctuations. Astera Labs impresses with explosive revenue growth but struggles with negative profitability and high operating expenses. For investors prioritizing consistent earnings and margin power, Texas Instruments offers a more attractive and lower-risk profile compared to Astera’s early-stage expansion losses.
Financial Ratios Comparison
These vital ratios act as a diagnostic tool to expose the underlying fiscal health, valuation premiums, and capital efficiency of the companies compared below:
| Ratios | Texas Instruments Inc. (TXN) | Astera Labs, Inc. Common Stock (ALAB) |
|---|---|---|
| ROE | 30.7% (2025) | -8.6% (2024) |
| ROIC | 16.5% (2025) | -12.0% (2024) |
| P/E | 31.5 (2025) | -208.4 (2024) |
| P/B | 9.7 (2025) | 18.0 (2024) |
| Current Ratio | 4.35 (2025) | 11.7 (2024) |
| Quick Ratio | 2.83 (2025) | 11.2 (2024) |
| D/E | 0.86 (2025) | 0.0013 (2024) |
| Debt-to-Assets | 40.6% (2025) | 0.12% (2024) |
| Interest Coverage | 11.1 (2025) | 0 (2024) |
| Asset Turnover | 0.51 (2025) | 0.38 (2024) |
| Fixed Asset Turnover | 1.44 (2025) | 11.1 (2024) |
| Payout ratio | 100.0% (2025) | 0% (2024) |
| Dividend yield | 3.17% (2025) | 0% (2024) |
| Fiscal Year | 2025 | 2024 |
Efficiency & Valuation Duel: The Vital Signs
Financial ratios serve as a company’s DNA, unveiling underlying risks and operational strength critical for informed investment decisions.
Texas Instruments Incorporated
Texas Instruments posts a robust 30.7% ROE and a healthy 28.3% net margin, signaling strong profitability. Its valuation appears stretched with a P/E of 31.5 and P/B near 9.7, above sector averages. The firm supports shareholders with a 3.17% dividend yield, balancing returns with a reinvestment focus on R&D at 11.8% of revenue.
Astera Labs, Inc. Common Stock
Astera Labs suffers negative profitability with an ROE of -8.65% and a -21.1% net margin, reflecting operational challenges. Despite a favorable negative P/E due to losses, its P/B of 18.0 signals overvaluation. The company pays no dividend, instead allocating over 50% of revenue to R&D, indicating a growth-driven reinvestment strategy amid uncertain returns.
Premium Valuation vs. Operational Safety
Texas Instruments offers a better balance with strong profitability and steady dividends, despite a high valuation. Astera Labs’ metrics reveal significant operational risks and stretched valuation. Investors seeking stability may prefer Texas Instruments, while those favoring growth with higher risk might consider Astera Labs.
Which one offers the Superior Shareholder Reward?
I compare Texas Instruments (TXN) and Astera Labs (ALAB) on dividends, buybacks, and sustainability. TXN yields 3.17% with a near 100% dividend payout, fully covered by free cash flow of 2.86/share. TXN also runs steady buybacks, enhancing total return. ALAB pays no dividends, focusing on reinvestment with 0.78 free cash flow/share and minimal debt, but suffers consistent losses and negative margins. ALAB’s capital allocation favors growth over payouts but risks value dilution. TXN’s disciplined, sustainable distribution via dividends and buybacks offers superior total shareholder reward in 2026.
Comparative Score Analysis: The Strategic Profile
The radar chart reveals the fundamental DNA and trade-offs of Texas Instruments and Astera Labs, highlighting their financial strengths and valuation nuances:
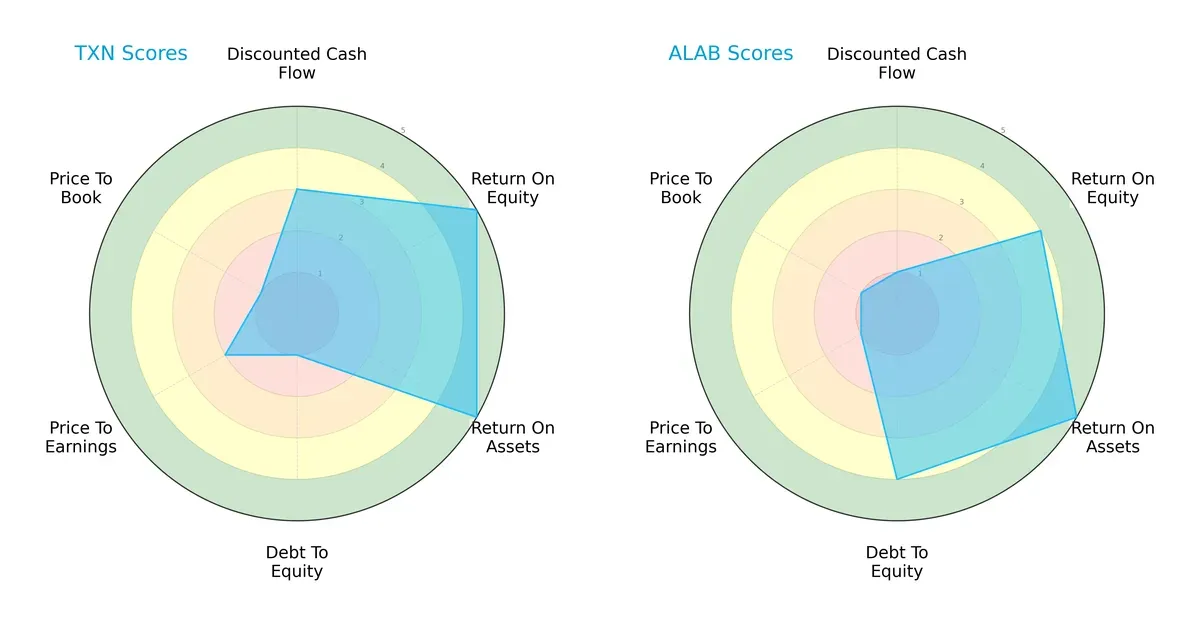
Texas Instruments excels in profitability with top ROE and ROA scores (5 each), but carries a heavy debt burden (Debt/Equity score 1). Astera Labs maintains a healthier balance sheet (Debt/Equity score 4) and competitive asset efficiency (ROA 5), yet suffers from weak cash flow valuation metrics (DCF score 1). TI shows a more uneven profile driven by leverage and profitability, while Astera Labs offers a steadier, albeit less aggressive, financial stance.
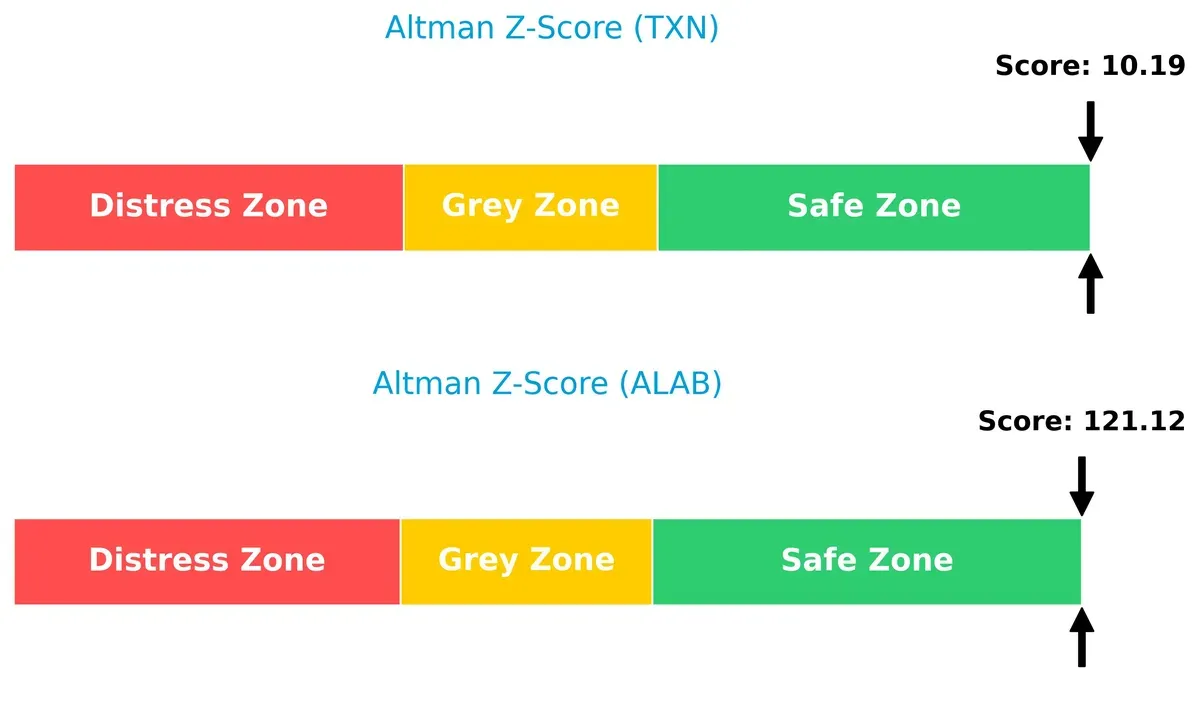
Bankruptcy Risk: Solvency Showdown
Texas Instruments and Astera Labs both reside comfortably in the safe zone by Altman Z-Score standards, but Astera Labs’ score (121.1) far exceeds TI’s (10.2), signaling markedly lower bankruptcy risk:
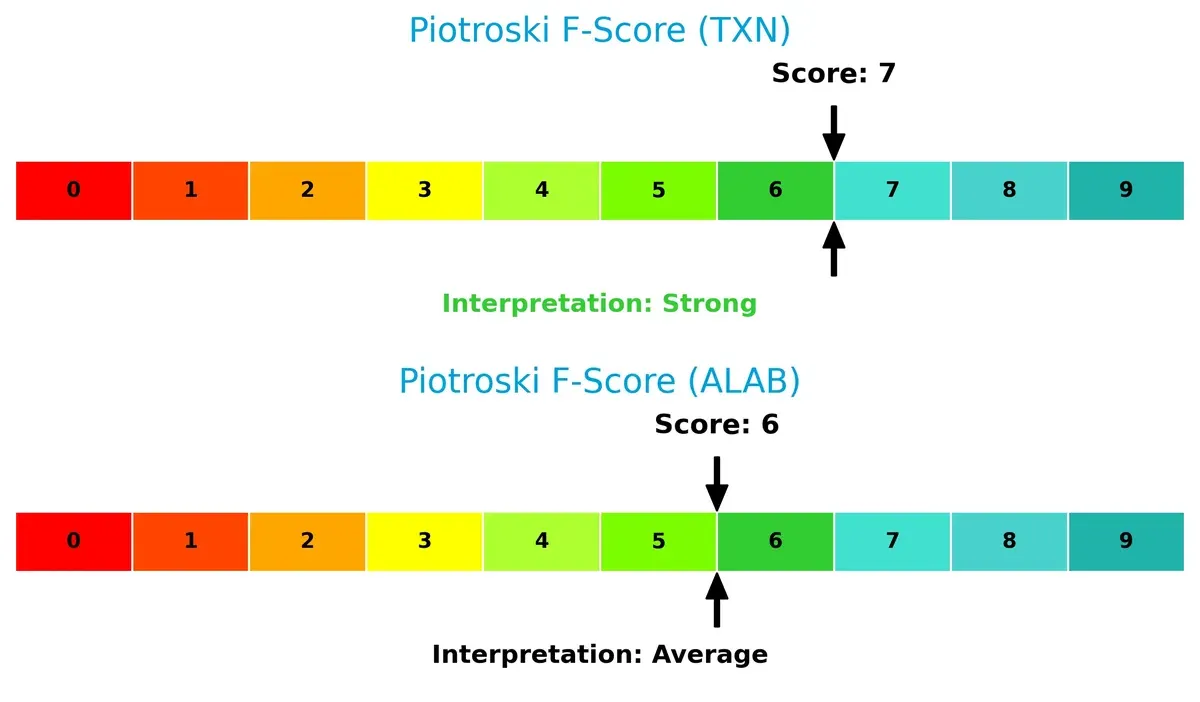
Financial Health: Quality of Operations
Texas Instruments demonstrates stronger financial health with a Piotroski F-Score of 7, suggesting robust operational quality. Astera Labs’ score of 6 is respectable but flags slight room for improvement in internal controls and efficiency:
How are the two companies positioned?
This section dissects the operational DNA of TXN and ALAB by comparing their revenue distribution and internal dynamics. The goal is to confront their economic moats and identify which model offers the most resilient, sustainable advantage today.
Revenue Segmentation: The Strategic Mix
The following visual comparison dissects how Texas Instruments and Astera Labs diversify their income streams and where their primary sector bets lie:
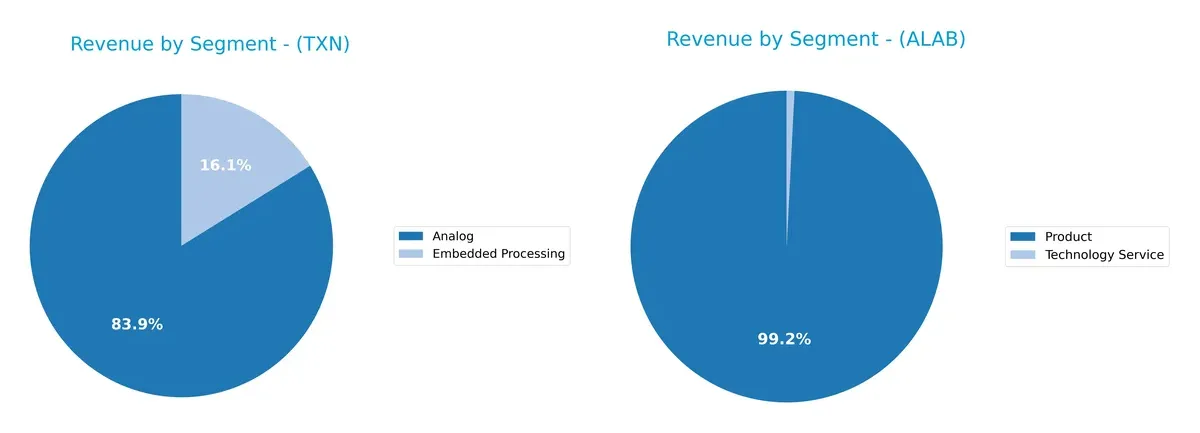
Texas Instruments anchors its revenue in the Analog segment with $14B in 2025, complemented by $2.7B from Embedded Processing, showing moderate diversification. In contrast, Astera Labs relies heavily on a single dominant Product segment at $393M, with minimal Technology Service revenue. TI’s broad portfolio reduces concentration risk and supports ecosystem lock-in, while Astera’s narrow focus implies higher vulnerability but potential for targeted innovation.
Strengths and Weaknesses Comparison
This table compares the Strengths and Weaknesses of Texas Instruments and Astera Labs based on key financial and market metrics:
Texas Instruments Strengths
- High net margin at 28.28%
- Strong ROE at 30.73%
- Favorable ROIC at 16.52%
- Broad global presence including US and China
- Diversified segments Analog and Embedded Processing
- High interest coverage at 11.52
Astera Labs Strengths
- Favorable quick ratio at 11.21
- Zero debt and low debt-to-assets at 0.12%
- High fixed asset turnover at 11.12
- Favorable PE ratio despite negative earnings
- Product revenue focus with emerging technology services
- Geographic exposure in Taiwan and China
Texas Instruments Weaknesses
- Unfavorable high PE of 31.53
- High PB ratio at 9.69
- Elevated current ratio at 4.35 signals inefficient asset use
- Neutral debt-to-equity and debt-to-assets
- Limited asset turnover at 0.51
Astera Labs Weaknesses
- Negative net margin at -21.05%
- Negative ROE and ROIC
- Unfavorable WACC at 10.89%
- Zero interest coverage indicating risk
- High PB ratio at 18.02
- Unfavorable current ratio at 11.71
- No dividend yield
The comparison highlights Texas Instruments’ robust profitability and global diversification, contrasting with Astera Labs’ early-stage financial challenges and limited profitability. Each company’s strengths and weaknesses reflect distinct stages and strategies within the semiconductor industry.
The Moat Duel: Analyzing Competitive Defensibility
A strong structural moat is the only barrier protecting long-term profits from relentless competitive pressures and market disruption:
Texas Instruments Incorporated: Durable Cost Advantage
Texas Instruments leverages a cost advantage rooted in scale and analog expertise. Its 57% gross margin and 35% EBIT margin highlight margin stability. In 2026, expansion into industrial and automotive markets should reinforce its moat despite declining ROIC trends.
Astera Labs, Inc. Common Stock: Emerging Network Effects
Astera Labs relies on network effects from its Intelligent Connectivity Platform for cloud and AI infrastructure. Despite negative net margins, rapid revenue growth signals expanding market penetration. Improvement in ROIC suggests a growing moat, yet profitability remains a key hurdle.
Verdict: Scale-Driven Cost Leadership vs. Early-Stage Network Expansion
Texas Instruments commands a wider and deeper moat with robust margins and consistent value creation despite ROIC decline. Astera Labs shows promise with rising ROIC but currently lacks profitability to defend market share effectively. Texas Instruments is better positioned to sustain its competitive edge in 2026.
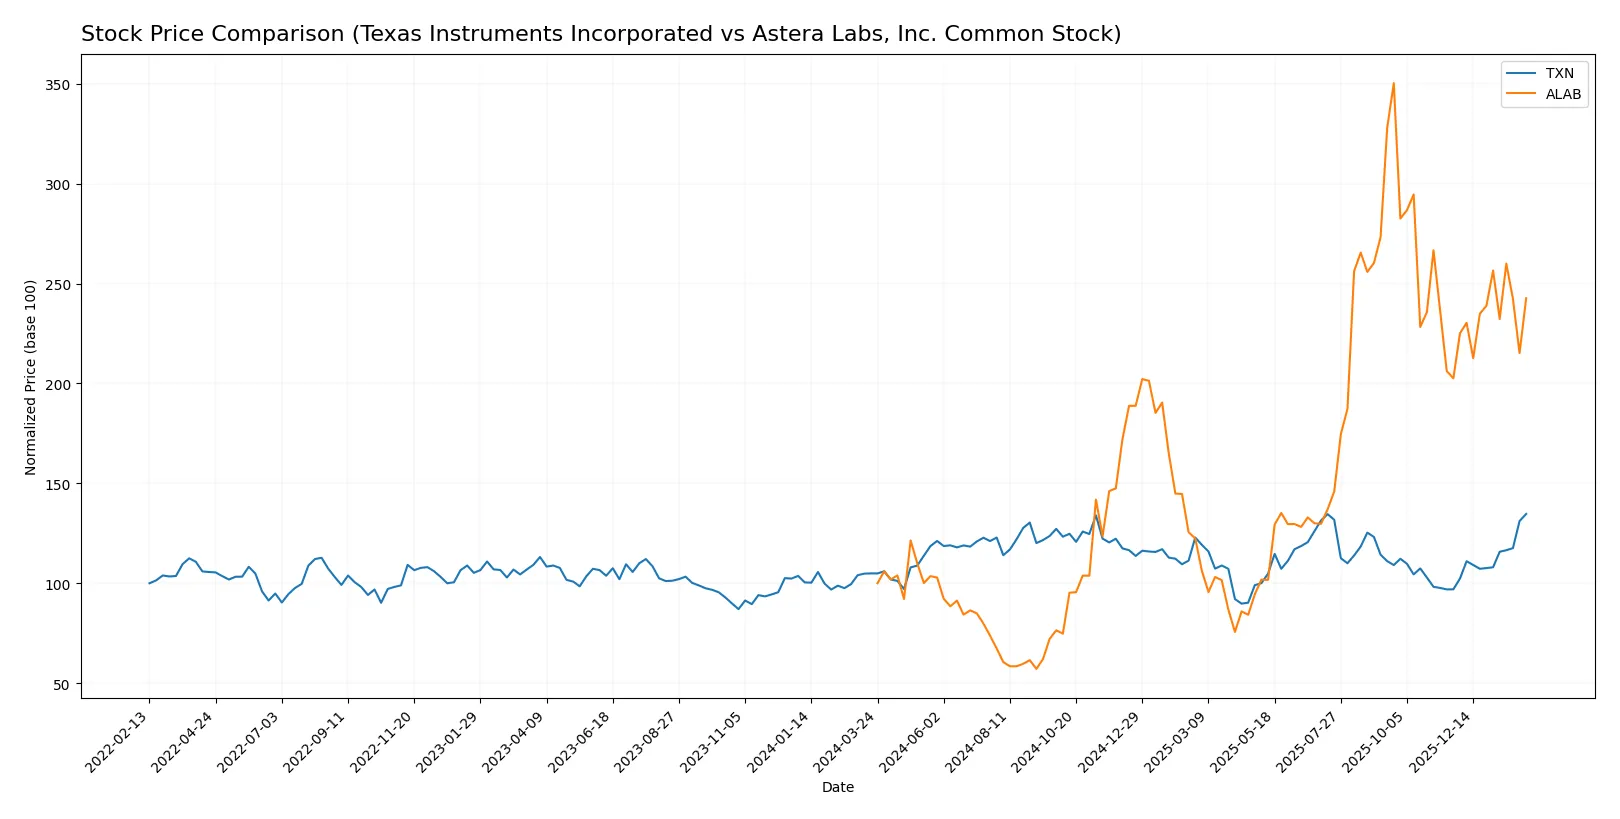
Which stock offers better returns?
Over the past year, both Texas Instruments and Astera Labs showed strong price gains, with notable acceleration phases and distinct trading dynamics shaping their upward trajectories.
Trend Comparison
Texas Instruments (TXN) price rose 28.36% over 12 months, exhibiting a bullish trend with accelerating momentum and a high of 221.44. Volatility remains moderate at 16.2% standard deviation.
Astera Labs (ALAB) surged 142.64% in the same period, marking a bullish and accelerating trend but with higher volatility at 50.55%. Its peak reached 245.2, reflecting significant price swings.
Astera Labs outperformed Texas Instruments substantially, delivering the highest market return despite elevated volatility and a weaker recent buyer dominance.
Target Prices
Analysts present a moderately bullish target consensus for Texas Instruments and Astera Labs.
| Company | Target Low | Target High | Consensus |
|---|---|---|---|
| Texas Instruments Incorporated | 160 | 260 | 204.64 |
| Astera Labs, Inc. Common Stock | 165 | 225 | 202.14 |
Analyst targets for Texas Instruments suggest a slight upside from its current price of 221.44 USD. Astera Labs’ consensus target exceeds its current price of 169.85 USD, reflecting optimism amid recent strong price gains.

Don’t Let Luck Decide Your Entry Point
Optimize your entry points with our advanced ProRealTime indicators. You’ll get efficient buy signals with precise price targets for maximum performance. Start outperforming now!
How do institutions grade them?
Texas Instruments Incorporated Grades
The following table summarizes recent institutional grades for Texas Instruments Incorporated:
| Grading Company | Action | New Grade | Date |
|---|---|---|---|
| Rosenblatt | Maintain | Buy | 2026-02-05 |
| Rosenblatt | Maintain | Buy | 2026-01-28 |
| Goldman Sachs | Maintain | Sell | 2026-01-28 |
| Deutsche Bank | Maintain | Hold | 2026-01-28 |
| Keybanc | Maintain | Overweight | 2026-01-28 |
| Stifel | Maintain | Hold | 2026-01-28 |
| Benchmark | Maintain | Buy | 2026-01-28 |
| Jefferies | Maintain | Hold | 2026-01-28 |
| B of A Securities | Upgrade | Neutral | 2026-01-28 |
| Wells Fargo | Maintain | Equal Weight | 2026-01-28 |
Astera Labs, Inc. Common Stock Grades
The following table summarizes recent institutional grades for Astera Labs, Inc. Common Stock:
| Grading Company | Action | New Grade | Date |
|---|---|---|---|
| Northland Capital Markets | Maintain | Outperform | 2025-12-09 |
| Northland Capital Markets | Upgrade | Outperform | 2025-11-17 |
| Needham | Maintain | Buy | 2025-11-05 |
| JP Morgan | Maintain | Overweight | 2025-11-05 |
| TD Cowen | Maintain | Hold | 2025-11-05 |
| Morgan Stanley | Maintain | Overweight | 2025-11-05 |
| Roth Capital | Maintain | Buy | 2025-11-05 |
| Stifel | Maintain | Buy | 2025-11-05 |
| Barclays | Downgrade | Equal Weight | 2025-10-20 |
| Stifel | Maintain | Buy | 2025-10-17 |
Which company has the best grades?
Astera Labs generally receives stronger grades with multiple “Buy” and “Outperform” ratings. Texas Instruments shows mixed grades including “Buy,” “Hold,” and “Sell.” Investors might perceive Astera Labs as having more bullish institutional sentiment.
Risks specific to each company
The following categories identify critical pressure points and systemic threats facing Texas Instruments Incorporated and Astera Labs, Inc. in the 2026 market environment:
1. Market & Competition
Texas Instruments Incorporated
- Established analog and embedded processing leader with diversified end markets, facing mature semiconductor competition.
Astera Labs, Inc. Common Stock
- Emerging player specializing in cloud and AI connectivity, exposed to intense innovation pressure and market entry challenges.
2. Capital Structure & Debt
Texas Instruments Incorporated
- Moderate leverage with debt-to-assets at 40.6%, interest coverage strong at 11.5x, signaling manageable debt risk.
Astera Labs, Inc. Common Stock
- Virtually no debt, debt-to-assets at 0.12%, but zero interest coverage due to lack of earnings and negative margins.
3. Stock Volatility
Texas Instruments Incorporated
- Beta near 1.0 indicates market-level volatility, trading within a stable price range.
Astera Labs, Inc. Common Stock
- High beta of 1.51 signals elevated volatility, price range wide from 47.1 to 262.9, reflecting speculative trading.
4. Regulatory & Legal
Texas Instruments Incorporated
- Operates globally with typical semiconductor regulatory risks; no major legal red flags reported.
Astera Labs, Inc. Common Stock
- Newer company with evolving compliance frameworks; regulatory environment for AI connectivity still developing, increasing uncertainty.
5. Supply Chain & Operations
Texas Instruments Incorporated
- Large scale manufacturing with mature supply chains but vulnerable to cyclical semiconductor shortages.
Astera Labs, Inc. Common Stock
- Small scale, reliant on third-party manufacturing; higher operational risk due to scale and supply chain infancy.
6. ESG & Climate Transition
Texas Instruments Incorporated
- Established ESG reporting and initiatives; faces pressure to reduce energy intensity in manufacturing.
Astera Labs, Inc. Common Stock
- ESG practices less mature; opportunities to build sustainable operations but currently limited transparency.
7. Geopolitical Exposure
Texas Instruments Incorporated
- Global footprint with exposure to US-China tech tensions and export controls impacting semiconductors.
Astera Labs, Inc. Common Stock
- Primarily US-based but sensitive to international cloud infrastructure regulations and trade policies.
Which company shows a better risk-adjusted profile?
Texas Instruments’ primary risk is moderate debt and exposure to cyclical semiconductor markets. Astera Labs faces the critical risk of negative profitability and operational infancy amid high volatility. TI’s stable cash flows and strong Altman Z-score contrast with Astera’s speculative profile. TI demonstrates a better risk-adjusted profile, benefiting from scale, financial strength, and diversified markets. The pronounced volatility and negative margins at Astera Labs justify caution, despite growth potential.
Final Verdict: Which stock to choose?
Texas Instruments showcases a superpower in delivering consistent value creation with a robust economic moat, driven by efficient capital allocation and solid profitability. Its declining ROIC trend is a point of vigilance. TXN fits well in portfolios seeking steady, slightly favorable growth with income stability.
Astera Labs carves out a strategic moat through rapid revenue growth and innovation in a niche market, despite currently shedding value. Its balance sheet strength and improving profitability profile offer relative safety compared to TXN’s mature cycle. ALAB suits investors targeting high-growth, higher-risk opportunities with a technology edge.
If you prioritize long-term value creation and income reliability, Texas Instruments is the compelling choice due to its proven moat and stable cash flows. However, if you seek aggressive growth and can tolerate volatility, Astera Labs offers superior upside potential fueled by accelerating innovation and expanding market share. Both demand careful risk management aligned with your investment horizon.
Disclaimer: Investment carries a risk of loss of initial capital. The past performance is not a reliable indicator of future results. Be sure to understand risks before making an investment decision.
Go Further
I encourage you to read the complete analyses of Texas Instruments Incorporated and Astera Labs, Inc. Common Stock to enhance your investment decisions: