Home > Comparison > Technology > TER vs ALAB
The strategic rivalry between Teradyne, Inc. and Astera Labs, Inc. defines the current trajectory of the semiconductor sector. Teradyne operates as a capital-intensive industrial giant, specializing in automated test equipment across diverse markets. In contrast, Astera Labs focuses on high-margin, semiconductor-based connectivity solutions for cloud and AI infrastructure. This analysis will determine which company’s distinct operational model offers the superior risk-adjusted outlook for a diversified technology portfolio.
Table of contents
Companies Overview
Teradyne, Inc. and Astera Labs, Inc. are pivotal players shaping the semiconductor connectivity and testing landscape.
Teradyne, Inc.: The Automatic Test Equipment Powerhouse
Teradyne dominates as a designer and manufacturer of automatic test equipment across semiconductor, system, industrial, and wireless test sectors. Its core revenue stems from testing solutions for wafers, memory devices, and wireless components. In 2026, Teradyne focuses strategically on expanding its industrial automation and 5G wireless testing capabilities, cementing its role in cutting-edge semiconductor validation.
Astera Labs, Inc. Common Stock: AI & Cloud Connectivity Innovator
Astera Labs specializes in semiconductor-based connectivity solutions tailored for cloud and AI infrastructure. Its Intelligent Connectivity Platform integrates data, network, and memory connectivity products with a software-defined architecture. The company’s 2026 strategy centers on scaling its platform to meet the growing demand for high-performance cloud and AI data centers.
Strategic Collision: Similarities & Divergences
Teradyne emphasizes comprehensive test equipment across multiple semiconductor segments, while Astera Labs pioneers connectivity solutions for cloud and AI infrastructure. Their primary battleground lies in enabling semiconductor performance for next-generation technologies. Teradyne offers a diversified, established portfolio with scale advantages; Astera Labs presents a focused, high-growth profile driven by innovation in AI connectivity.
Income Statement Comparison
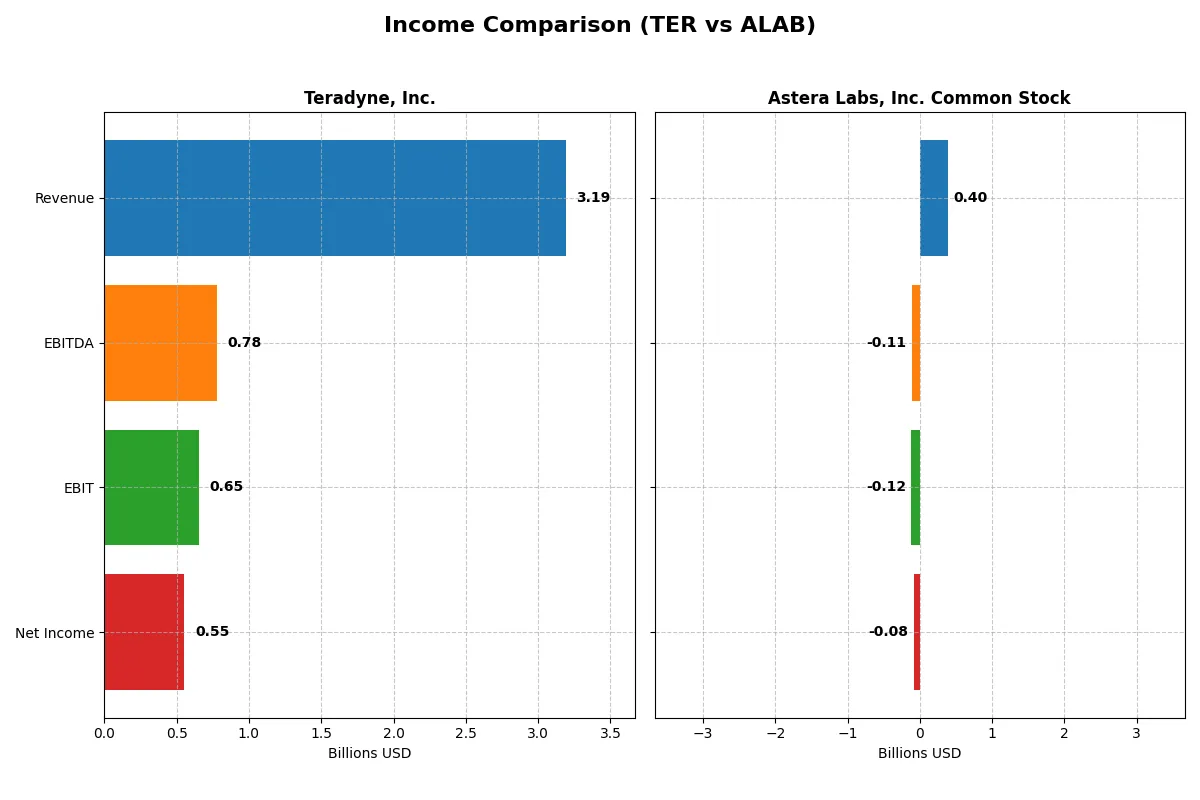
This data dissects the core profitability and scalability of both corporate engines to reveal who dominates the bottom line:
| Metric | Teradyne, Inc. (TER) | Astera Labs, Inc. Common Stock (ALAB) |
|---|---|---|
| Revenue | 3.19B | 396M |
| Cost of Revenue | 1.32B | 94M |
| Operating Expenses | 1.17B | 419M |
| Gross Profit | 1.87B | 303M |
| EBITDA | 780M | -113M |
| EBIT | 653M | -116M |
| Interest Expense | 8M | 0 |
| Net Income | 554M | -83M |
| EPS | 3.49 | -0.64 |
| Fiscal Year | 2025 | 2024 |
Income Statement Analysis: The Bottom-Line Duel
The income statement comparison reveals the true efficiency and profitability trends of two distinct corporate engines over recent years.
Teradyne, Inc. Analysis
Teradyne’s revenue shows a mixed trajectory, peaking at 3.7B in 2021 before declining to 3.19B in 2025. Net income follows a similar pattern, falling from 1.01B in 2021 to 554M in 2025. Its gross margin holds strong at 58.55%, while net margin remains favorable at 17.37%. The 2025 results highlight solid operational efficiency and positive momentum in EBITDA and EBIT growth despite overall net income softness.
Astera Labs, Inc. Common Stock Analysis
Astera Labs exhibits rapid revenue growth, soaring 242% from 116M in 2023 to 396M in 2024. However, it remains unprofitable with a net loss of 83M in 2024, despite a favorable gross margin of 76.38%. EBIT margin is deeply negative at -29.29%, reflecting high operating expenses outpacing revenue gains. The latest year shows strong revenue momentum but continued challenges in translating sales into positive net income.
Growth Momentum vs. Profitability Stability
Teradyne commands superior profitability with consistent positive margins and operational efficiency, while Astera Labs impresses with explosive revenue growth but persistent losses. Teradyne’s profile suits investors prioritizing stable, margin-driven earnings. Astera Labs appeals to those focused on high-growth potential despite near-term profitability risks.
Financial Ratios Comparison
These vital ratios act as a diagnostic tool to expose the underlying fiscal health, valuation premiums, and capital efficiency of the companies compared below:
| Ratios | Teradyne, Inc. (TER) | Astera Labs, Inc. Common Stock (ALAB) |
|---|---|---|
| ROE | 19.2% (2024) | -8.6% (2024) |
| ROIC | 17.2% (2024) | -12.0% (2024) |
| P/E | 36.9 (2024) | -208.4 (2024) |
| P/B | 7.1 (2024) | 18.0 (2024) |
| Current Ratio | 2.91 (2024) | 11.7 (2024) |
| Quick Ratio | 1.84 (2024) | 11.2 (2024) |
| D/E | 0.05 (2024) | 0.0013 (2024) |
| Debt-to-Assets | 3.6% (2024) | 0.12% (2024) |
| Interest Coverage | 166 (2024) | 0 (2024) |
| Asset Turnover | 0.76 (2024) | 0.38 (2024) |
| Fixed Asset Turnover | 4.88 (2024) | 11.1 (2024) |
| Payout ratio | 14.1% (2024) | 0% (2024) |
| Dividend yield | 0.38% (2024) | 0% (2024) |
| Fiscal Year | 2024 | 2024 |
Efficiency & Valuation Duel: The Vital Signs
Financial ratios serve as a company’s DNA, exposing both hidden risks and operational strengths that shape investment outcomes.
Teradyne, Inc.
Teradyne shows a favorable net margin of 17.37%, indicating solid profitability despite an unfavorable ROE and ROIC at zero. Its P/E ratio at 54.64 signals an expensive valuation. The company offers a modest 0.25% dividend yield, reflecting a cautious shareholder return amid moderate reinvestment in R&D at 16.3% of revenue.
Astera Labs, Inc. Common Stock
Astera Labs suffers from a negative net margin of -21.05% and negative returns on equity and invested capital. Its P/E ratio is negative, indicating losses, while the P/B ratio at 18.02 suggests an overstretched valuation. The firm pays no dividends, instead investing heavily in R&D at over 50% of revenue to fuel future growth.
Premium Valuation vs. Operational Struggles
Teradyne balances reasonable profitability with a high valuation, while Astera Labs faces deep losses and stretched multiples. Teradyne offers a more stable risk-reward profile. Investors prioritizing operational safety lean toward Teradyne; growth seekers willing to accept risk may consider Astera Labs’ aggressive reinvestment.
Which one offers the Superior Shareholder Reward?
Teradyne, Inc. (TER) pays a modest dividend yield of 0.38% in 2025, supported by a sustainable payout ratio near 14%. It also maintains strong free cash flow coverage and a consistent buyback program fueling total returns. Astera Labs (ALAB) pays no dividends and posts negative margins while reinvesting heavily in R&D and growth. Its share buybacks are negligible. I see Teradyne’s balanced distribution through dividends and buybacks as more dependable for long-term value. Astera’s model relies on riskier capital appreciation in a volatile early-stage phase. For 2026 investors prioritizing shareholder reward, TER offers a superior total return profile with clearer cash return and capital allocation discipline.
Comparative Score Analysis: The Strategic Profile
The radar chart reveals the fundamental DNA and trade-offs of Teradyne, Inc. and Astera Labs, Inc. Common Stock, illustrating their financial strengths and vulnerabilities:

Teradyne and Astera Labs share identical overall and ROE scores, indicating similar profitability efficiency. Both excel in ROA with a top score of 5. Astera Labs edges Teradyne with a stronger debt-to-equity score (4 vs. 3), signaling better financial stability. However, Teradyne shows a moderate advantage in discounted cash flow (2 vs. 1), implying a slightly more favorable future cash flow outlook. Both companies suffer from weak valuation scores (P/E and P/B at 1), suggesting market skepticism or potential undervaluation. Teradyne presents a more balanced mix of strengths, while Astera Labs relies heavily on its superior leverage profile.
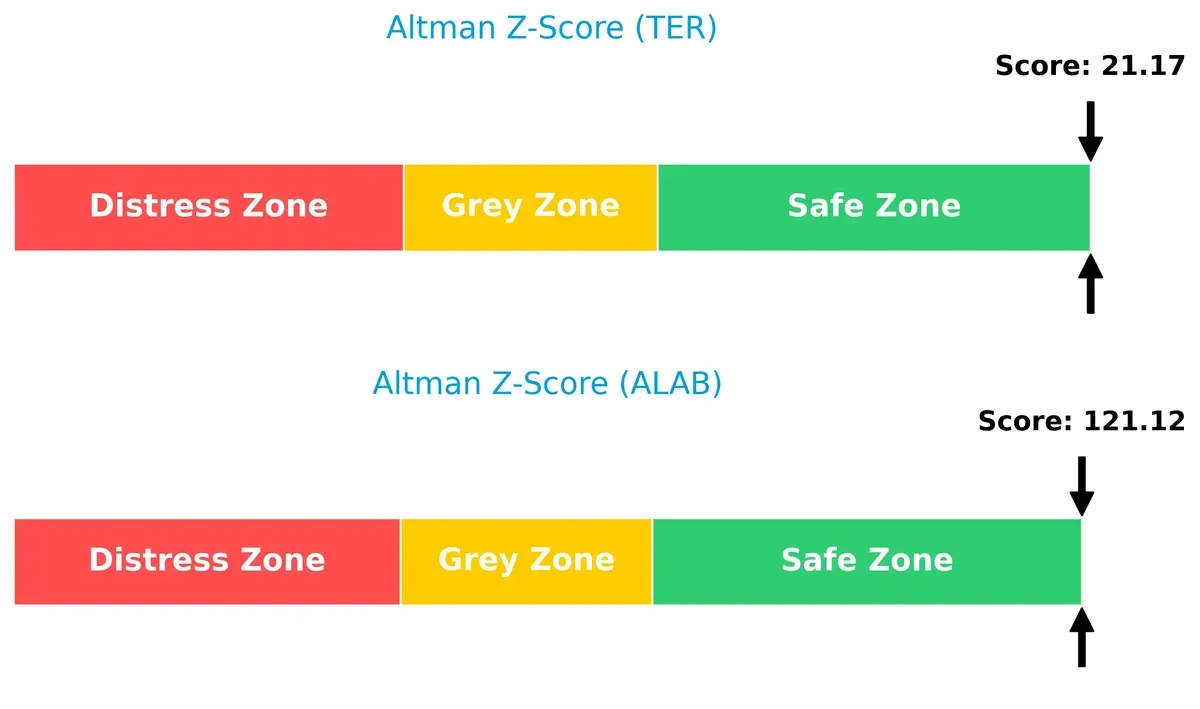
Bankruptcy Risk: Solvency Showdown
Teradyne and Astera Labs both reside safely above bankruptcy risk thresholds, but Astera Labs’ Altman Z-Score far exceeds Teradyne’s, highlighting its exceptionally robust solvency in this market cycle:
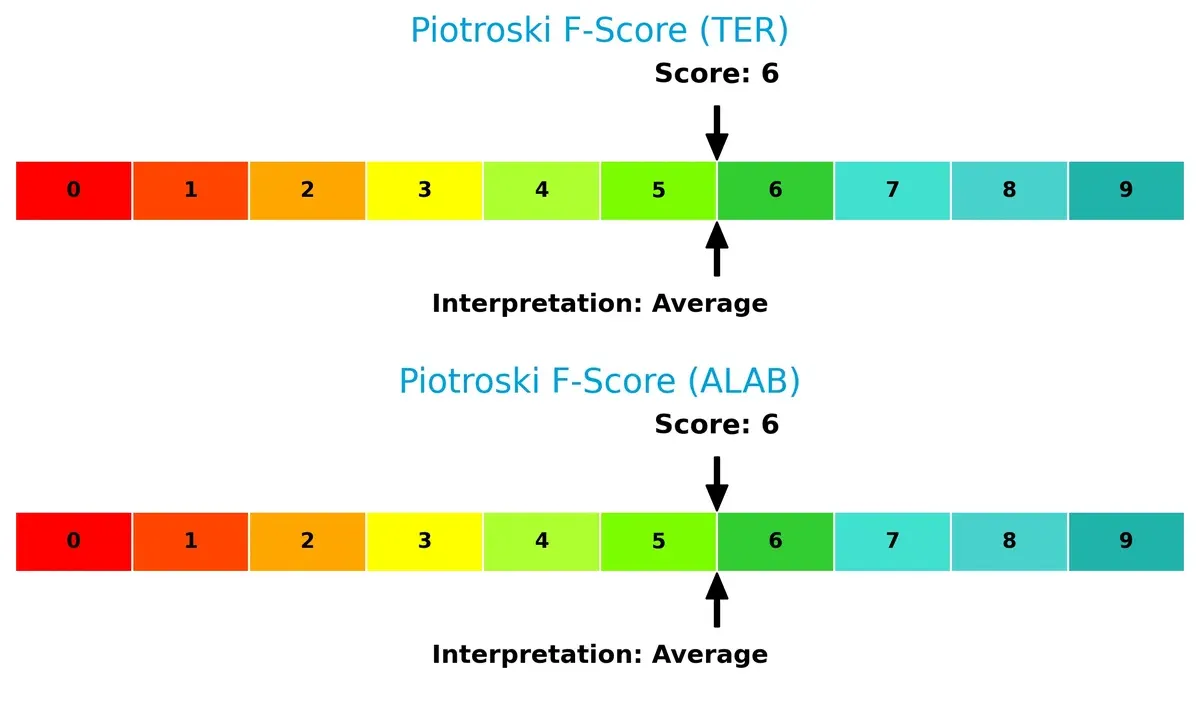
Financial Health: Quality of Operations
Both Teradyne and Astera Labs score a solid 6 on the Piotroski F-Score, indicating average financial health with no immediate red flags in operations or internal metrics:
How are the two companies positioned?
This section dissects the operational DNA of Teradyne and Astera Labs by comparing their revenue distribution and internal strengths and weaknesses. The goal is to confront their economic moats and identify which model offers the most resilient competitive advantage today.
Revenue Segmentation: The Strategic Mix
This visual comparison dissects how Teradyne, Inc. and Astera Labs, Inc. diversify their income streams and where their primary sector bets lie:
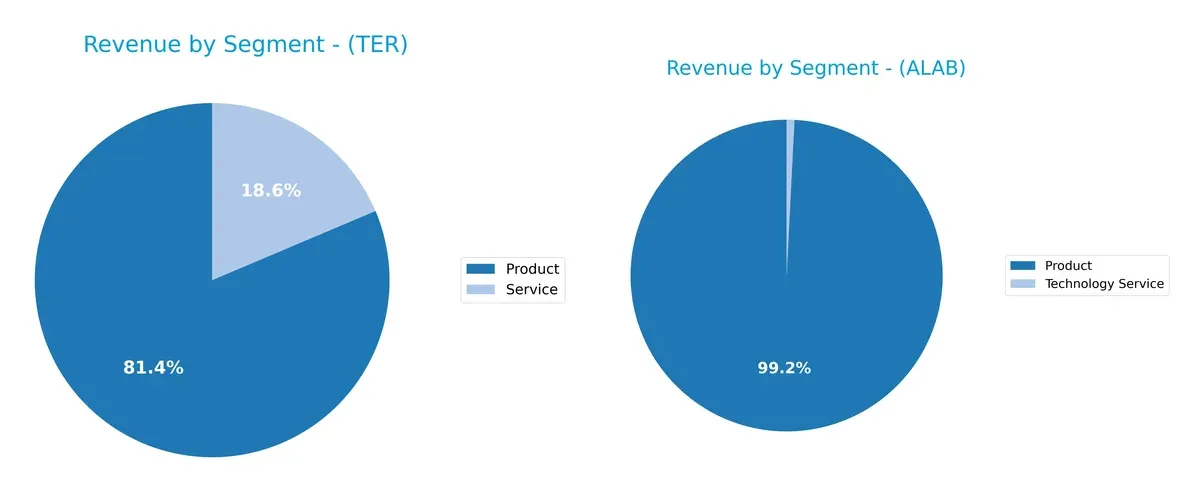
Teradyne anchors its revenue in Products with $2.29B in 2024, complemented by $525M in Services, showing moderate diversification. Astera Labs pivots heavily on Product sales at $393M, with minimal Technology Service revenue at $3.2M. Teradyne’s broader mix reduces concentration risk and suggests ecosystem lock-in, while Astera’s reliance on a single segment highlights vulnerability but potential focus in niche tech infrastructure.
Strengths and Weaknesses Comparison
This table compares the Strengths and Weaknesses of Teradyne, Inc. and Astera Labs, Inc. Common Stock:
Teradyne, Inc. Strengths
- Diverse long-term product and service revenue streams
- Solid global presence across multiple major regions
- Favorable net margin of 17.37%
- Strong interest coverage ratio at 81.43
- Low debt-to-assets ratio at 0%
- Favorable debt-to-equity profile
Astera Labs, Inc. Strengths
- Favorable quick ratio at 11.21 indicating liquidity
- Low debt-to-assets ratio at 12%
- Strong fixed asset turnover at 11.12
- Favorable price-to-earnings despite negative earnings
- Product revenue base with some geographic diversification
Teradyne, Inc. Weaknesses
- Unfavorable return on equity and ROIC at 0%
- Unavailable weighted average cost of capital
- High price-to-earnings ratio at 54.64
- Unfavorable current and quick ratios at 0
- Unfavorable asset turnover metrics
- Low dividend yield at 0.25%
Astera Labs, Inc. Weaknesses
- Negative net margin at -21.05%
- Negative ROE and ROIC at -8.65% and -11.97%
- High weighted average cost of capital at 10.96%
- Unfavorable current ratio despite strong quick ratio
- Zero interest coverage ratio
- Negative price-to-book ratio at 18.02
Teradyne exhibits strengths in global revenue diversity and financial stability but faces challenges in profitability and operational efficiency. Astera Labs shows liquidity and asset efficiency strengths but contends with significant profitability and cost of capital weaknesses, impacting its financial health and growth potential.
The Moat Duel: Analyzing Competitive Defensibility
A structural moat is the only fortress guarding long-term profits from relentless competitive erosion. Let’s dissect the moats of Teradyne and Astera Labs:
Teradyne, Inc.: Complex Systems Moat
Teradyne’s moat stems from its specialized automatic test equipment and system integration. It shows stable, favorable margins near 20% EBIT, reflecting strong pricing power. However, declining ROIC hints at mounting efficiency challenges in 2026.
Astera Labs, Inc. Common Stock: Innovation-Driven Moat
Astera Labs relies on cutting-edge semiconductor connectivity solutions for AI and cloud infrastructure. Despite negative margins and value destruction, its rapid revenue growth and rising ROIC suggest emerging competitive strength and room for expansion.
Verdict: Established Scale vs. Emerging Innovation
Teradyne holds a wider moat through entrenched industry presence and stable profitability. Astera Labs’ deeper but less proven innovation moat shows promise but remains riskier. Teradyne is better positioned to defend market share amid semiconductor complexity.
Which stock offers better returns?
Over the past 12 months, both Teradyne, Inc. and Astera Labs, Inc. Common Stock showed significant price gains with distinct momentum and trading patterns.
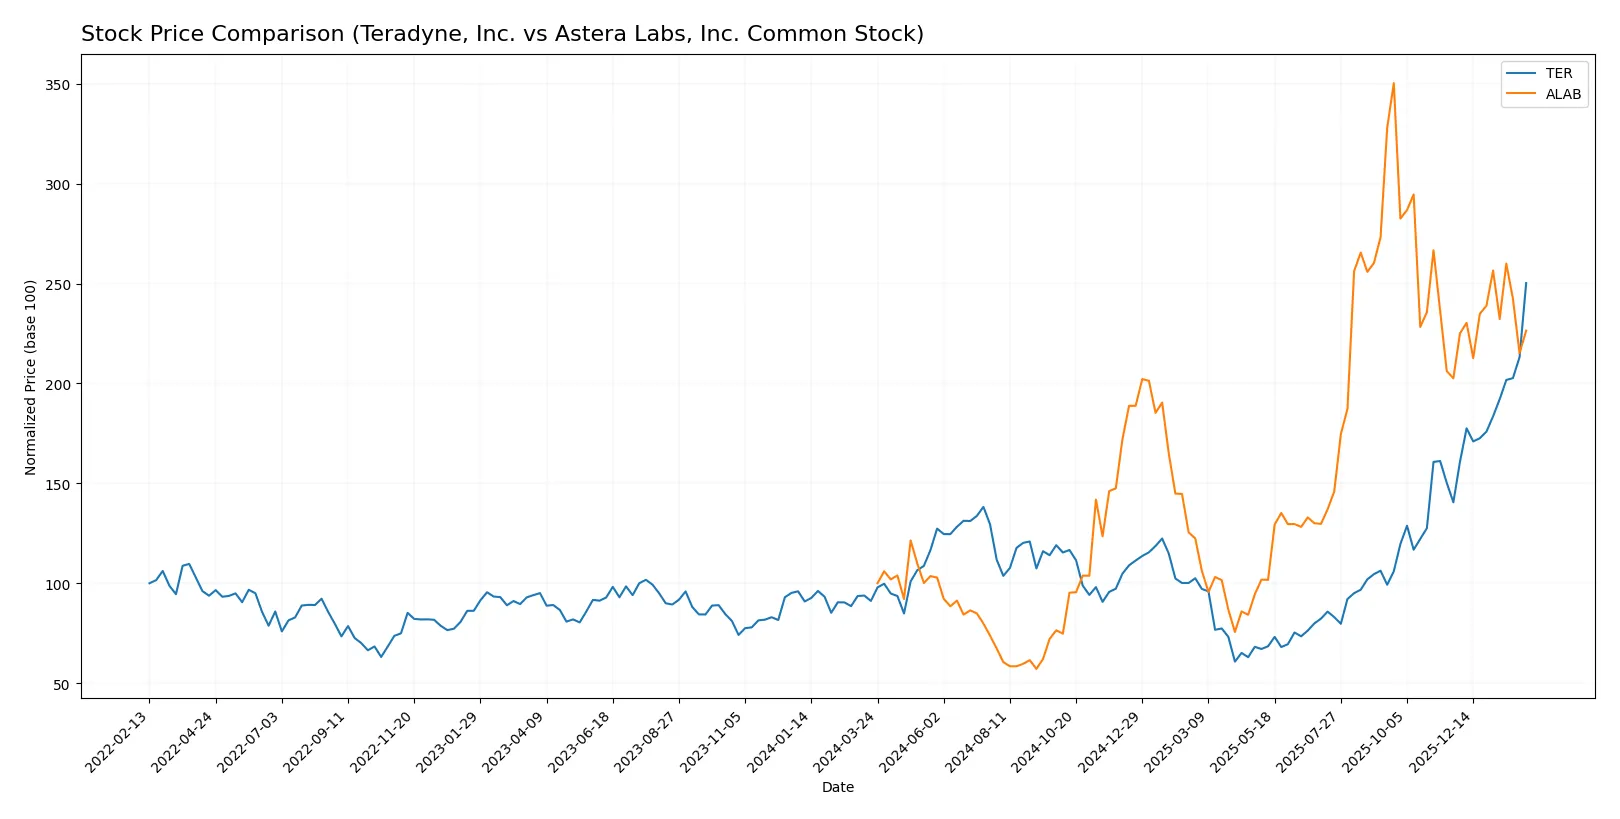
Trend Comparison
Teradyne, Inc. posted a strong bullish trend with a 174.58% price increase over the past year. The trend accelerated, reaching a high of 282.98 and showing robust buyer dominance.
Astera Labs, Inc. also gained 126.46%, marking a bullish but decelerating trend. Volatility was high with a 50.42 standard deviation, and recent gains slowed to 11.79% with neutral buyer activity.
Teradyne outperformed Astera Labs with higher total price appreciation and stronger acceleration, delivering the superior market return in the last year.
Target Prices
Analysts present a bullish consensus for Teradyne, Inc. and Astera Labs, Inc., reflecting optimism in semiconductor innovation.
| Company | Target Low | Target High | Consensus |
|---|---|---|---|
| Teradyne, Inc. | 175 | 300 | 251.17 |
| Astera Labs, Inc. | 165 | 225 | 202.14 |
Teradyne’s consensus target at 251.17 sits slightly below its current price of 282.98, suggesting modest downside risk. Astera Labs’ consensus target of 202.14 exceeds its current 158.52 price, indicating significant upside potential.

Don’t Let Luck Decide Your Entry Point
Optimize your entry points with our advanced ProRealTime indicators. You’ll get efficient buy signals with precise price targets for maximum performance. Start outperforming now!
How do institutions grade them?
Teradyne, Inc. Grades
Here are the latest institutional grades for Teradyne, Inc.:
| Grading Company | Action | New Grade | Date |
|---|---|---|---|
| Evercore ISI Group | maintain | Outperform | 2026-02-03 |
| Cantor Fitzgerald | maintain | Overweight | 2026-02-02 |
| Stifel | maintain | Buy | 2026-01-30 |
| UBS | maintain | Buy | 2026-01-26 |
| B of A Securities | maintain | Buy | 2026-01-22 |
| Stifel | maintain | Buy | 2026-01-14 |
| B of A Securities | maintain | Buy | 2026-01-13 |
| Goldman Sachs | upgrade | Buy | 2025-12-16 |
| Stifel | upgrade | Buy | 2025-12-02 |
| Citigroup | maintain | Buy | 2025-11-12 |
Astera Labs, Inc. Common Stock Grades
Here are the latest institutional grades for Astera Labs, Inc. Common Stock:
| Grading Company | Action | New Grade | Date |
|---|---|---|---|
| Northland Capital Markets | maintain | Outperform | 2025-12-09 |
| Northland Capital Markets | upgrade | Outperform | 2025-11-17 |
| Needham | maintain | Buy | 2025-11-05 |
| JP Morgan | maintain | Overweight | 2025-11-05 |
| TD Cowen | maintain | Hold | 2025-11-05 |
| Morgan Stanley | maintain | Overweight | 2025-11-05 |
| Roth Capital | maintain | Buy | 2025-11-05 |
| Stifel | maintain | Buy | 2025-11-05 |
| Barclays | downgrade | Equal Weight | 2025-10-20 |
| Stifel | maintain | Buy | 2025-10-17 |
Which company has the best grades?
Teradyne consistently receives strong Buy and Outperform grades from major firms, indicating robust institutional confidence. Astera Labs has solid Buy and Outperform ratings but also holds some Hold and Equal Weight grades, suggesting more mixed sentiment. Investors may interpret Teradyne’s grades as a sign of broader analyst conviction.
Risks specific to each company
The following categories identify critical pressure points and systemic threats facing both firms in the 2026 market environment:
1. Market & Competition
Teradyne, Inc.
- Established player with diversified semiconductor test segments faces intense competition but leverages broad industry relationships.
Astera Labs, Inc. Common Stock
- Newer entrant focused on AI and cloud infrastructure connectivity, competing in a fast-evolving niche with high innovation demands.
2. Capital Structure & Debt
Teradyne, Inc.
- Strong balance sheet with favorable debt-to-equity and interest coverage ratios, indicating low financial risk.
Astera Labs, Inc. Common Stock
- Low debt levels and favorable debt-to-assets but limited interest coverage raises concern over financing sustainability.
3. Stock Volatility
Teradyne, Inc.
- High beta of 1.82 suggests above-average stock volatility, reflecting sensitivity to market swings.
Astera Labs, Inc. Common Stock
- Beta of 1.51 indicates elevated volatility typical for its growth stage but slightly less reactive than Teradyne.
4. Regulatory & Legal
Teradyne, Inc.
- Operates globally with complex compliance but benefits from decades of regulatory experience.
Astera Labs, Inc. Common Stock
- Faces regulatory uncertainty as a newer tech firm in AI/cloud sectors, increasing legal risk exposure.
5. Supply Chain & Operations
Teradyne, Inc.
- Established global supply chain supports diverse product segments but exposed to semiconductor cycle fluctuations.
Astera Labs, Inc. Common Stock
- Smaller scale and recent IPO raise operational risks amid supply chain disruptions in high-tech components.
6. ESG & Climate Transition
Teradyne, Inc.
- Increasing ESG focus with industrial automation segment; legacy operations require ongoing climate risk management.
Astera Labs, Inc. Common Stock
- Emerging player with opportunity to integrate ESG from inception but faces pressure to prove sustainable practices.
7. Geopolitical Exposure
Teradyne, Inc.
- US-based but global exposure to trade tensions and semiconductor export controls creates geopolitical risk.
Astera Labs, Inc. Common Stock
- Primarily US-focused but supply chain and market in cloud/AI expose it to geopolitical tech restrictions.
Which company shows a better risk-adjusted profile?
Teradyne’s greatest risk lies in market competition and stock volatility due to its mature but cyclical semiconductor segments. Astera Labs faces steep regulatory and operational risks as a young firm navigating AI infrastructure markets. Teradyne’s robust capital structure and established operations deliver a superior risk-adjusted profile. Astera’s recent IPO and weak financial metrics amplify its risk, despite growth potential. The sharp contrast in interest coverage and operating scale justifies my caution toward Astera’s financial stability.
Final Verdict: Which stock to choose?
Teradyne’s superpower lies in its robust cash generation and efficient capital use, supported by a strong balance sheet and consistent profitability. Its point of vigilance is the declining ROIC trend, signaling potential challenges in sustaining competitive advantage. Teradyne fits well in portfolios targeting steady, aggressive growth with a tolerance for operational cyclicality.
Astera Labs offers a strategic moat through rapid innovation and high gross margins, reflecting its cutting-edge technology positioning. While it shows financial instability and negative returns, its high current ratio provides a cushion against short-term risks. Astera is better suited for investors seeking high-risk, high-reward opportunities in emerging tech sectors, aligned with GARP strategies.
If you prioritize reliable cash flow and proven operational efficiency, Teradyne is the compelling choice due to its mature market position and financial resilience. However, if you seek rapid growth potential and can weather volatility, Astera Labs offers a superior innovation-driven profile despite current profitability headwinds. Both present analytical scenarios tailored to distinct investor appetites.
Disclaimer: Investment carries a risk of loss of initial capital. The past performance is not a reliable indicator of future results. Be sure to understand risks before making an investment decision.
Go Further
I encourage you to read the complete analyses of Teradyne, Inc. and Astera Labs, Inc. Common Stock to enhance your investment decisions: